Chapter 11: Correlation, causation and confounding variables
When there is a set of data containing two variables that might be related, we refer to this data as bivariate. Often the goal of a statistical analysis is to determine the nature of the relationship between these two variables. For example, cancer epidemiologists may want to investigate the relationship between smoking and lung cancer. One way to do this is to perform a bivariate analysis by looking at both the incidence of cancer and the number of cigarettes smoked by individuals.
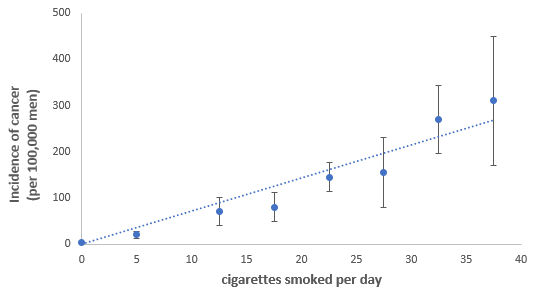
You can see from the graph that as the number of cigarettes smoked per day increases so does the incidence of cancer. We can say that these two variables are correlated. Correlation (sometimes called dependence) is any statistical relationship between two variables.
Furthermore, we can say that there is a positive correlation between with the number of cigarettes smoked per day and the incidence of cancer – positive because as one variable increases so does the other. Variables can also be negatively correlated. That is, as one variable increases the other decreases.
One vital point about correlation is that just because there is a correlation between two variables, it does not necessarily follow that there is a causal relationship between them.
We can explain correlations in four broad ways:
- The correlation is occurring purely by chance and the variables are not in fact correlated.
- It could be that variable x causes variable y.
- It could be that variable y causes variable x.
- The correlation is real but there is a third variable which causes x and y.
If we think specifically about the case of smoking and cancer, we can rule out that the correlation is occurring purely by chance simply due to the sample size of these kinds of studies and the strength of the correlation (see below).So the question is now, why are these two variables correlated? It seems unlikely that getting cancer would increase your desire to smoke! A more plausible explanation is that smoking causes cancer but that still leaves the possibility of a third variable (or confounding variable) which is responsible for the relationship. This is the argument or alternative hypothesis put forward by tobacco companies. That is, that smoking itself does not cause cancer but rather there is another variable which is associated with smoking that is actually causing the cancer. It might be that smokers also tend to consume more alcohol and it is the increased alcohol consumption (the confounding variable) that causes the increased incidence of cancer.
Determining causation can be difficult and time-consuming. It often requires rigorous experiments using large datasets. Ideally, such experiments lead to functional data, whereby manipulating the cause (independent variable) changes the effect (dependent variable). Tobacco companies exploit this difficulty in establishing causal links between associated variables to deflect criticism on the effects on health of smoking. However, in this specific case, some testable predictions have been used to further demonstrate the link. For example, stopping smoking or smoking filtered versus unfiltered cigarettes both should and do decrease the incidence of cancer.
