11.6 Practice problems
 Which of the following correlation coefficients (r) indicates the strongest correlation?
- r = 0.45
- r = –0.5
- r = 0.3
- r = –0.2
- Is it correct to calculate the Pearson’s correlation coefficient for blood type and the duration of hospitalisation following COVID-19 infection expressed by the number of days? Explain your answer.
- The degree of late gadolinium enhancement (a measure of cardiac injury) was found to correlate to circulating troponin I levels (r = 0.52). Is it correct to say that the degree of late gadolinium enhancement explains 52% of the variation in troponin I levels?
- In recent research, a correlation was found between the latitude people live in the US and the mortality rate due to skin cancer. A scatter plot revealed that the relationship appeared to be linear, and the correlation coefficient of the data was –0.71. The researchers concluded that the major contributing factor to skin cancer in the population is the amount of sunlight people receive. Why might this conclusion be incorrect? See if you can propose some confounding variables to explain this correlation.
- A colorimetric spectrophotometric assay was conducted to determine protein concentrations. A series of bovine serum albumin (BSA) standards were measured in the assay and the absorbance values determined.
| BSA (mg/ml) | Absorbance |
| 0 | 0.03 |
| 0.1 | 0.03 |
| 0.2 | 0.1 |
| 0.3 | 0.09 |
| 0.4 | 0.12 |
| 0.5 | 0.16 |
| 0.6 | 0.15 |
| 0.8 | 0.26 |
| 0.9 | 0.24 |
| 1 | 0.31 |
-
- Plot this data on a graph.
- What is the correlation coefficient for this data?
- What is the linear regression equation for this data?
- What is the concentration of a solution with an absorbance of 0.135?
- The following additional BSA standards were measured.
| BSA (mg/ml) | Absorbance |
| 1.4 | 0.37 |
| 1.5 | 0.36 |
| 1.6 | 0.37 |
Add these data points to your graph and describe what they show. What are the implications of these additional data points?

Football and COVID-19 – A correlation?

The COVID-19 pandemic spawned an unprecedented number of scientific publications. It was a huge challenge for clinicians and biomedical scientists to navigate this literature. Many variables were shown to correlate with COVID-19 susceptibility or severity including blood group, vitamin D levels, air quality, socio-economic status, population density and more. For many of these variables a plausible hypothesis for a causal link to COVID-19 could be put forward. However, testing that causal link is much harder. It is difficult to design controlled experiments to demonstrate cause and effect as it is not possible in most cases to manipulate the independent variable (e.g. air quality) and randomly allocate individuals to different test groups to see the effect on the dependent variable (COVID-19 susceptibility or severity). For many of the correlating variables, we know there is no direct causal relationship but identifying the likely variable to explain the correlation is not straightforward.
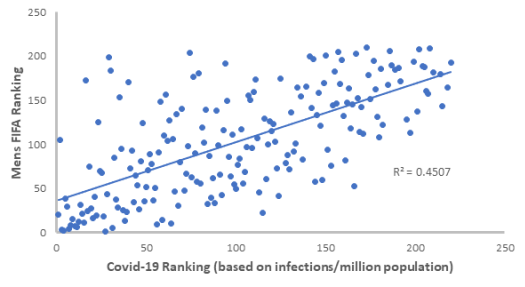
A paper published in the journal Clinical Microbiology and Infection (Ayoub et al., 2021) provided a humorous but cautionary example of one correlation. The authors discovered that there was a strong positive correlation between the number of COVID-19 infections in a country and its global ranking in the Fédération Internationale de Football Association (FIFA).
Each point in the next graph represents an individual country’s global COVID-19 ranking (based on the total number of COVID-19 infections per million people, as of July 2021) plotted against its men’s FIFA football ranking (based on the importance, outcomes and relative strengths of opposition in international matches over the previous four years, as of July 2021).
What does this correlation mean? Does it mean that people who are good footballers are at increased risk of catching COVID-19 or at increased risk of spreading it? Possibly it means that COVID-19 makes you a better footballer – this seems unlikely!
However, a good biomedical scientist should never ignore a correlation. While there may not be a direct link, we can think about any confounding or explanatory variables that link football and COVID-19 infection.
