7.6 Boffin questions
 Determining an unknown concentration using spectrophotometry
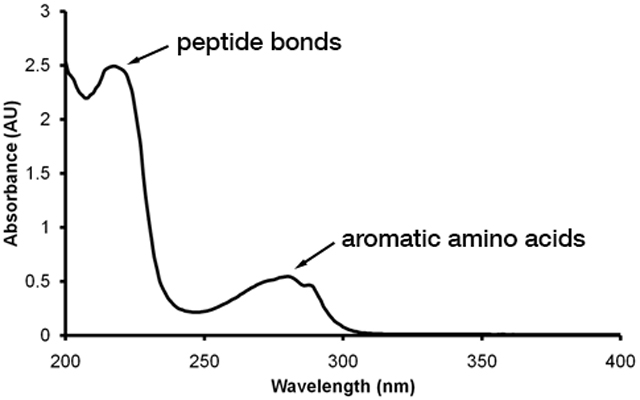
Many molecules absorb light in the visible or ultraviolet portion of the electromagnetic spectrum. Spectrophotometry is a measure over what wavelengths and by what amount molecules absorb light. This technique uses a device known as a spectrophotometer which can pass light of a specific wavelength and known intensity through a solution and determine the amount of light transmitted. This can be used qualitatively to identify compounds as different molecules will have characteristic absorbance spectra. That is, they will absorb light at specific wavelengths. For example, proteins absorb light in the UV range with maxima at 220 nm due to absorbance by peptide bonds and at 280 nm due to aromatic amino acid side chains.
Absorbance can also be used quantitatively as the amount of light absorbed by a molecule in solution follows a linear relationship with its concentration. This relationship is described by Beer’s law:
A = εbc
where
A is the absorbance
b is the pathlength of light through the solution (cm)
c is the concentration of the analyte (M)
ε is the wavelength-dependent molar extinction coefficient or molar absorption coefficient
(M–1 cm–1).
Using Beer’s law, you can calculate the concentration of a solution based on how much light it absorbs. There are two ways to do this.
- If the molecule is well-characterised its molar extinction coefficient (ε) may be known and absorbance need only be measured over a defined pathlength to determine the concentration.
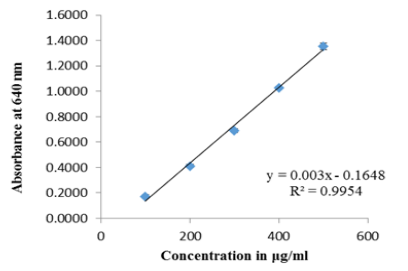
- You can prepare a series of known concentrations of the same molecule that you are trying to determine the concentration of in your sample. Then you measure the absorbance of those solutions alongside that of the sample with unknown concentration. From this you can then work out the equation for the line of known concentrations with their corresponding absorbances (called a standard curve or calibration curve). Then you can use this equation to determine the concentration of the unknown sample from its absorbance.
How spectrophotometers work
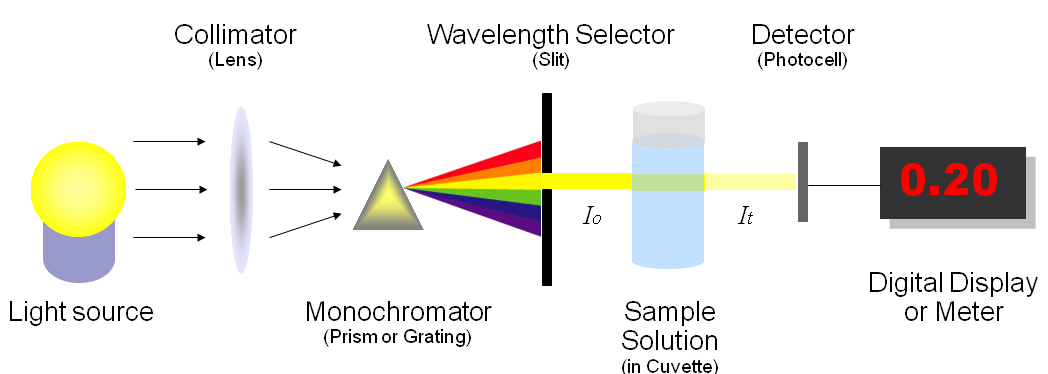
First a collimator lens transmits a straight beam of light through a monochromator (prism) to split it into several component wavelengths (spectra). Then a wavelength selector transmits only the desired wavelengths, through the solution to be measured with a defined pathlength. A photometer then detects the number of photons transmitted and sends a signal which is converted to absorbance and displayed.
Determining an unknown concentration
- The molar extinction coefficient of ATP is 15,400 M–1 cm–1 at 260 nm. A solution of purified ATP has an absorbance of 0.8 in a 1 cm cuvette. What is its concentration?
- Below (Figure 7.3) is a standard curve for a spectrophotometric cholesterol assay, measured at 640 nm. What is the concentration of a sample with an absorbance of 0.865?