9.3 Using data to make a diagnosis
Blood tests and other diagnostics are important for health practitioners to be able to make informed evaluations of patients. Collection of this data is central to evidence-based medicine.
So, imagine you have a blood test.
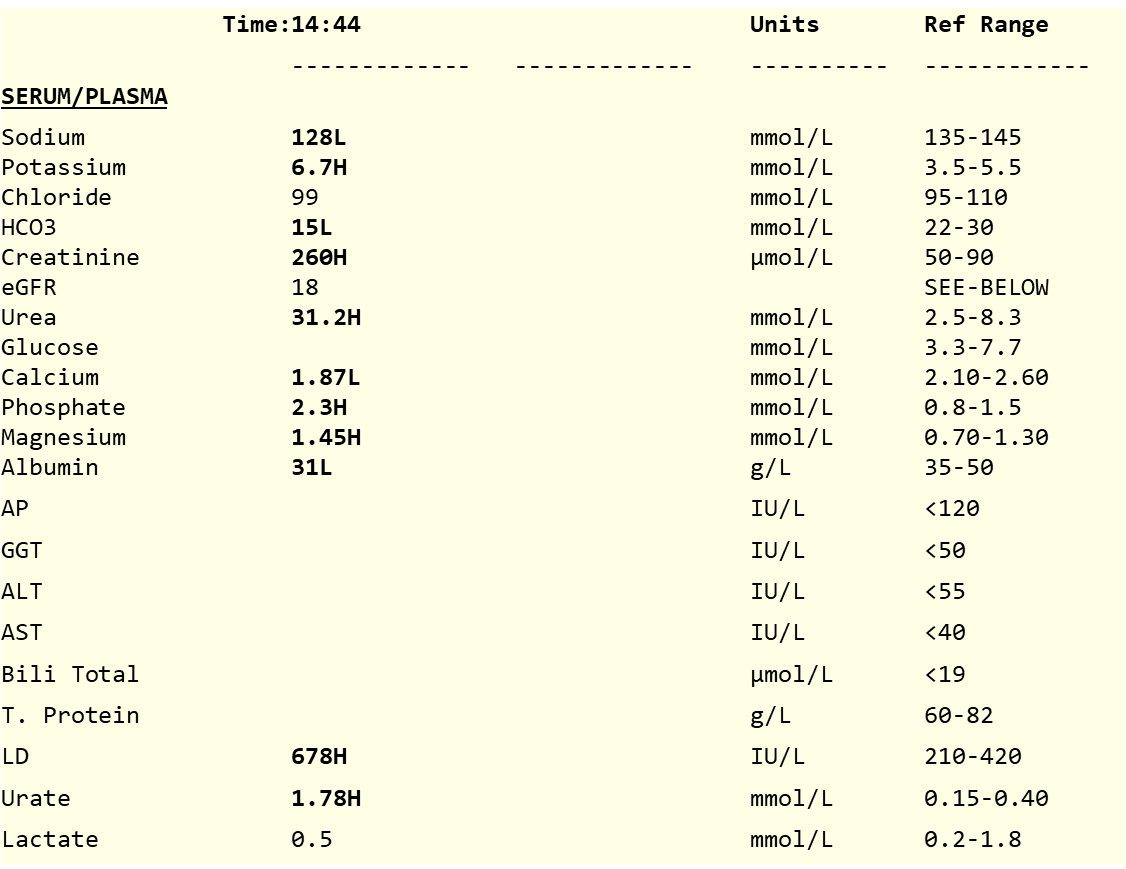
How does your clinician interpret this data? They will look at the concentration of the analytes on the left and compare them to the range of values or threshold on the right, which represent the ‘normal’ values. Any analyte outside the range is potentially indicative of a problem or abnormality and will help form a diagnosis. There are two important questions to consider here:
- How do we know if a measurement is normal? How are normal ranges of data and threshold determined? Data collected from patients will exhibit variability from patient to patient, so it is important to understand the amount of variability there is in this data across the population to know if a measure is likely to be normal or abnormal.
- How reliable are the measurements? How do we know the data collected for an individual patient is reliable?
