11.5 Misleading regression models
There are some things to note about R2. First, it does not always indicate how well a regression model fits the data. It is possible that a good model has a low R2 value, and a biased model has a high R2 value.You need to examine scatter plots to see how well a regression model fits the data and a good way to check is to plot the residuals. Residuals are measured values minus the predicted value.Look at the next figures, again examining the relationship between number of cigarettes smoked per day and the incidence of cancer, in this case lung cancer. In both scatter plots, A and B, there is a strong positive correlation, and the data appears to fit the linear regression line well.
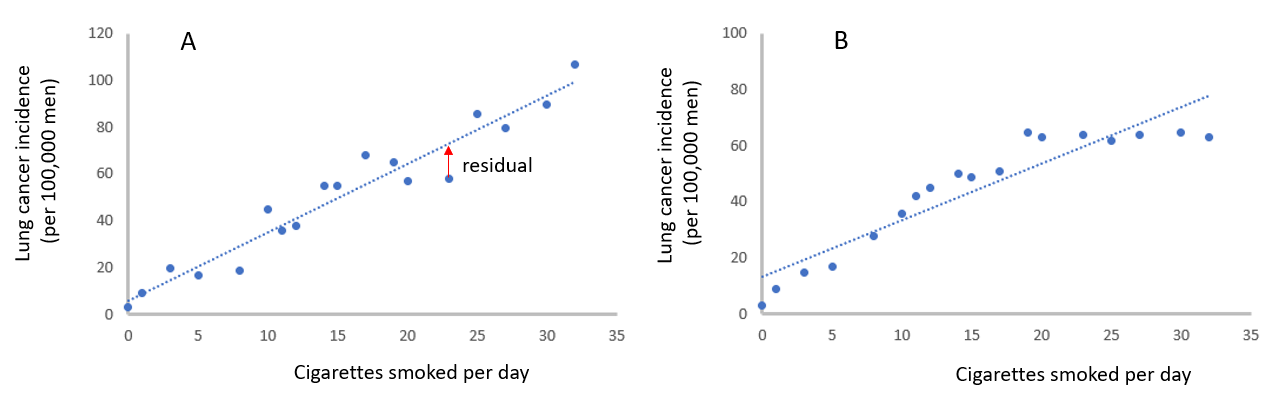
However, you may notice that in plot B the incidence of lung cancer consistently falls below the regression line for the high values of cigarettes smoked. This indicates a possible bias in the model. To test for biases, the values of the residuals (measured value – predicted value) can be calculated and plotted. The next figure shows residual plots for the datasets A and B above.
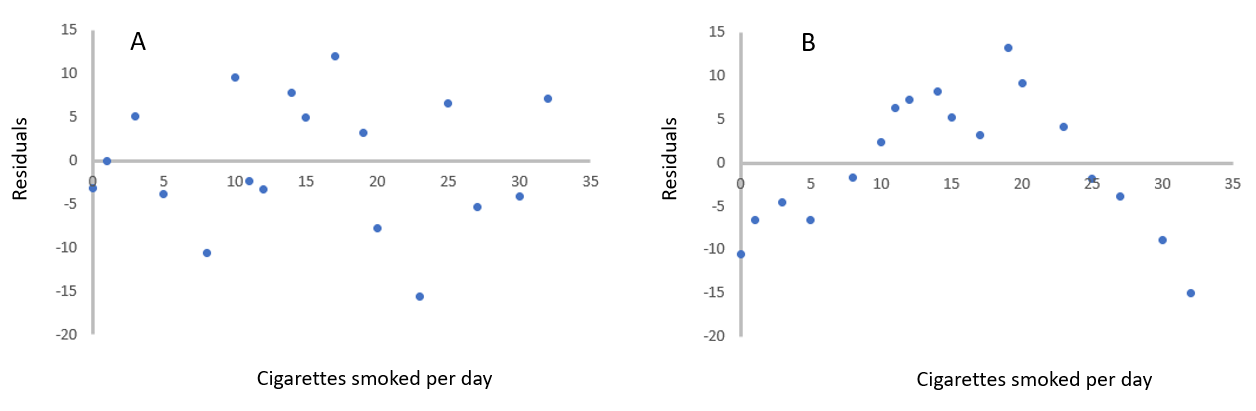
If the regression model is unbiased the residual plot should reveal that the residual values are randomly scattered above and below the regression line (plot A). However, in the residual plot data for B you can see that at the extreme low and high ends the residuals are consistently below the regression line and in the middle range of cigarettes smoked per day are consistently above the regression line. A curved rather than a linear model would fit dataset B much better. It is always crucial to plot the data!
