11.1 Investigating the relationship between two variables
When investigating the relationship between two variables the first step is to display the data graphically on a scatter plot. This allows you to see if the two variables appear correlated. Often you will be able to see if the relationship between the two variables appears linear.
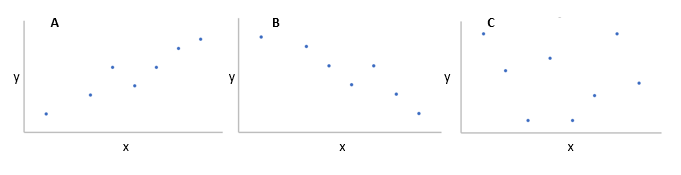
A represents a positive correlation between x and y, B represents a negative correlation and C no correlation.For the three datasets plotted above we can clearly see that:
- for A, there is a positive correlation between x and y
- for B, there is a negative correlation between x and y
- for C, there is no correlation between x and y.
After this the most important techniques for investigating the relationship between two variables are determining the correlation coefficient and performing a linear regression analysis. The correlation coefficient quantifies the strength of the linear relationship between a pair of variables and the direction of the correlation, whereas regression expresses the relationship in the form of an equation, which is useful in being able to make predictions regarding the data. If a curved line is needed to express the relationship between the variables, correlation and regression analysis can still be undertaken but require more complicated measures outside the scope of this resource. However, spreadsheet programs like Excel can easily perform these analyses for you.
