12.2 Dealing with large changes in magnitude
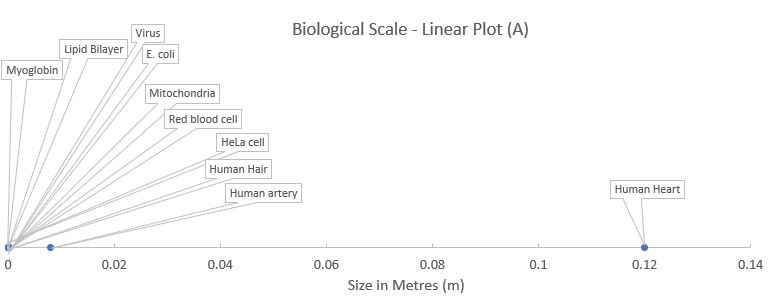
Think about the large range in scale of the components of biological systems from small molecules right through to large multicellular organisms. For example. Escherichia coli is a typical gram-negative, cylindrical bacterium about 1–2 µm long, with radius about 0.5 µm. That is, 1–2 × 10⁻⁶ m long with a radius of 0.5 × 10⁻⁶ m. The average size of a globular protein in the cytosol of a bacterium is approximately 300 amino acids long, which equates to a molecular weight of around 33,000 Da or 33 kDa. A protein of this size is 6 nm in diameter, that is, 6 × 10⁻⁹ m. A typical mammalian cell has a diameter about 10 times the length of an E.coli cell. Making a graphical comparison of components that vary so greatly with respect to biological size is very difficult to do using a linear scale.
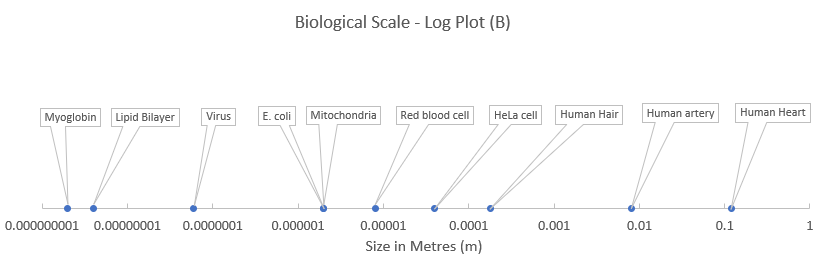
The data in the next figure are the same as those taken from the previous chapter on biological scale. Notice that when representing relative sizes using a linear scale, the resultant graph has most of the components bunched up close to the origin (plot A) making it difficult to interpret. However, if the scale is transformed to a log scale, then it is much easier to see the relative size differences (plot B). You just need to be aware that each increment along the x-axis in this case represents a 10-fold change from the previous.
Exponential measurements
Certain important measurements rely on a logarithmic scale. For example, the pH scale is logarithmic, which means that the difference in 1 pH unit is a difference of 10 times the concentration of hydrogen ions in solution. Similarly, in spectrophotometry, the amount of light absorbed by a solution is the logarithm of the light transmitted through a solution (see the section on determining an unknown concentration using spectrophotometry in Chapter 7). Understanding this is important as it means that as an absorbance reading increases there is exponentially less light being transmitted though the sample and therefore much more chance of an error in the spectrophotometer’s reading.
Rates of growth and decay
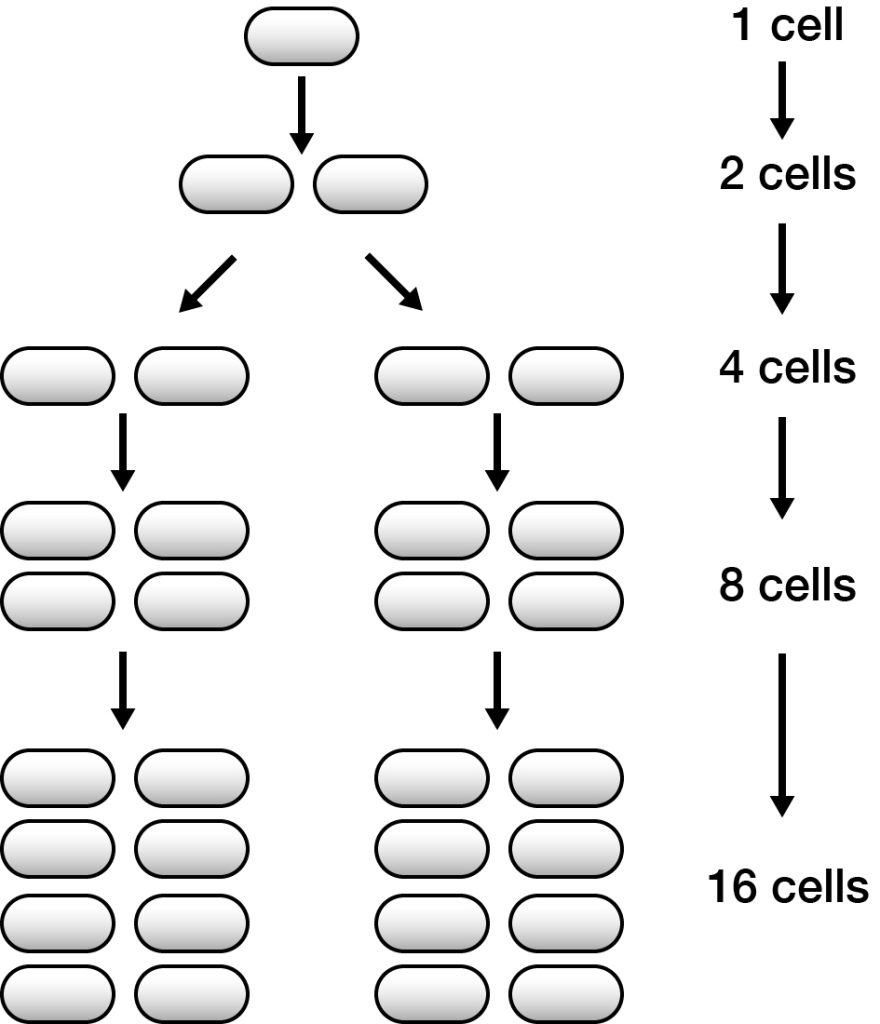
For most biological systems the amount of growth in a population is directly proportional to the size of the population. To understand this, it is useful to think about how a population of bacteria grows. Bacterial cells divide by binary fission so if growth is 100% efficient (each new cell divides into two daughter cells each with the same potential to divide) then the population will double each generation, as shown in the next figure. This kind of growth is known as exponential and can be described by an exponential function where the variable of time is an exponent (i.e. the power to which the base amount is raised).
The opposite of exponential growth is exponential decay, which occurs when variables decrease proportionally as a function of their current value. Examples of this are radioactive decay, chemical reactions where the rate depends on the concentration of the reactants, and clearance of drugs from the body.
