47 Other distributions
 A uniform distribution is what we get when each of the possible outcomes is equally likely.
For example, if rolling a die, we expect each of the numbers to occur at a similar frequency, and the probability distribution would be.
| Roll | 1 | 2 | 3 | 4 | 5 | 6 |
| Pr(Roll) | 1/6 | 1/6 | 1/6 | 1/6 | 1/6 | 1/6 |
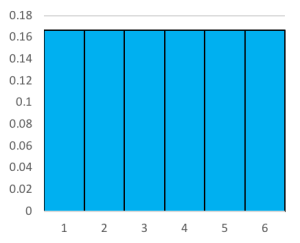
Each of the bars in the histogram are equal and if we did a number of trials we would expect these to be almost equal as well. This is because there is no greater likelihood of obtaining numbers closer to the middle. However, the mean of this distribution will be the value in the centre:
[latex](1 \times \frac{1}{6})+(2 \times \frac{1}{6})+(3 \times \frac{1}{6})+(4 \times \frac{1}{6})+(5 \times \frac{1}{6})+(6 \times \frac{1}{6})=\frac{21}{6}=3.5[/latex]
This mean doesn’t tell us the roll we expect to get when we toss a single die (how can you roll a 3.5?), however if we rolled a die any number of times, we would expect the average of all the rolls to be 3.5. So, if you roll 10 dice, you should get a combined score that is close to 35. Once we’re repeating the experiment (and if we were to record results), we actually would end up with a distribution that starts looking like the normal distribution again!
This is a result of the Central limit theorem, an important result in statistics but one that we will not focus on too much for the moment.
Skewed distributions
In our previous studies of statistics we talked about distributions as describing the ‘shape’ of the histogram, where we could have symmetric, or positively/negatively skewed. Positive skew means the tail is longer for higher values and there could be a few very high values, whereas negative skew occurs if there are a few low lying values and “long tail” for lower values.
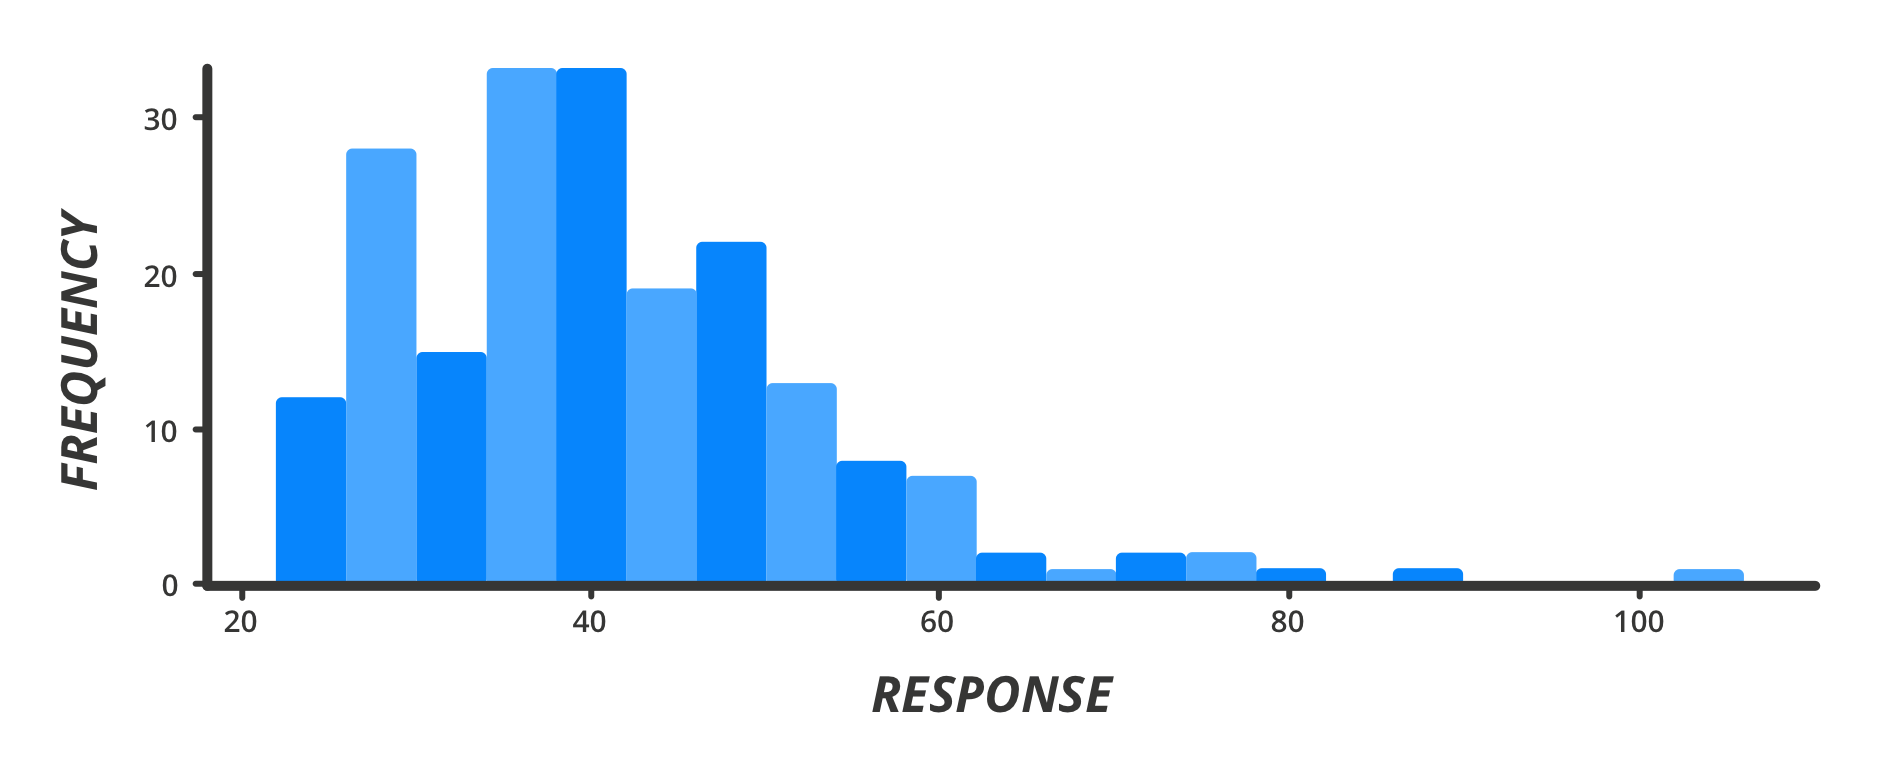
This is an example graph that is positively skewed. Note that if we were to calculate the mean, these few high and outlying values would push the mean up. In the data below, the mean is 41.34 while the median is 39.69.
In reality, many approximately normal distributions may exhibit a degree of positive or negative skew, particularly in cases where it is easy to have very high values but impossible to have symmetrically low values.
For example, weights for male adults would exhibit a positive skew, because even if the mean is, say 75kg, there are a number of individuals that would be over 120kg (45kg above the mean), however it’s much less likely to have adults that are under 30kg (45kg below the mean). Similarly, if we are timing 100m sprints, while we may have a group of people with a mean of say, 20 seconds, it would be easy for people to take 40 seconds or longer if they felt like it, but impossible for anyone to complete the race in 1 second.
Exponential distribution
There are actually a number of other mathematical models, like the normal distribution, that are given in terms of parameters and model real life phenomena. We will look at just one here: the exponential distribution. An exponential distribution is used to describe a number of processes, in particular the time between independent events (e.g. the rate at which people join a queue) however they may also approximate populations that have a majority of very small values and a few outlying high values, for example, the wealth of populations and the number of followers on twitter or Instagram will exhibit behavior similar to exponential distributions (or sometimes the less extreme ‘power-law’ distribution).
For example, the following graph is what a sample of 1000 twitter accounts might look like in terms of the number of followers.
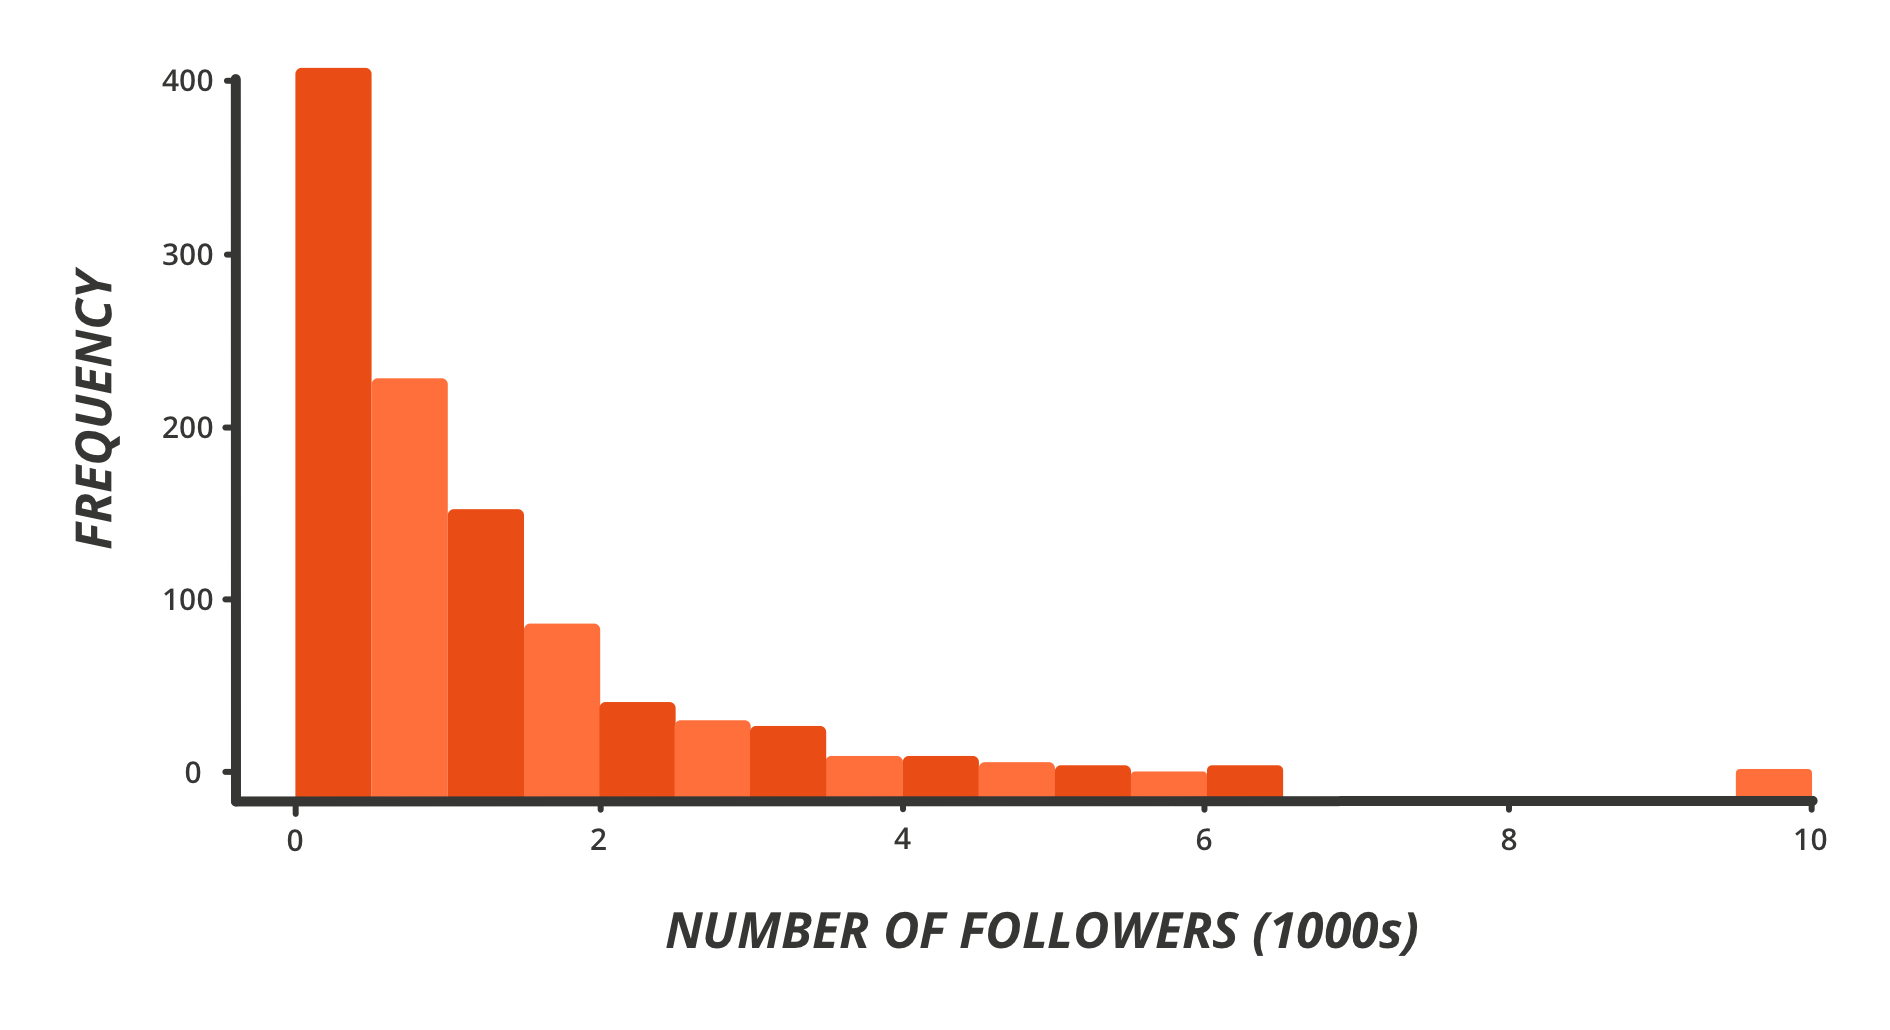
Of course, there would also be some twitter accounts with followers in the millions. Similarly with wealth, we have a majority of people earning under $90000 per annum, then some earning between $90000 and $150000, and fewer earning between 150k and 300k, then some individuals in the many hundreds of 1000s and some in the millions.
Build your intuition
 |
Would the following measurements most likely have a normal or a skewed distribution? Why or why not?
|
