17 Interpreting graphs from points

The Cartesian Plane is a really useful way of visualising the relationship between two variables.
In an earlier chapter of this book (working with fractions), we looked at a basic problem which asks us to determine how long it would take to travel a specified distance at a steady speed (the question was something like ‘how long would it take to travel 15 km if your speed was a steady 100 km/h’).
One way to think about this question is as a relationship between two variables: distance and time.
One way to visualise (or graph) this relationship would be to use a Cartesian plane.
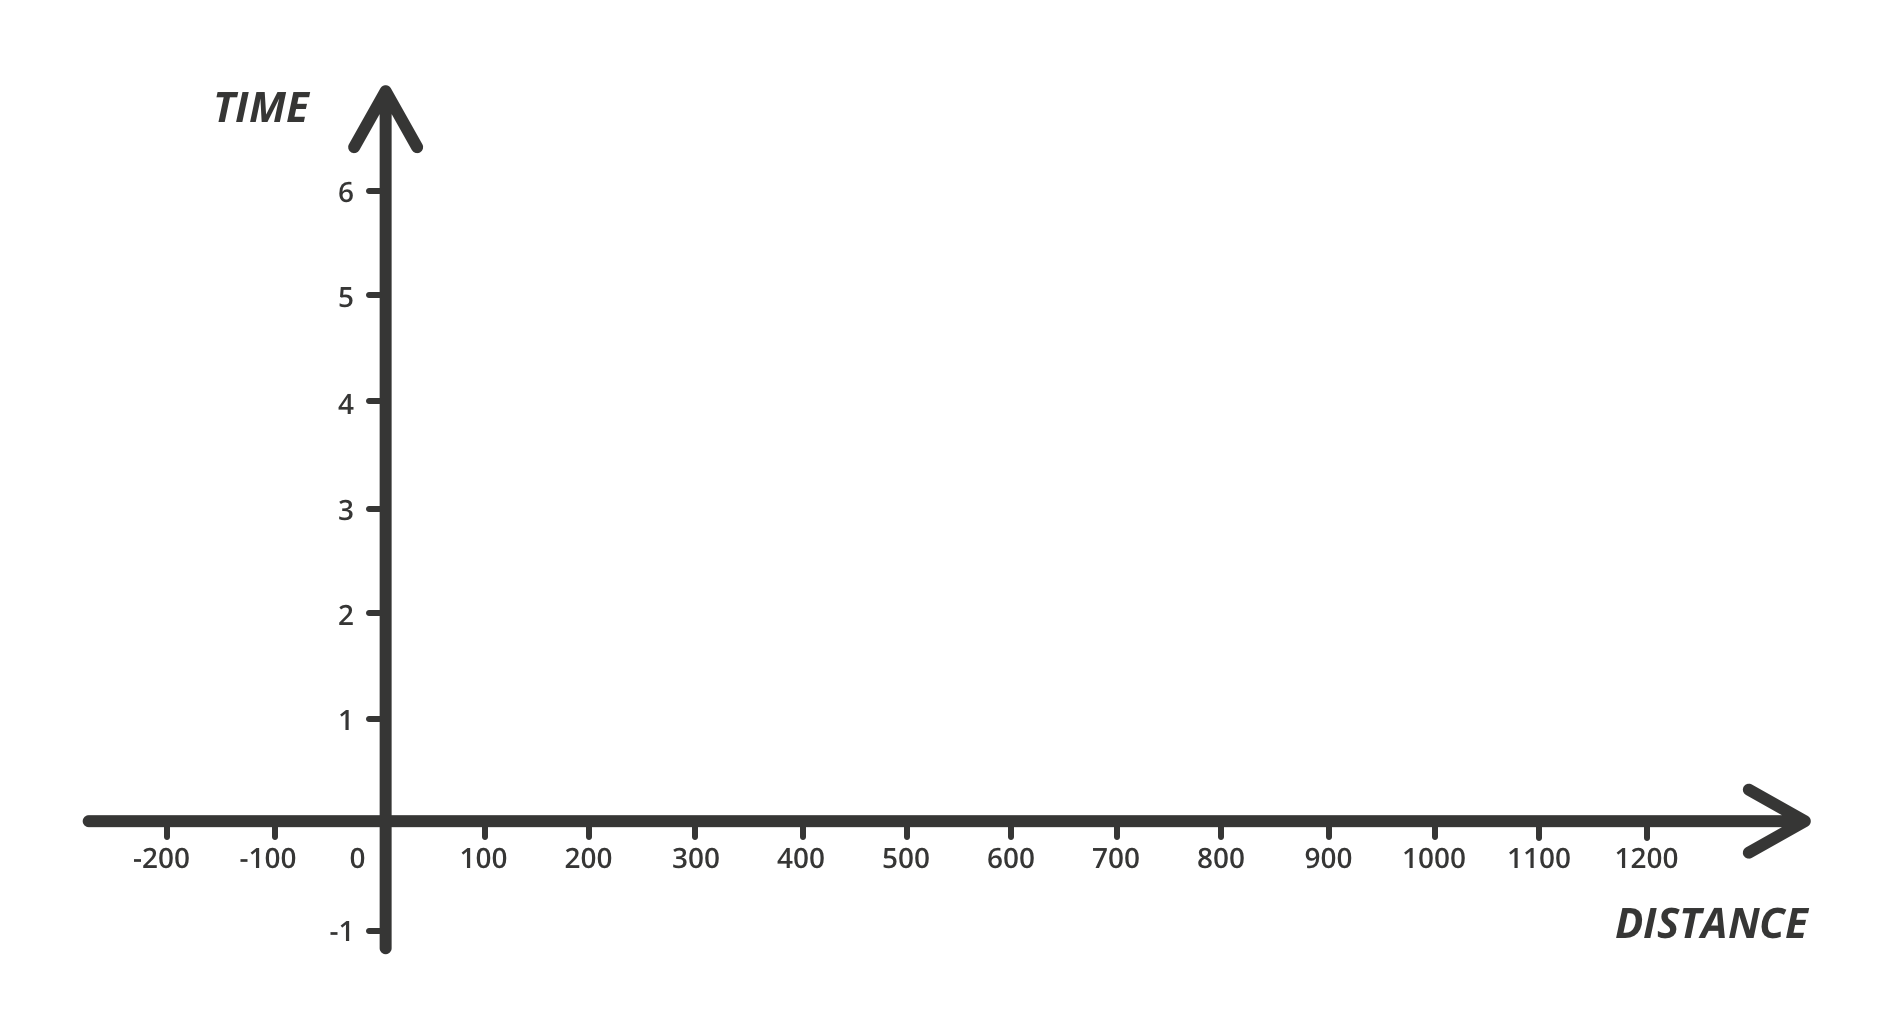
The intersecting lines are conventionally called axes (singular: axis). Each axis represents one of the variables. Time is represented by the vertical axis and the horizontal axis represents distance travelled.
Conventionally, the horizontal axis is called the [latex]x[/latex] axis and represents the dependent variable and the vertical axis is called the [latex]y[/latex] axis and represents the independent variable.
If you have trouble identifying the dependent and independent variable, don’t worry about it too much at this stage.
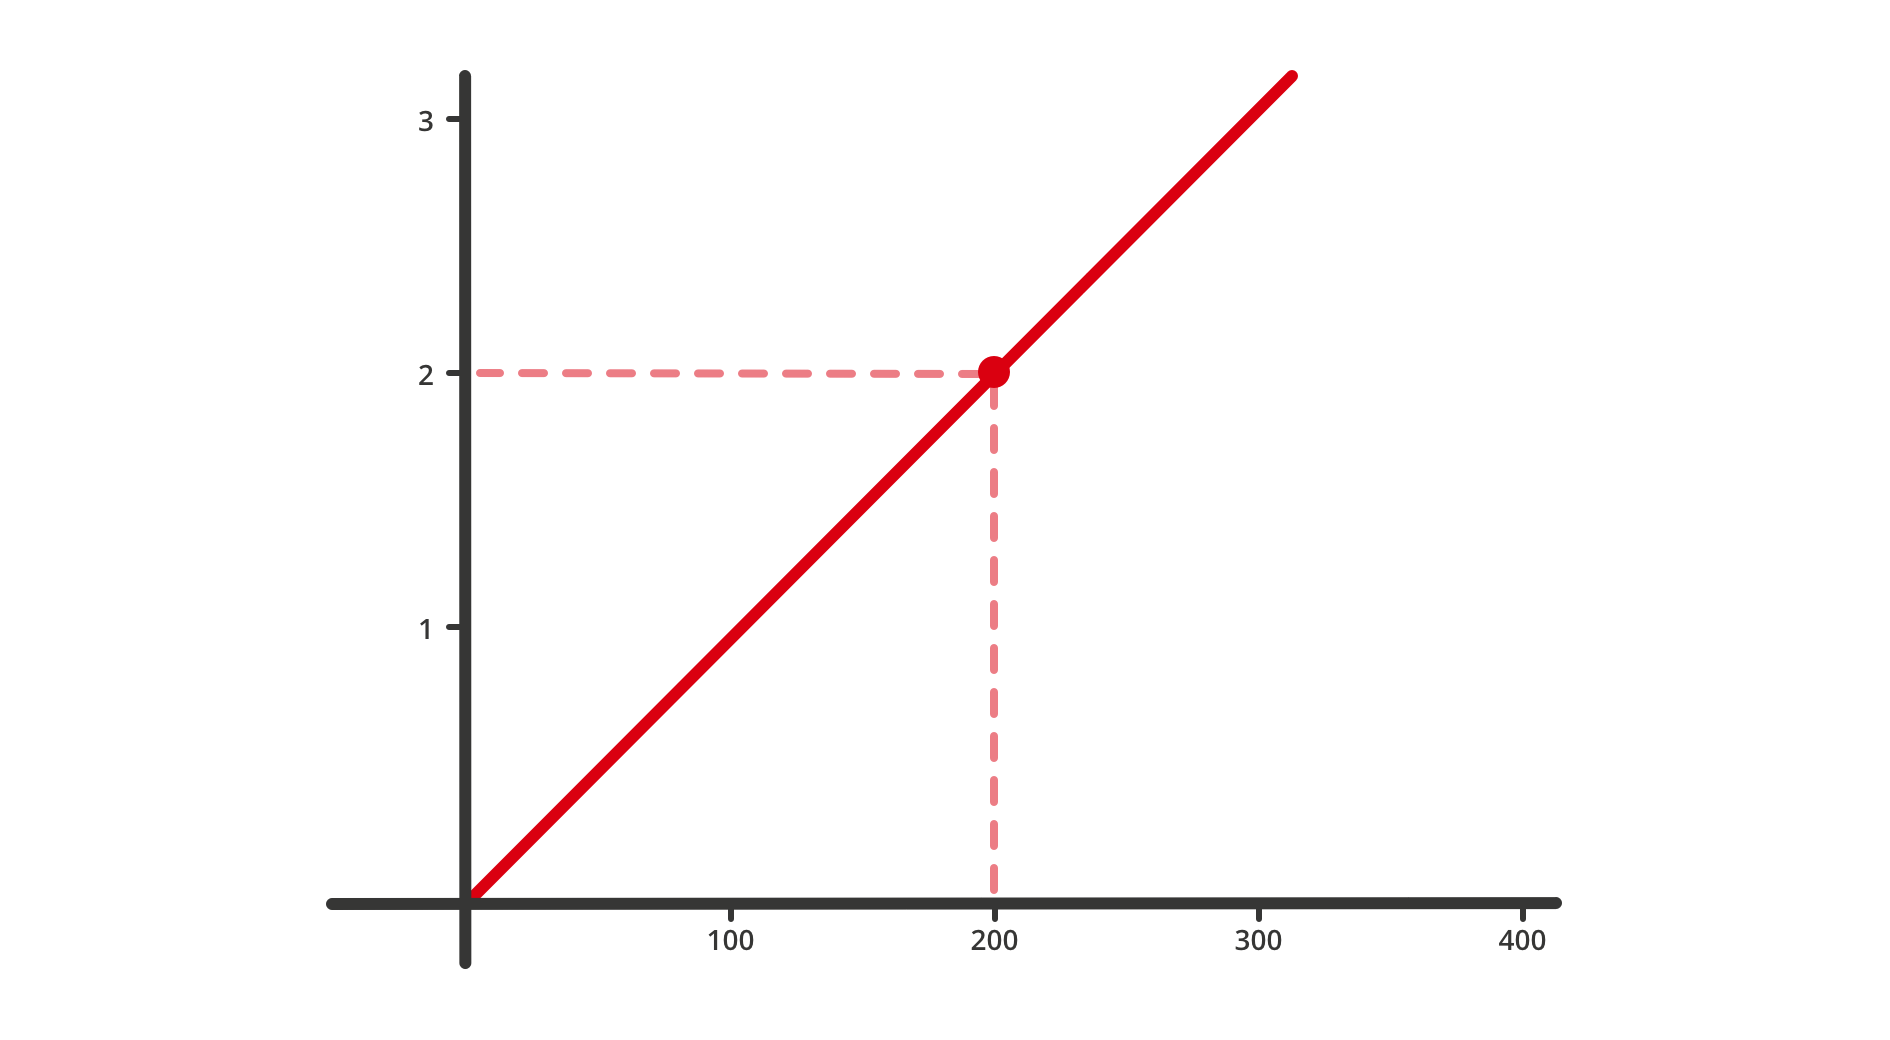
As you can see below, this would be a useful tool for solving problems which asked us about distance and time at a fixed speed. The dot here shows us that it would take 2 hours (y axis) to travel 200 km (x axis).
And, in fact, it could even be used to solve problems about distance and time when the speed also varies. The graph below shows a car coming up to its cruising speed.
Why graphs matter
These kinds of representations are useful for being able to interpret relationships in the data or differences between points that might not be so intuitively apparent in the numeric relationships. Such plots are hence incredibly useful for communicating a great deal of information, however sometimes our intuitive interpretation can be thrown off if we are not used to dealing with the quantities represented on either axis.
Let’s start with a few small problems.
How did you go? This video recaps some considerations for these problems.
Acknowledgement
Many of the problems shown throughout this chapter have been adapted from The Language of Functions and Graphs (1985) by Shell Center for Mathematical Education (this version modified by Deakin University and licensed under CC BY NC 4.0 with permission from Shell Centre for Mathematical Education)
A variable is a quantity that may change and is often represented by a symbol like [latex]x[/latex].
