23 Arithmetic progressions

Arithmetic progressions are sequences that increase or decrease by the same amount in each step.
The simplest of which is the sequence that starts at 1 and increases by 1s, 1,2,3,4,5,…. However we can start from anywhere, e.g. from 100, and we can count by any number.
Definition: An arithmetic progression is a sequence of numbers where each new term is determined by adding the same constant to the preceding term in the sequence.
For example, the sequence 2, 5, 8, 11, 14, … is an arithmetic progression starting from 2 with a common difference of 3.
We can express the sequence of terms in arithmetic algebraically in terms of the starting number (a) and the common difference (d).
[latex]a, a+d, a+2d, a+3d,..., a+(n-1)d[/latex]
Hence, the initial term of an arithmetic progression is a and the common difference of successive terms is d, then the n-th term [latex](t_n)[/latex] of the sequence is given by [latex]t_n=a+(n-1)d[/latex].
Why is it [latex](n-1)[/latex]?
- If [latex]n=1[/latex] then [latex](n-1)=0[/latex], and [latex]t_n=a+(n-1)d=a+0=a[/latex]
- The second term will have [latex]n=2[/latex] and hence be [latex]a+(2-1)d=a+d[/latex]
We could write our sequence out as [latex]t_n=a+nd[/latex], but we would just have to remember that now n = 1 means the next term after the first, and there would be an offset. So what we refer to naturally as the 10th term in the sequence would actually correspond with n = 9.
Progression example
Let’s look at the example of 2, 5, 8, 11, 14, …. The sequence starts at 2, and so [latex]a=2[/latex]. We can also see the constant difference of 3 between each two terms, so we have [latex]d=3[/latex].
| Term | When… | Then we have… |
| 1st term | [latex]n=1[/latex] | [latex]2+(1-1)3=2+0=2[/latex] |
| 2nd term | [latex]n=2[/latex] | [latex]2 + (2-1)3 = 2+3 = 5[/latex] |
| 3rd term | [latex]n=3[/latex] | [latex]2 + (3-1)3 = 2 + 6 = 8[/latex] |
| 4th term | [latex]n=4[/latex] | [latex] 2 + (4-1)3 = 2 + 9 = 11[/latex] |
And so on. Don’t forget that you always do the multiplication before adding (and always do the subtraction inside the brackets before multiplying).
Quick check
 |
You buy a shrub that is 20cm high. Each year it grows 15cm. Draw a plot of the shrub’s height corresponding with the number of years since it was purchased.
Have a go at drawing the plot, then take a look at the video which gives a quick overview of what we’ve studied so far. |
Scratch to the rescue
Scratch and mathematical programming software can really help us to understand relationships such as those that arise when we study sequences. Firstly, we can use Scratch as a kind of elaborate calculator. For example, we can code the n-th term of an arithmetic sequence as something like the following (pay close attention to how the correct order of operations is ensured with the combination of embedded green operation blocks). However we could also do away with the n-th term formula and still quite easily calculate it using a loop (see code on the right).
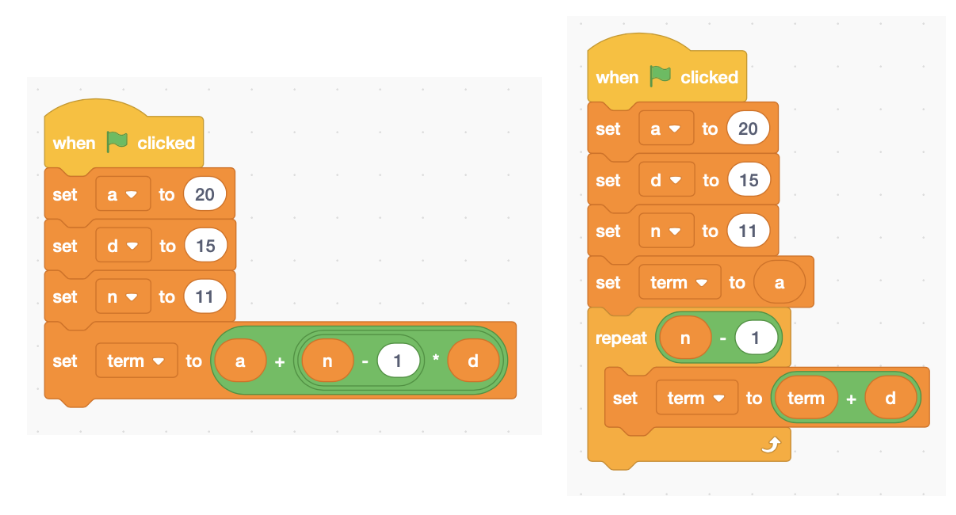
Image: screenshot from Scratch
The following activity presents a program that also plots the sequence of values generated by an arithmetic progression. You can access the project page if you want to see the code.
Scratch
The following scratch program lets us plot an arithmetic progression (and work out each term in the process) based on the value of a, d and n. Explore what happens with different values of a, d and n. Note that a and d can be negative and/or decimal numbers, but n refers to how many terms – so should only be a positive whole number.
Excel
Excel is pretty handy for doing some calculations and charts too. You can create a formula by starting with an “=” sign, then use the asterisk “*” for multiplication, “+” for addition, “-” for subtraction, and “/” for division. You can reference a cell by its column and row labels, e.g. “A5”. The chart linked below calculates the “t_n” term from the values of a (cell B3), d (cell C3), and n (B6, B7 etc).
You can double-click on the values below “a” and “d” to edit them and see how the values change. You can also double-click on the cells below “t_n” to see the formula used.
One of the useful things in Excel is the ability to click on a cell and drag down a square that appears in the bottom corner to “fill-down”, which will copies the pattern of the calculation with respect to the variables. In order to stop the a value from being drawn from the next cell down, you can use dollar signs, like “$B$3”, which means all the cells filled when you drag down will keep using that value.
