52 Venn diagrams
Venn diagrams help us understand the relationship between sets.
Venn diagrams are a nice and intuitive way of representing relationships between different sets. In probability, each circle will usually represent an event or set of outcomes.
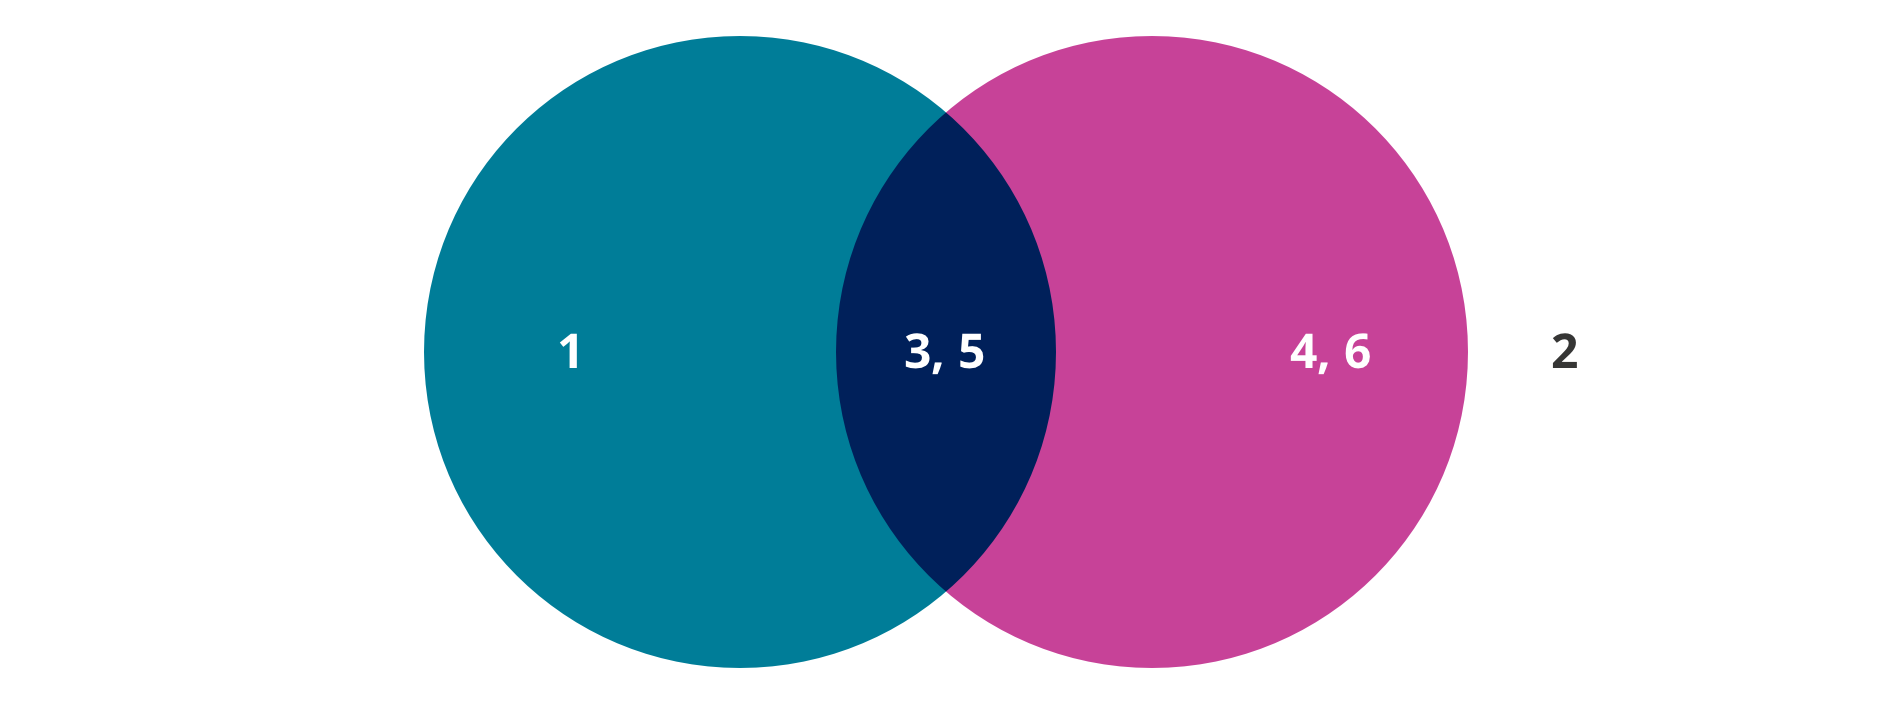
Taking the example from the video, the set of odd outcomes if you roll a die is {1,3,5} (the curly brackets tells you it’s a set). The set of outcomes greater than 2 is {3,4,5,6}. Using a Venn diagram, we could easily show the overlap between these two sets.

The overlap between the circles represents an outcome where both events occur, in this case, the overlapping region occurs when we roll a die and the number is both odd and greater then 2.
However sometimes the nature of the events and how they are represented using Venn diagrams can lead to misunderstandings.
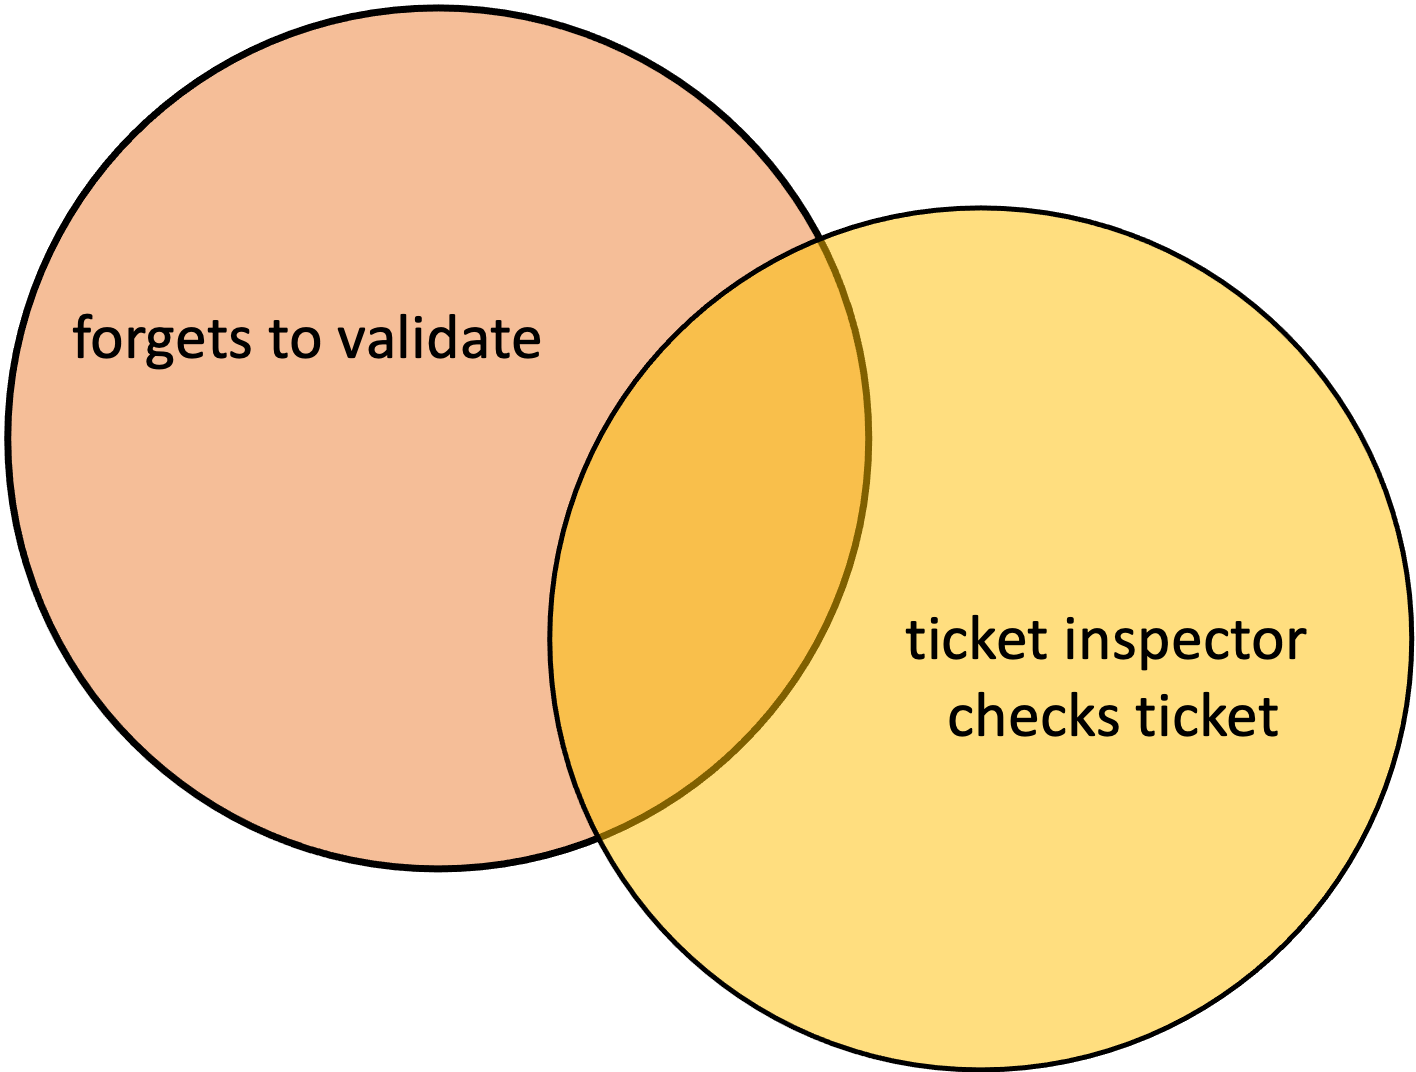
Both circles in the above example relate to the same roll of a die. We might also use Venn diagrams to represent events that seem less related to one another. For example, the following might be used to represent the forgetful train passenger problem.

In this case, each circle represents the occurrence of an event. If both events occur (the overlapping region), then the forgetful man could be fined for not having a ticket. On the other hand, we should remember that the region outside both circles represents the man remembering to validate his ticket, and the ticket inspector not boarding the train.
Independent events
Recall that for independent events, the probability of one occurring doesn’t have any impact on the likelihood of the other, and the probability of both occurring can be found by multiplying the probabilities of each. Venn diagrams can help us conceptualise these kinds of situations and we can use this rule to show or check whether the two events are independent.
In the dice example, the probability of the intersection, “both odd and greater than 2” is equal to ½ multiplied by 2/3, and so these two events can be considered independent, however the probability of “both odd and greater than 3” is not independent, because this would suggest that the chance of rolling a 5 is ½ (odd) multiplied by ½ (greater than 3) which is equal to ¼.
A common misconception arises when it comes to understanding how the concept of independence relates disjoint (or mutually exclusive) events or subsets.
In the case of disjoint subsets, if one occurs, then it is impossible for the other to also occur. If you roll an odd number, you won’t be able to also roll a 4 (we are considering the same roll of the die). Disjoint events are hence never independent.
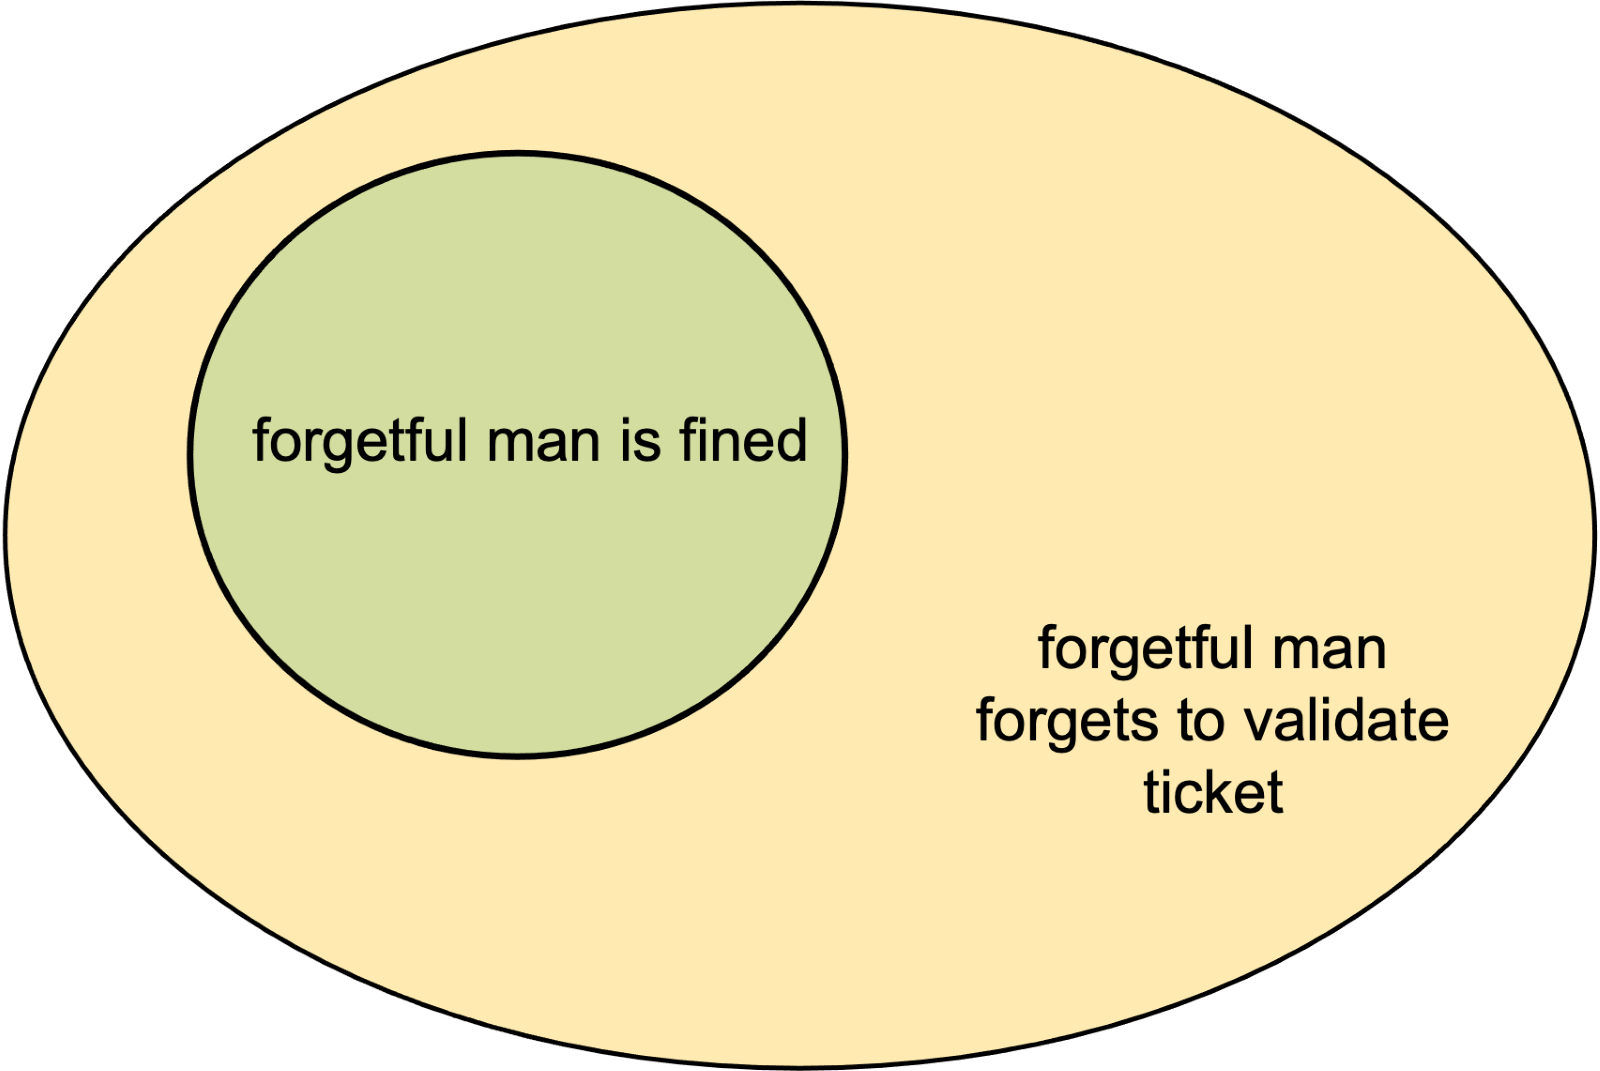
Similarly, two events where one is a subset of the other won’t be independent either. The forgetful man forgetting to validate his ticket and the ticket inspectors boarding his train are two independent events, but the man being fined by the inspectors will be a subset of him forgetting to validate.

The probability that he will be fined is not independent of him forgetting to validate his ticket. If he forgets to validate, it has a direct effect on whether or not he will be fined (it increases the probability from 0 to 1/6). On the other hand, if he is fined, it means that the probability that he forgets to validate automatically goes to 1, since he can’t be fined if this doesn’t occur.
Are free throws really independent?
 |
Are free throws really independent? Suppose we collect data from 100 instances where a player took two free throws with the following results.
Draw a Venn Diagram with one circle for the first free throw and one circle for the second free throw. Are your circles disjoint? Or is either a subset of the other? What is the probability of hitting the first free throw? What is the probability of hitting the second free throw? What is the probability of hitting both free throws? Is it the same as multiplying the two probabilities together? |


