10 Implementing: Risk Assessment
Having learned the importance of hazard identification, and some tactics to compile a thorough list of potential sources of harm in the workplace, it is now time to understand how to assess WHS risk.
Learning Objectives
This chapter explains:
- The objective of WHS risk assessment.
- The difference between likelihood and probability.
- Risk assessment techniques.
- The important role of workers in risk assessment and Safety I versus Safety II approaches.
Risk assessment identifies, for each hazard, the “likelihood and consequence of injury or harm occurring” (Standards Australia & Standards New Zealand, 2001, p. 5). What do risk assessment tools do? They aim to facilitate the ranking of the likelihood, and consequences, of an interaction between the hazard and workers, plant and/or the environment.
Consequence
In risk analysis, it is useful to begin by connecting hazards with their potential harm. Wide-reaching tools, such as brainstorming and using scenarios (see Box 10.1), are useful to understanding the hazard’s potential behaviour in different work contexts and conditions.
Box 10.1: Risk assessment strategies
A transcript of this video is available here.
Source: Sheridan, L. (producer, narrator) & Treadwell, L. (producer). (2019). Excerpt from Video 6: An introduction to work health and safety management. Preston, A., (audio engineer); Orvad, A., (artist) and Franks, R., (animator), Learning, Teaching and Curriculum, University of Wollongong, Australia. YouTube
Beginning broadly, and working down to task-specific risk assessments, is only achievable through extensive worker consultation. What the workplace looks like, and how the hazard behaves, can be different. In Risk Assessment Example 1, seeking to understand the consequence of sunlight exposure leads to consideration of sun sensitive workers, sunstrike and, following a conversation with a worker, discovers a range of unexpected potential hazards that may have been left undiscovered should worker consultation have not have occurred.
Risk Assessment Example 1: Exposure to sunlight (and the Glastonbury Festival!)
Due to public health efforts, awareness of common harms (consequences) of exposure to sunlight, such as UV exposure being linked with skin cancer, are relatively well known. However, some people are more sensitive to sunlight than the general population and “a medical assessment may be required to assess whether an offer of employment is in the mutual interest” (The University of Queensland, 2022, Section 3.0). If already employed, reasonable adjustments to roles may be required if prolonged sun exposure is currently a requirement of the job.
Through brainstorming and the use of scenarios, workers may identify less commonly known risks specific to their work team that make a usually controlled hazard, hazardous for them—such as sunstrike (see Figure 10.1). Waka Kotahi (the New Zealand Transport Agency) identifies sunrise and sunset as “a very dangerous condition to drive in” as the sun is low in the sky and usual hazard controls, such as a vehicles sun visors, are ineffective (Waka Kotahi, n.d., para. 1). Between 2013 and 2017, sunstrike-related crashes led to 21 deaths and 780 injuries (Tischler, 2018).

Figure 10.1: Sunstrike reduces driver visibility
Source: “Morning glare through a dirty windshield!” by Bethesda Magazine, flickr.com, CC BY 2.0
British bakery delivery driver Steve Thomas begins his shift at 1.15am and concludes his shift at 11.30am (Empson, 2021); this potentially exposes him to sunstrike every single day. Sunstrike will also be seasonally impacted, it will be worse in winter when the sun is lower in the sky expanding the sunstrike window for a longer period each day (Tischler, 2018). However, further discussion (worker consultation) with Steve reveals other task-specific risks and uncovers a particularly an unexpected one: the Glastonbury Festival! What could a music festival have to do with risk to a bakery delivery driver?

Figure 10.2: Glastonbury Festival attendees enjoying a performance.
Source: “Glastonbury Festival (2010)” by Neal Whitehouse Piper, flickr.com, CC BY-SA 2.0
Paul Empson, General Manager of Bakers Basco, rode along with Steve Thomas for the day and discovered:
For Steve, the early mornings are becoming more challenging as he gets older. Road rage among car drivers has increased over the years and he notes that, with people more and more in a hurry these days, there is a lack of tolerance generally on the roads towards fellow drivers. Added to that, the carnage caused on the roads of Steve’s route around Glastonbury each year has a knock-on effect with delivery times and additional hours due to heavy traffic. (Empson, 2021, para. 18)
Spending time with Steve has revealed 1) potential age-related fatigue (see Medical University of South Carolina, 2023), 2) a psychosocial hazard, road rage, and 3) that the Glastonbury Festival creates traffic congestion which likely would amplify Steve’s fatigue, his exposure to road rage and contact with drivers heading for the festival who may be less familiar with the roads.
It is only by taking a broad approach that unique, job specific, risks of harm can come to be understood. Sometimes at this stage, like in this example, additional hazards will be identified, and these will need to be added to the hazard register.
Likelihood
Once all possible potential links between a hazard and a consequence are identified, it is time to focus in on assessing the likelihood of the consequence occurring. Broadly speaking there are three types of risk assessment: large scale assessment “for large scale complex hazard sites”, required specific assessments “that are required under specific legislation or regulations” or general assessments as part of due diligence to comply with WHS legislation and WHS regulator expectations (Safety Culture, 2023, para. 8). Large scale assessment will probably require risk assessment specialists. The accuracy and effectiveness of required specific assessments and general assessments will benefit from authentic worker engagement during the consultation process and this could even extend to include worker consultation on the choice of risk assessment tools to be adopted for the task.
No matter the specific tool, this aspect of risk assessment is focuses on the ‘likelihood’ that the consequence of the hazard interacting with the workers, plant or environment will be harm. The likelihood of the harm occurring is ranked from low to high (see Table 10.1). The magnitude of the potential harm is then usually described and classified according to its severity from low to high (see Table 10.2).
Table 10.1: Likelihood hazard-related incident scale (1–5)
| Likelihood | 1 | 2 | 3 | 4 | 5 |
| Likelihood of an incident relating to this hazard | Highly unlikely | Unlikely | Possible | Likely | Very likely |
Source: Lynnaire Sheridan
Table 10.2: Injury severity scale (1–5)
| Harm | 1 | 2 | 3 | 4 | 5 |
| Severity of likely harm | Minor | Moderate | Serious | Severe | Critical |
Source: Lynnaire Sheridan, adopting Susan Baker’s Injury Severity Scale retrieved from MD+Calc (2023)
At this point, some organisations will combine the consequences and likelihood scales together into a table. Some of the tables propose that consequence severity and likelihood be added together (summed) whereas others suggest that they are multiplied (as per Table 10.3).
Table 10.3: Hazard prioritisation (likelihood x severity)
| Hazard | Likelihood | Severity | Risk Score |
| Hazard Example 1
High likelihood-high consequence |
5 | 5 | 25 |
| Hazard Example 2
Medium likelihood-medium consequence |
3 | 3 | 9 |
| Hazard Example 3
Low likelihood-high consequence |
1 | 5 | 5 |
Source: Lynnaire Sheridan
Other organisations will prefer to generate a risk matrix (see Figure 10.3). In a risk matrix, the low probability–low severity are often represented in green to infer these risks do not merit hazard control. High probability–high severity risks are often red to infer they are unacceptable risk and that hazard control efforts must be taken. Finally, there will be risks, often represented by yellow or orange, that are medium risks. Medium risks are assumed to be ones that can be managed using an As Low As Reasonably Practicable (ALARP) or So Far As Is Reasonably Practicable (SFAIRP) approach (Wolters Kluwer, n.d.).
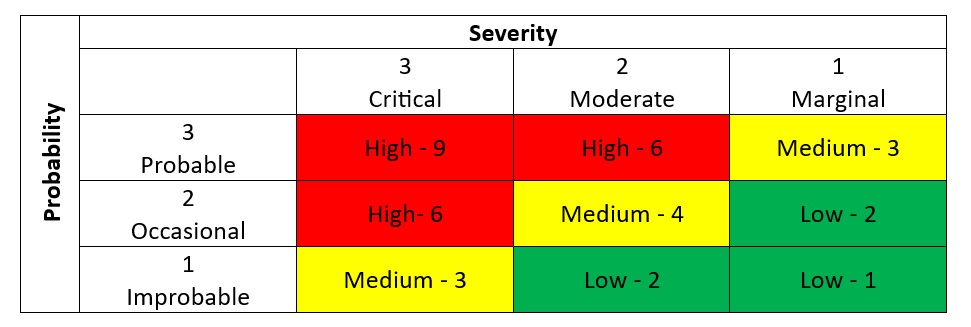
Figure 10.3: 3 x 3 risk matrix
Source: Lynnaire Sheridan, modified from Vector Solutions (2019)
The key challenge for Table 10.3 and Figure 10.3 is that they are fundamentally built on the flawed assumption that likelihood is objective and that matrices objectively calculate priorities for actioning. These two assumptions can result in risk management errors that have led to large-scale critical incidents.
Assumption error 1: Likelihood is objective, like probability
It is vital to understand that collective negotiation of the likelihood that a particular hazard will cause an identified corresponding harm is a subjective, not an objective, decision. While data may inform some aspects of the likelihood of occurrence, often it requires speculation of the timeframe and/or likely severity of the consequence; it is not based on mathematical or statistical probability.
Many different factors can impact on individual risk perception including a person’s pre-disposition towards optimism or pessimism (optimists reduce the likelihood of the risk and pessimists the inverse), how numerate they are (more numerate people use data better and tend to be less risk biased), personal experience (lived experience of harm increases perceived likelihood of the risk), control over the risk (uncontrolled risks are perceived as more dangerous) and mood (angry people experience reduced risk perception and fearful individuals have amplified risk perceptions) (Ferrer & Klien, 2015). Likelihood is not a fixed value but it is instead based on the perceived likelihood as generated collaboratively by the stakeholders involved, based on what they know and what they perceive at that time.
In summary, likelihood is “the chance that something will happen” (Cambridge Dictionary, n.d., para. 1) and is not the same as mathematical probability (see Porter, n.d.). This distinction is important in safety management as the term likelihood should be used instead of probability because the actual probability of when a hazard will generate a particular harm is currently incalculable. However, risk tables and matrices complexify the misconception of likelihood as probability because often qualitative perceived likelihood is presented on rating scales using numbers (see Tables 10.1 and 10.2). It is then tempting to generate an overall ‘sum’, or simple multiplication (see Table 10.3) of likelihood and consequence but, as explained above, likelihood is based on risk perception rather than risk probability. There are no ‘real’ numbers assigned to risk matrices and therefore it is not possible to do calculations using it (Wolters Kluwer, n.d.).
Assumption error 2: Matrices (or tables) reflect the ‘actual’ priority
Risk tables or matrices are perceived as effectively ranking the risks of hazards from high to low, in many cases this is simply not true. Consider Table 10.3 Hazard prioritisation (likelihood x severity), it is based on the mathematical logic of one organisation’s online risk assessment tool (it will remain anonymous as it is erroneous). Hazard Example 1, the high likelihood-high consequence hazard, achieved a risk assessment score of 25. Hazard Example 2, the medium likelihood-medium consequence hazard, achieved a risk assessment score of 9. Hazard Example 3, the low likelihood-high consequence hazard, achieved a risk assessment score of 5. Figure 10.3, the risk matrix, ranks hazards similarly.
The flaw is that both Table 10.3 and Figure 10.3 place the lowest priority for action on low probability–high consequence events. Poorly designed tables and matrices inadvertently lead to low probability–high risk critical incidents being completely overlooked (Wolters Kluwer, n.d.). This was one of James Reason’s insightful discoveries when investigating large-scale WHS incidents and why they were still occurring despite the existence of functional safety management systems (Reason, 1997), Hudson also mentions this in his video (see Chapter 6). Dekker proposes improper use of risk tools has focused organisations on resolving less complex hazards. Ironically when a organisation succeeds “in lowering a non-serious injury incident rate [it] definitely puts an organization at greater risk of accidents and fatalities” (Dekker, 2018, p. 8). Due to their flaws, efforts are being made to create and implement alternatives to risk matrices in the field of risk assessment (see Box 10.2).
Box 10.2: Developments in risk assessment
Adequately capturing low probably–high risk hazards for meaningful consideration during risk assessment is a challenge, one which is beyond the capabilities of risk matrices. Ortwin Renn presents an alternate model for risk assessment (German Advisory Council on Global change, 1998). His approach seeks to move beyond likelihood and probability, to adequately consider what acceptable risk actually is (reasonably practicable) from a societal perspective (Government Office for Science, 2011).
Through the German Advisory Council on Global Change, Renn proposes six risk classes (assigned names from Greek mythology) derived from nine overarching concerns derived from experts and the general public: “extent of damage, probability of occurrence, incertitude, ubiquity, persistency, reversibility, delay effect, violation of equity and potential of mobilization” (Government Office for Science, 2011, p. 42). Risk class descriptors encapsulate the characteristics of the risk challenges they represent:
-
Damocles. Risk sources that have a very high potential for damage but a very low probability of occurrence. e.g. technological risks such as nuclear energy and largescale chemical facilities
-
Cyclops. Events where the probability of occurrence is largely uncertain, but the maximum damage can be estimated. e.g. natural events, such as floods and earthquakes.
-
Pythia. Highly uncertain risks, where the probability of occurrence, the extent of damage and the way in which the damage manifests itself is unknown due to high complexity. e.g. human interventions in ecosystems and the greenhouse effect
-
Pandora. Characterised by both uncertainty in probability of occurrence and the extent of damage, and high persistency…e.g. organic pollutants and endocrine disruptors.
-
Cassandra. Paradoxical in that probability of occurrence and extent of damage are known, but there is no imminent societal concern because damage will only occur in the future. There is a high degree of delay between the initial event and the impact of the damage. e.g. anthropogenic climate change.
-
Medusa. Low probability and low damage events, which due to specific characteristics nonetheless cause considerable concern for people. Often a large number of people are affected by these risks, but harmful results cannot be proven scientifically. e.g. mobile phone usage and electromagnetic fields. (Government Office for Science, 2011, p. 42)
Firstly, these descriptors appear conceptually translatable to smaller-scale organisational scenarios despite being designed to address global environmental risk. Secondly, low probably–high risk situations become clearly visible for consideration. Renn explains that the descriptors are particularly useful to reduce the “gap between the layperson’s risk perception and expert risk analysis” (Renn & Klinke, 2004, p. S44).
If adopting this perspective, risk assessment is conceptualised as the probability of occurrence versus the extent of damage (see Figure 10.4). The goal of this model is to recognise which class a risk scenario falls into and, ideally, to move it from the outer intolerable area towards the normal areas so it can be managed on a day-to-day basis (the hazard is ‘controlled’). Their model is based on the premise that risks can shift classes as their threat is downgraded, for example Pythia can downgrade to Cyclops through the implementation of risk management strategies (German Advisory Council on Global change, 1998).
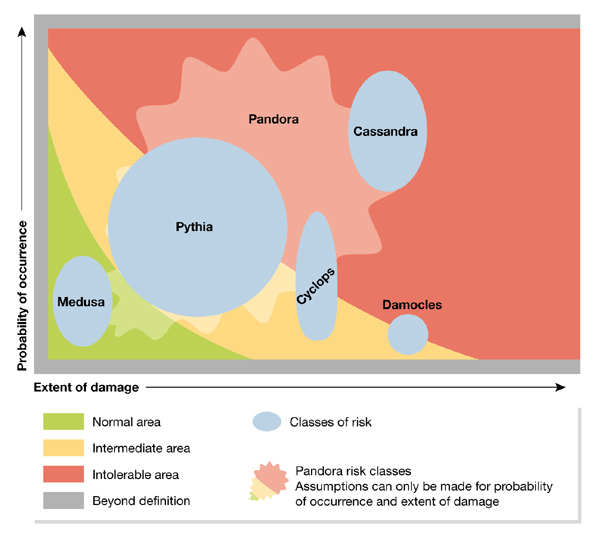
Figure 10.4: A typology of risk
Source: Renn (2004) adapted from original by German Advisory Council on Global Change
Alongside of their model, to actually enhance risk management, Renn and Klinke (2004) suggest management strategies appropriate for each class of risk (see Table 10.4). They propose that Damocles and Cyclops respond best to science-based management. Pythia and Pandora require application of precautionary principles. Cassandra and Medusa risks should be managed via discursive approaches. Notably, discursive approaches are a more transparent approach to risk management compared to matrix tables and their numerical scales that infer objectivity, while actually being based on the perceived likelihood attributed by stakeholders when engaging in risk assessment in any given workplace at any given time.
Table 10.4: Renn and Klinke’s proposed management strategies for each risk class
| Management | Risk class | Extent of damage | Probability of occurrence | Strategies for action |
| Science-based | Damocles
Cyclops |
High
High |
Low
Uncertain |
Reducing disaster potential
Ascertaining probability Increasing resilience Preventing surprises Emergency management |
| Precautionary | Pythia
Pandora |
Uncertain
Uncertain |
Uncertain
Uncertain |
Implementing precautionary principle
Developing substitutes Improving knowledge Reduction and containment Emergency management |
| Discursive | Cassandra
Medusa |
High
Low |
High
Low |
Consciousness building
Confidence building Public participation Risk communication Contingency management |
Source: Lynnaire Sheridan, modified from Renn & Kinke (2004)
While Renn’s approach may not entirely be relevant to WHS, or applicable at the scale of an organisation, its philosophical premise is useful when critiquing risk assessment tools to ensure that they are robust in the prioritisation of risk.
Further reading:
Renn, O., & Klinke, A. (2004). Systemic risks: a new challenge for risk management. EMBO Reports, 5(51), S41 – S46. Retrieved from https://www.embopress.org/doi/epdf/10.1038/sj.embor.7400227
Risk assessment in the field
Due to change blindness, it is important before a worker begins a task that they undertake a quick risk re-assessment. While a formal risk assessment for their workplace hazards should have already taken place, via the processes outlined above, things can and do change in the workplace. Changes relevant to a worker’s safety need to be noticed, and acted upon, to ensure the risk that a hazard poses remains stable day to day (with the exception being when the safety management system identifies an opportunity for improved hazard control).
Hazard identification, and then risk assessment, may be required ‘in the field’ for workers who undertake their work in different environments. While they should be familiar with the hazards that their equipment poses, requiring risk re-assessment, it is important that they pause to consider what hazards exist in their less-familiar surroundings. Two risk assessment tools that are often used in the field are Take 5 and Checklists (see Box 10.3).
Box 10.3: Tools for worker risk assessment ‘in the field’
This video explains two risk assessment tools, Take 5 and Checklists, that are particularly useful for workers who undertake work outside of regular workplaces i.e. ‘in the field’.
A transcript of this video is available here.
Source: Sheridan, L. (producer, narrator) & Treadwell, L. (producer). (2019). Excerpt from Video 6: An introduction to work health and safety management. Preston, A., (audio engineer); Orvad, A., (artist) and Franks, R., (animator), Learning, Teaching and Curriculum, University of Wollongong, Australia. YouTube
It must be acknowledged that, in this context, risk assessment is heavily dependent on the worker authentically engaging. Dekker (2018), in Safety Anarchy, warns that these types of procedures become bureaucratic; in a worst-case scenario they might even be designed at head office and pushed out to work sites leading to worker skepticism (see Box 6.3). Risk assessment by workers of their work is heavily reliant on this procedure being embedded within a functional safety culture. Box 10.4 presents one company’s clever solution when seeking to raise up their safety culture and communicate their new expectations to their employees. Effectively, it expects workers to engage in informal risk assessment and, importantly, to take action to reduce the risk posed by the hazard.
Box 10.4: ‘Don’t walk on by’ worker risk assessment training
This is a safety culture training video designed to encourage staff to risk assess their environment and take action, where possible, to reduce potential worker interactions with hazards through ‘good housekeeping‘.
Source: “Don’t Walk on By” Safety Music Video by Nick James Productions, YouTube
Risk signage
Risk signage is designed to raise the awareness of staff (and potentially visitors) to a hazard in their immediate environment and usually communicates a common consequence caused by that hazard with graphics used to overcome any language barriers (see Figure 10.5).

Figure 10.5: Hauteur reduite [Reduced Height]
Source: “Hauteur Reduite [Reduced Height]” by Leo Reynolds, flickr.com, CC BY-NC-SA 2.0
Many will be fixed signs whereas others are portable if the hazard is only present occasionally, such as Figure 10.6 for use only when the floor is wet.

Figure 10.6: A portable wet floor sign can be placed by cleaners to warn of the slip, trip and fall hazard posed by slippery wet floors
Source: “Stock photo image of a yellow ‘caution wet floor’ sign” by Rainbow International, flickr.com, CC BY 2.0
Finally, some other signs simply state the hazard as being present, in this case a toxic gas is used at this workplace (see Figure 10.7).
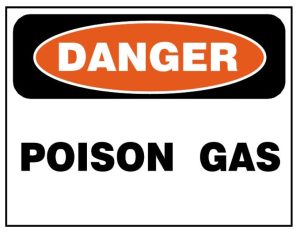
Figure 10.7: Danger sign advising that a poisonous gas is at the work site
Source: VectorPortal, CC BY 4.0
Tabal et al. (2023) found that safety signage is most accurately interpreted, and effectively used, when workers have undertaken general safety training as well as sign-specific training. Moreover, use of signs improves as workers age and/or acquire greater work experience. So while signs inform workers of the hazards, adherence to their message is enhanced when organisations also educate and train workers on the purpose of signage.
Safety I versus Safety II
In concluding this chapter, it is important to discuss Safety I versus Safety II. The transition from Safety I to Safety II is fundamentally a shift in mindset from focusing on what went wrong in an incident (Swiss Cheese Model) to what goes right day to day. It extends beyond considerations of safety culture (Reason, 1997; Hudson, 2007) towards a much more worker-centric approach to safety management, perhaps returning back towards Weick & Sutcliffe’s (2001) discussions of the mindfulness of workers in high reliability organisations. Safety I’s focus is on people as a source of error, whereas Safety II sees them as a “resource necessary for system flexibility and resilience” (Hollnegal et al., 2015, p. 4).
The shift from Safety I to Safety II is maybe no where more apparent than as reflected in the certification standards, as impacting on risk assessment. For AS/NZS 4801:2001 the focus was on taking organisations through the steps of the safety management system, adopting scientific management’s task orientation, whereas ISO 45001:2018 diagrammatically (see Figure 6.4) depicts leadership commitment and workers at the centre of safety management, reflecting a greater emphasis on human relations managerial approaches as critical to fostering the intrinsic worker motivation upon which safety management has always actually relied.
The emergence of Safety II recognises that everyone in the business, no matter their rank or status, must prioritise safety and take appropriate action in accordance with their role. In acknowledging the importance of front-line workers in their own safety, and that of others around them, we see James Reason’s flexible culture (Chapter 6) coming to life through efforts to balance a system’s administration with ‘Do’ and ‘Act’ (Plan-Do-Check-Act) to achieve continuous improvement. Whereas Safety I emphasises in the field risk assessment checklists, Safety II is more likely to encourage mindfulness, such as Take 5 (see Box 10.3).
Having completed risk assessment, and having contextualised its underpinnings during a time of transition from Safety I to Safety II, the next chapter will focus on how to control the risk associated with the hazard through hazard control.
"Good consultation enables workers to respond and contribute to issues that directly affect them, and provide valuable information and insights. It’s a two-way process where information and views are shared between PCBUs and workers. PCBUs can become more aware of hazards and issues experienced by workers, and involve them in finding solutions or addressing problems. Workers often notice issues and practices, or foresee consequences, that might otherwise be overlooked. PCBUs must genuinely consult with workers and their representatives, including HSRs, before any changes or decisions are made that may affect their health and safety. Consultation should take place during both the initial planning and implementation phases so that everyone's experience and expertise can be taken into account" (Safe Work SA, 2023, para. 8).
“Public health is the science and art of preventing disease, prolonging life, and promoting physical health and efficiency through organized community efforts for the sanitation of the environment, the control of community infections, the education of the individual principles of personal hygiene, the organization of medical and nursing service for the early diagnosis and preventative treatment of disease, and the development of the social machinery which will ensure to every individual in the community a standard of living adequate for the maintenance of health” (Windslow, 1920, p. 30)
“Reasonable adjustments are changes an employer makes to remove or reduce a disadvantage related to someone's disability. For example: making changes to the workplace, changing someone's working arrangements, finding a different way to do something, providing equipment, services or support. Reasonable adjustments are specific to an individual person. They can cover any area of work“ (Advisory, Conciliation and Arbitration Service, 2022, para. 1).
Note: Disability can be permanent or temporary.
In the Australian legal context:
"The concept of reasonable adjustments reflects the understanding that a worker with an injury, ill health or disability can often
perform tasks if adjustments are made to accommodate the effects of their injury, ill health or disability. The aim of any reasonable adjustment is to minimise the impact of the injury, health problem or disability to enable the worker to fully take part in work-related programs and effectively undertake the inherent requirements of their job.
Workers face many obstacles to participating in a life in work. Reasonable adjustments that support someone’s ability to work can be effective in:
> preventing deterioration of health and allowing employees with health problems to stay at work
> enabling employees to stay at work or return to work after injury
> assisting people with a disability to enter and stay in the workplace" (ComCare, 2013, para. 1).
"The care that a reasonable person exercises to avoid harm to other persons or their property" (Merriam-Webster, n.d., para. 1).
In principle, and in accordance with the Australian Model Work Health and Safety Bill, a regulator is a legally established government body whose functions are:
“ (a) to advise and make recommendations to the Minister and report on the operation and effectiveness of this Act;
(b) to monitor and enforce compliance with this Act;
(c) to provide advice and information on work health and safety to duty holders under this Act and to the community;
(d) to collect, analyse and publish statistics relating to work health and safety;
(e) to foster a co-operative, consultative relationship between duty holders and the persons to whom they owe duties and their representatives in relation to work health and safety matters;
(f) to promote and support education and training on matters relating to work health and safety;
(g) to engage in, promote and co-ordinate the sharing of information to achieve the object of this Act, including the sharing of information with a corresponding regulator;
(h) to conduct and defend proceedings under this Act before a court or tribunal;
(i) any other function conferred on the regulator by this Act”
(Safe Work Australia, 2023, section 152).
Likelihood is "the chance that something will happen" (Cambridge Dictionary, 2023, para. 1) compared with probability which is "mathematics concerned with the laws governing random events, including the collection, analysis and interpretation, and display of numerical data" (Porter, n.d., para. 1). This distinction is important in safety management as the term likelihood is used instead of probability because the actual probability of when a hazard will generate a particular harm is currently incalculable. In WHS management then, the term likelihood describes a rating that is collaboratively generated by the stakeholders involved based on what they know and what they perceive at that time - it is their perceived likelihood for the risk.
"ALARP is short for 'as low as reasonably practicable'. SFAIRP is short for 'so far as is reasonably practicable'. The two terms mean essentially the same thing and at their core is the concept of "reasonably practicable"; this involves weighing a risk against the trouble, time and money needed to control it" (Health and Safety Executive, n.d.-a, para. 2).
"ALARP is short for 'as low as reasonably practicable'. SFAIRP is short for 'so far as is reasonably practicable'. The two terms mean essentially the same thing and at their core is the concept of "reasonably practicable"; this involves weighing a risk against the trouble, time and money needed to control it" (Health and Safety Executive, n.d.-a, para. 2).
A critical incident is “a sudden, unexpected and overwhelming event, that is out of the range of expected experiences” (UNHCR, 2019, para. 1).
Probability is "mathematics concerned with the laws governing random events, including the collection, analysis and interpretation, and display of numerical data" (Porter, n.d., para. 1).
Australia's Model Work Health and Safety Bill defines reasonably practicable as:
"In this Act, reasonably practicable, in relation to a duty to ensure health and safety, means that which is, or was at a particular time, reasonably able to be done in relation to ensuring health and safety, taking into account and weighing up all relevant matters including:
(a) the likelihood of the hazard or the risk concerned occurring; and
(b) the degree of harm that might result from the hazard or the risk; and
(c) what the person concerned knows, or ought reasonably to know, about:
(i) the hazard or the risk; and
(ii) ways of eliminating or minimising the risk; and
(d) the availability and suitability of ways to eliminate or minimise the risk; and
(e) after assessing the extent of the risk and the available ways of eliminating or minimising the risk, the cost associated with available ways of eliminating or minimising the risk, including whether the cost is grossly disproportionate to the risk" (WorkSafe Australia, 2023, Section 18).
"Failing to notice significant changes to visual scenes...understanding the inability or failure to detect change is critical to improving worker safety (Solomon et al., 2021, p. 1).
“A culture that supports an organization’s OH&S management system is largely determined by top management and is the product of individual and group values, attitudes, managerial practices, perceptions, competencies and patters of activities that determine commitment to, and the style and proficiency of, its OH&S management system” (Standards Australia and Standards New Zealand, 2018), p. 27).
"The care and management of property and the provision of equipment and services (as for an industrial organization)" (Merriam-Webster, n.d, para. 2).
"To impart knowledge of some particular fact, occurrence, situation, etc." (Oxford English Dictionary, 2023, part 1.2).
"To help or cause (a person, the mind, etc.) to develop the intellectual and moral faculties in general; to impart wisdom to; to enlighten" (Oxford English Dictionary, 20223, part 5).
"To subject to discipline and instruction for development of character, behaviour, or skill" (Oxford English Dictionary, 2023, part 11.10).
Safety management is increasingly being classified into two eras (or paradigms); Safety I and Safety II.
Safety I, the dominant safety management paradigm from the 1960s into the 2000s, can be explained as a safety management approach that " presumes that things go wrong because of identifiable failures or malfunctions of specific components: technology, procedures, the human workers and the organisations in which they are embedded. Humans—acting alone or collectively—are therefore viewed predominantly as a liability or hazard, principally because they are the most variable of these components" (Hollnegal et al., 2015, p. 3). The Swiss Cheese Model of incident causation is an artifact of Safety I conceptualisations of safety management.
Safety II has emerged across the 2000s with Hollgegal advocating for a shift "from ensuring that ‘as few things as possible go wrong’ to ensuring that ‘as many things as possible go right’" (Hollnegal et al., 2015, p. 3). Their 2015 white paper "From Safety-I to Safety-II" essential coined the two terms and explained Safety II as assuming "that everyday performance variability provides the adaptations that are needed to respond to varying conditions, and hence is the reason why things go right. Humans are consequently seen as a resource necessary for system flexibility and resilience" (Hollnegal et al., 2015, p. 3).
In summary, Hollnegal et. al. consider Safety I’s focus to be on people as a source of error (active failures), whereas Safety II sees people as a “resource necessary for system flexibility and resilience” (Hollnegal et al., 2015, p. 4).
In the WHS context, “An incident is an unplanned event or chain of events that results in losses such as fatalities or injuries, damage to assets, equipment, the environment, business performance or company reputation” (Wolters Kluwer, n.d., para. 1).
"James Reason proposed the image of "Swiss cheese" to explain the occurrence of system failures...According to this metaphor, in a complex system, hazards are prevented from causing human losses by a series of barriers. Each barrier has unintended weaknesses, or holes – hence the similarity with Swiss cheese. These weaknesses are inconstant – i.e., the holes open and close at random. When by chance all holes are aligned, the hazard reaches the patient and causes harm" (Perneger, 2005, p. 71).
High reliability organisations are distinguished from other organisations as they have a: “…preoccupation with failure, reluctance to simplify interpretations, sensitivity to operations, commitment to resilience and deference to expertise” (Weick & Sutcliffe, 2001, p. 30).
Standards are agreed to principles and approaches established by panels of experts (International Organization for Standardization, n.d.).
Scientific Management may be defined as: “An approach to management, based on the theories of F.W. Taylor, dealing with the motivation to work. It sees it as a manager’s duty to find out the best way to do a given job, by a process of work measurement, then give each worker individual instructions which have to be strictly followed. The individual is thus seen as the extension of his or her machine, and his or her rewards are also to be allocated mechanically, with more pay expected to produce more output regardless of any other factors” (Statt, 1999, p. 150).
