7 Nervous Case Studies
Chapter Objectives
- Describe the anatomical variation, population incidence of a range of phenotypes, and Australian and New Zealand context of select examples of the nervous system, including the:
- sciatic nerve
- corpus callosum
- Discuss the clinical and/or professional impact of anatomical variation of the nervous system on patients and/or professional settings
Sciatic Nerve
Variation Classification: Topography
Description of Anatomy
The sciatic nerve is a peripheral nerve arising from the anterior rami of the L4 to S3 spinal nerves via the sacral plexus. It courses from the pelvic cavity through the greater sciatic foramen to emerge in the gluteal region deep to the gluteus maximus muscle. It then courses inferiorly into the posterior compartment of the femoral region deep to the long head of the biceps femoris of the hamstring muscle group where it divides into the tibial nerve medially and the common fibular nerve laterally. The sciatic nerve demonstrates topographic variation in its course from the pelvic cavity into the gluteal compartment and where it divides into its terminal branches.
Examples of Phenotypic Variation
As the sciatic nerve passes through the greater sciatic foramen it can either pass superior, through or inferior to the piriformis muscle. In cases where the nerve passes through the piriformis, it often presents with an early division such that the common fibular nerve passes through independently from the tibial nerve. Furthermore, the division of the sciatic nerve can occur at any point from not having a sciatic nerve at all (tibial and common fibular nerves arise independently from sacral plexus), a high division in the gluteal compartment, or the division may occur at any point in the posterior compartment of the femoral region.
Three phenotypes of the cerebral arterial circle are presented in a series of diagrams below. Use the slider tool to move between each phenotype and read the text underneath that describes each phenotype. By dragging the slider tool you can view the transition between each phenotype to clearly see how each phenotype differs from the next.
[Images: A. Kimmorley CC BY-NC]

Population Frequencies of Phenotypic Variation
| Source |
Natis et al., (2013)
|
Ogeng’0 et al, (2011)
|
Haladaj, et al, (2015)
|
Mbaka et al, (2022)
|
Gajbe et al, (2014)
|
Lewis et al, (2016)
|
|
Number of participants
|
294 limbs
Cadaver |
164 limbs
Cadaver |
30 limbs
Cadaver |
98 limbs
Cadaver |
60 limbs
Cadavers |
102 limbs
Cadaver |
|
Population
|
Caucasian
|
Black Kenyan
|
Polish
|
Nigerian
|
South Indian
|
USA
|
|
Phenotypes of the sciatic nerve in relation to the piriformis muscle
|
||||||
|
Undivided sciatic nerve inferior to the piriformis
|
93.6%
|
80%
|
66.7%
|
83%
|
72%
|
88%
|
|
One division of sciatic nerve through and the other inferior
|
4.1%
|
8%
|
20%
|
9%
|
2%
|
9%
|
|
One division superior and one division inferior to the piriformis
|
1%
|
2%
|
3.3%
|
2%
|
– |
3%
|
|
Divided sciatic nerve inferior to the piriformis.
|
–
|
–
|
–
|
10%
|
26%
|
–
|
Australian and New Zealand Context
Byun et al. (2019) investigated the age and sex-specific location of the sciatic nerve at the knee, as well as in the gluteal region (Byun et al., 2022) in a paediatric New South Wales Australian population. Using a medical imaging approach the authors demonstrated a significant correlation between the distance between the sciatic nerve location and palpable landmarks with age from 0 to 16 years, with significant sex differences largely observed in the older age category (12-16 years) likely associated with post-pubertal growth (Byun et al., 2019; Byun et al., 2022). The mean distance from the femoral bicondylar width to the terminal division of the sciatic nerve was reported as 3.2±1.04cm (Byun et al., 2019). The results of these studies provide critical knowledge to improve outcomes of peripheral anaesthetic blockade of the sciatic nerve or its terminal branches in a paediatric population with useful regression formulae proposed for clinical application. Examples of these recommended regression formulate are provided below:
Sciatic nerve location from most lateral point of the greater trochanter (cm) = 0.2719*Age in years + 2.7541 (Byun et al., 2022)
Tibial nerve location from most medial point of femur (cm) = 1.502 + (Age in years*0.09) + (Femoral bicondylar width in cm*0.466) (Byun et al., 2019)
Case Study on Sciatic Nerve: Case of Peripheral Anaesthetic Blockade of the Sciatic Nerve
A 15-year-old female patient is given a peripheral anaesthetic blockade of the sciatic nerve in the popliteal fossa to provide pain relief to her lower limb following surgery to correct a tibial shaft fracture. A peripheral nerve block allows targeted regional anaesthesia. The injection technique is critical to avoid nerve damage (when a needle may come in contact with the nerve) and ensure appropriate pain relief coverage. Typically, the needle is inserted at the superior apex of the popliteal fossa for an anaesthetic blockade of the sciatic nerve.
QUESTION 1: Which muscles and cutaneous regions should be numbed following peripheral anaesthetic blockade of the sciatic nerve in the popliteal fossa?
- Considering the patient received the nerve block at the apex of the popliteal fossa, what variation in the sciatic nerve could explain a lack of anaesthesia in the lateral compartment of the crural region (leg)?
QUESTION 2: In some cases a more distal nerve block is more appropriate such as a tibial nerve block. As reported by Byun et al. (2019) the location of the tibial and common fibular nerves is significantly correlated with age and becomes sexually dimorphic after puberty. Using the regression equation proposed by Byun et al. (2019) estimate the location of the tibial nerve in this patient to safely insert the needle to perform a tibial nerve block. The bicondylar femoral width of the patient is 7.2cm.
References and Further Reading
Ali, S. H. M., Omar, N., Shafie, M. S., Ismail, N. A. N., Hadi, H., & Nor, F. M. (2020). Sex estimation using subpubic angle from reconstructed three-dimensional computed tomography pelvic model in a contemporary Malaysian population. Anatomy & cell biology, 53(1), 27.
Byun, S., Gordon, J., Morris, S., Jacob, T., & Pather, N. (2019). A computed tomography and magnetic resonance imaging study of the variations of the sciatic nerve branches of the pediatric knee: Implications for peripheral nerve blockade. Clinical Anatomy (New York, N.Y.), 32(6), 836–850.
Byun, S., Morris, S., & Pather, N. (2022). Magnetic resonance imaging study of the sciatic nerve variation in the pediatric gluteal region: Implications for the posterior approach of the sciatic nerve blockade. Pediatric Anesthesia, 32(12), 1355–1364.
Haładaj, R., Pingot, M., Polguj, M., Wysiadecki, G., & Topol, M. (2015). Anthropometric study of the piriformis muscle and sciatic nerve: a morphological analysis in a Polish population. Medical Science Monitor: International Medical Journal of Experimental and Clinical Research, 21, 3760.
Lewis, S., Jurak, J., Lee, C., Lewis, R., & Gest, T. (2016). Anatomical variations of the sciatic nerve, in relation to the piriformis muscle. Translational Research in Anatomy, 5, 15-19.
Mbaka, G., & Osinubi, A. (2022). Morphometric study of sciatic nerve and its topographic anatomical variations in relation to landmark structures around pelvis: a Nigerian population study. Folia Morphologica, 81(1), 44-51.
Natsis, K., Totlis, T., Konstantinidis, G. A., Paraskevas, G., Piagkou, M., & Koebke, J. (2014). Anatomical variations between the sciatic nerve and the piriformis muscle: a contribution to surgical anatomy in piriformis syndrome. Surgical and Radiologic Anatomy, 36, 273-280.
Ogeng’o, J., El-Busaidy, H., Mwika, P., Khanbhai, M., & Munguti, J. (2011). Variant anatomy of sciatic nerve in a black Kenyan population. Folia Morphologica, 70(3), 175-179.
Corpus Callosum
Variation Classification: Morphology
Description of Anatomy
The corpus callosum is large, C shaped white matter tract located along the midsagittal plane, superior to the fornix and the third ventricle, within the brain. Functionally, the corpus callosum allows the transmission of motor and sensory information between the right and left hemispheres of the brain. Transmission of information occurs via white matter tracts that are related to the five anatomical subregions of the corpus callosum, from anterior to posterior: the rostrum, genu, body, isthmus and splenium. Most commonly, the corpus callosum demonstrates variations in morphology and developmental timing.
Test your knowledge of the anatomy of the corpus callosum by identifying each of the major subregions and the associated lobes of the brain within the diagram below. Check each of your answers by clicking on the question mark icon.
[Image: A. Kimmorley CC BY-NC]
Examples of Phenotypic Variation
Slight variations in callosal length, thickness and area are common between individuals. These variations can be relevant to the entire corpus callosum, but can also be subregion specific. Callosal thinning, known as notching, is also possible within the anterior and posterior regions of the corpus callosum.
Variations can also be present in the rate of development, with different subregions of the corpus callosum developing at different stages of development, and at varying rates between males and females. It is also possible for more significant variations in morphology to occur, such as complete or partial agenesis of the corpus callosum, however it is important to recognise that these more significant variations may be accompanied with significant and observable impacts on function, and therefore would not fall into the category of anatomical variation, but instead pathology. Such impacts on function could present as growth, communication, visual or auditory impediments.
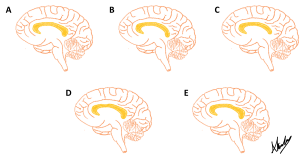
Five phenotypes of the corpus callosum are presented in a series of diagrams below. Use the slider tool to move between each phenotype and read the text underneath that describes each phenotype. By dragging the slider tool you can view the transition between each phenotype to clearly see how each phenotype differs from the next.
[Images: A. Kimmorley CC BY-NC 4.0]
Population Frequencies of Phenotypic Variation
| Source | Gupta et al. (2009) | Mohammadi et al. (2011) | Allouh et al. (2020) | Guz et al. (2019) | Karakas et al. (2011) | Sullivan et al. (2001) | |
| Number of participants | 30
MRI |
100
MRI |
40
MRI |
101
MRI |
23
MRI |
92
MRI |
|
| Population | North-West Indian | Iranian | Middle Eastern Arabs | Polish | Turkish | United States | |
| Length (mm) | Male | 75.7 | 71.0 | 68.8 | 69.4 | 73.0 | – |
| Female | 71.0 | 70.3 | 68.1 | 68.3 | 71.3 | – | |
| Total area (mm2) | Male | – | – | 592.1 | 622.2 | – | 720 |
| Female | – | – | 577.6 | 595.8 | – | 600 | |
Australian and New Zealand Context
Kimmorley et al. (2022; unpublished data) investigated the impact of sex and age on morphological and developmental timing variations of the corpus callosum, in an Australian paediatric population. Using computed tomography (CT) images of the cranial region of 320 individuals (132 males, 188 females), several measurements were taken on the midsagittal plane including anterior-posterior length, total and subregion area, and callosal width at three different points. These measurements were normalised for overall head size (midsagittal intracranial area). It was discovered that females had larger splenium area, anterior-posterior length, and callosal thickness from infancy to juvenile development, however these differences didn’t remain into adulthood (Kimmorley et al., 2022; unpublished data).
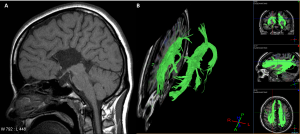
Case Study on Corpus Callosum: Case of Corpus Callosum Agenesis
MRI of the brain (A) of a 30-year-old women identified the absence of the corpus callosum as an incidental finding. The patient was well with no immediate signs or symptoms of callosal absence. The white matter tracts that usually contribute to the formation of the corpus callosum coursing through the midline of the brain instead can orientate vertically, to stay within each hemisphere. The white matter tracts are represented by the green in part B of the below figure.
QUESTION 1: Describe what white matter is composed of and how it differs from grey matter.
QUESTION 2: Typically, the function of the corpus callosum is to connect the two hemispheres of the brain, allowing the transfer of motor and sensory information. What type of physiological processes may be impacted by the absence of the corpus callosum?
QUESTION 3: The subregions of the corpus callosum are associated with the connections between particular lobes of the brain. Phenotypic differences in the size of parts of the corpus callosum have been demonstrated between individuals. What functional difference could be expected between individuals with a thin splenium compared to a thick splenium?
References and Further Reading
Allouh, M. Z., Al Barbarawi, M. M., Ali, H. A., Mustafa, A. G., & Alomari, S. O. (2020). Morphometric Analysis of the Corpus Callosum According to Age and Sex in Middle Eastern Arabs: Racial Comparisons and Clinical Correlations to Autism Spectrum Disorder. Frontiers in Systems Neuroscience, 14, 30–30. https://doi.org/10.3389/fnsys.2020.00030
Gupta, T., Singh, B., Kapoor, K., Gupta, M., & Kochhar, S. (2009). Normative data of corpus callosal morphology in a North-West Indian population – An autopsy and MRI study. Journal of Nepal Medical Association, 48(173), 46–51. https://doi.org/10.31729/jnma.201
Guz, W., Pazdan, D., Stachyra, S., Swieton, F., Poreba, P., Bednarz, M., Lis, A., Kazanska, A., Krukowska, J., Kleba, J., & Urbanik, A. (2019). Analysis of corpus callosum size depending on age and sex. Folia Morphologica, 78(1), 24–32. https://doi.org/10.5603/FM.a2018.0061
Karakas, P., Koc, Z., Koc, F., & Bozkir, M. G. (2011). Morphometric MRI evaluation of corpus callosum and ventricles in normal adults. Neurological Research (New York), 33(10), 1044–1049. https://doi.org/10.1179/1743132811Y.0000000030
Mohammadi, M. R., Zhand, P., Moghadam, B. M., & Golalipour, M. J. (2011). Measurement of the corpus callosum using magnetic resonance imaging in the North of Iran. Iranian Journal of Radiology, 8(4), 150–155. https://doi.org/10.5812/iranjradiol.4495
Sullivan, E. V., Rosenbloom, M. J., Desmond, J. E., & Pfefferbaum, A. (2001). Sex differences in corpus callosum size: relationship to age and intracranial size. Neurobiology of Aging, 22(4), 603–611. https://doi.org/10.1016/S0197-4580(01)00232-9
