4 Cardiovascular Case Studies
Chapter Objectives
- Describe the anatomical variation, population incidence of a range of phenotypes, and Australian and New Zealand context of select examples of the cardiovascular system, including the:
- cerebral arterial circle
- coronary arterial circulation
- pulmonary veins
- renal arteries
- Discuss the clinical and/or professional impact of anatomical variation of the cardiovascular system on patients and/or professional settings
Cerebral Arterial Circle
Variation Classification: Morphology and Frequency
Description of Anatomy
The cerebral arterial circle, also referred to as the Circle of Willis, is a connected series of blood vessels that lie at the base of the brain and contribute to the blood supply of the cerebrum and diencephalon of the brain. It is formed from the terminal branches of the internal carotid arteries (anterior cerebral artery and middle cerebral artery) and the vertebral arteries via the single basilar artery (posterior cerebral artery). These three cerebral arteries are connected by a number of communicating arteries to form anastomoses between these vessels.
The right and left anterior cerebral arteries are connected by the anterior communicating artery; and the middle cerebral and posterior cerebral arteries on each side are connected by a posterior communicating artery (right and left).
Test your knowledge of the anatomy of the Cerebral Arterial Circle by identifying each of the major blood vessels that contribute to the circle in the below diagram. Check each of your answers by clicking on the question mark icon.
[Image: L. Gregory CC BY-NC 4.0]
Check your understanding of the blood supply of the cerebrum by completing the below fill-in-the-blank activity.
Examples of Phenotypic Variation
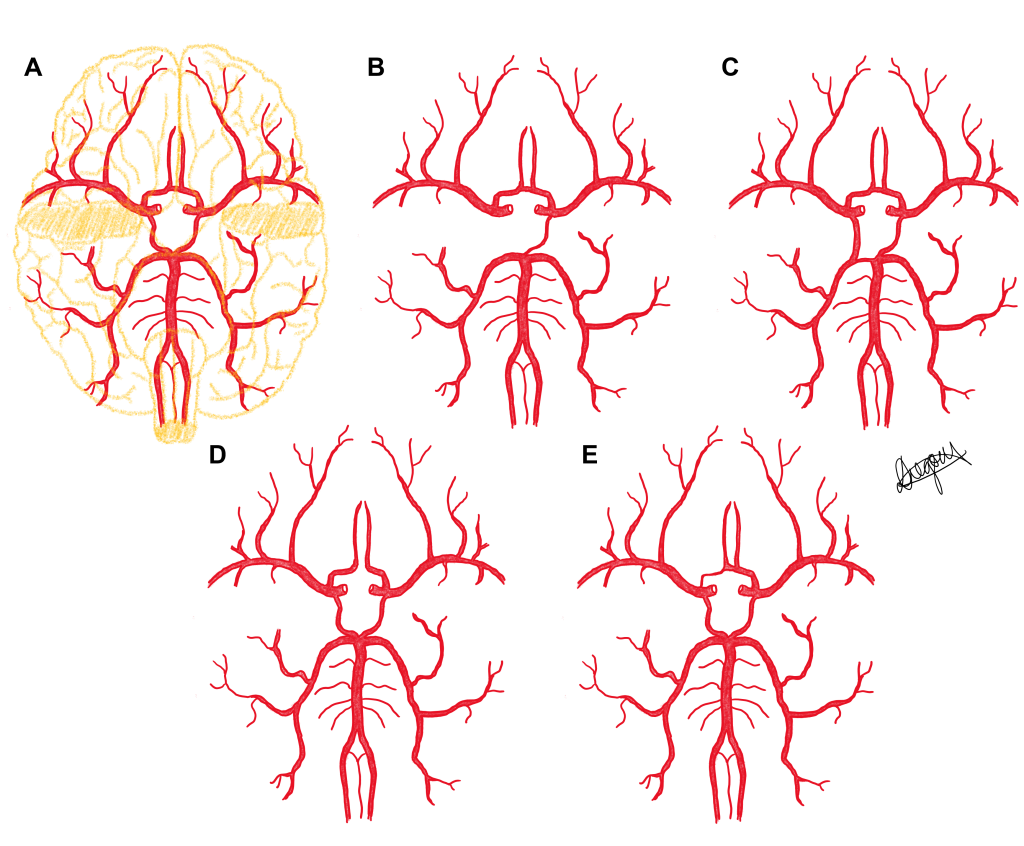
Most variation in the cerebral arterial circle exists within the communicating arteries in the form of (i) morphological differences in size with varying diameters reported – hypoplasia (under-developed) and hyperplasia (increased size); and (ii) frequency differences in the presence or absence of the communicating arteries. These variations result in each individual having either a ‘complete’ or ‘incomplete’ cerebral arterial circle, with a complete circle having the presence of all communicating arteries (the anterior communicating, and right and left posterior communicating arteries). Whilst textbooks typically describe the anatomy of the cerebral arterial circle as complete, research indicates that the majority of individuals have an incomplete circle.
Five phenotypes of the cerebral arterial circle are presented in a series of diagrams below. Use the slider tool to move between each phenotype and read the text underneath that describes each phenotype. By dragging the slider tool you can view the transition between each phenotype to clearly see how each phenotype differs from the next.
Population Frequencies of Phenotypic Variation
| Source | De Silva et al. (2011) | Eftekhar et al. (2006)
|
Hindenes et al. (2020) | Nyasa et al. (2021) | Kilmek-Piotrowska et al. (2016) | El-Barhoun et al. (2009) | |
| Population | Sri lankan | Iranian | German | Malawaian | Polish | Australia | |
| Sample size | 225 (cadaver) | 102 (cadaver) | 1864 (MRA) | 24 (Cadaveric images) | 100 (Cadaver) | 171 (MRA) | |
| Definition of hypoplastic | <1mm | <1mm | <1mma | <1mm | <1mm | <0.8mma | |
| Number of variants identified | 16 | 12 | 47 | 19 | 35 | 36 | |
| Phenotypes | |||||||
| Complete | 14% | 28% | 11.9% | 26% | 27% | 32% | |
| Posterior communicating artery | Unilateral hypoplasia | 12% | 27% | 12% | 21% | 27% | 10% |
| Unilateral absence | — | 7% | 29% | 14% | |||
| Bilateral hypoplasia | 23% | 33% | 28% | 0% | 19% | 10% | |
| Bilateral absence | — | 3% | 0% | 2% | |||
| Anterior communicating artery | Absent | 0% | 1% | 2.6% | 0% | 1% | 3% |
| Hypoplastic | 14% | 11% | 12% | 7% | |||
| Proximal part of anterior cerebral artery (A1) | Absent | – | 0%a | 0.5% | 0% | 1% | 0.5% |
| Hypoplastic | 3% | 4% | 2%
|
||||
a. study did not discriminate between absent and hypoplastic arteries.
Australian and New Zealand Context
In 2009, El-Barhoun et al. conducted a study which aimed to determine the reference measurements for all major cerebral arterial circle arteries within an Australian population. They also reported the prevalence and disease associations of cerebral variants within this population. Authors used a sample of 170 MRI studies collected in Melbourne. In relation to the diameter of the cerebral arteries, authors presented percentile charts that can be used to identify whether an individual’s diameter is sitting within the typical range or is smaller or larger and therefore may indicate the need for further clinical investigation. All arteries had a 50th percentile diameter between 2-4.5mm, depending on the artery (El-Barhoun et al., 2009).
El-Barhoun et al. (2009) reported thirty-two percent of individuals with a complete cerebral arterial circle. The anterior part of the circle was entirely complete in 83% of individuals, and the posterior circle was complete in 52% of individuals. The most common anterior variant in this Australian population was an absent or hypoplastic anterior communicating artery (11%). Two variants were equally as frequent within the posterior part of the circle; a unilateral or bilateral absence or hypoplastic posterior communicating artery was found in 30% of the population (15% unilateral, 15% bilateral). Importantly, no significant associations were found between any variants of the cerebral arterial circle and aneurysm location based on the pathological MRI findings (El-Barhoun et al., 2009).
No similar studies, to the best of our knowledge, have been conducted in a New Zealand or Māori population.
Case Study on Cerebral Arterial Circle: Case of a Stroke
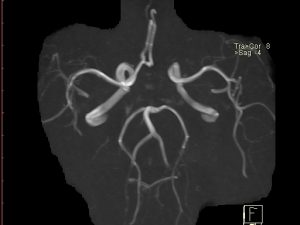
A 72 year old female patient presents having suffered a stroke. An MRI arteriogram of the vertebral and internal carotid arteries was performed 1 year prior to the stroke during a migraine assessment. Review the anatomy of the cerebral arterial circle of the patient in the arteriogram on the right taken 1 year ago – use the diagrams in figure 4.1 to help you. You can also click on the link in the legend of figure 4.2 to explore the arteriogram in different 3D planes.
QUESTION 1: Discuss the consequences to the patient if the stroke was caused by an occluding lesion in the left vertebral artery, left internal carotid artery or left anterior cerebral artery.
- Consider the specific loss of function each lesion would result in by considering which area of the brain would lose blood supply
- Which lesion would you consider the most serious and why?
QUESTION 2: Describe the anatomical variation phenotype present in this patient case (examine arteriogram on the right). What impact does the anatomical variation phenotype of the patient have on the outcomes of a lesion in each case?
QUESTION 3: What impact does the position of the lesion have on the outcomes in each case? Consider the following scenarios:
- lesion in cavernous part of internal carotid artery compared to lesion in cerebral part of internal carotid artery
- lesion in A1 segment of anterior cerebral artery compared to A2 segment of anterior cerebral artery
References and Further Reading
De Silva, K. R. D., Silva, R., Amaratunga, D., Gunasekera, W., & Jayesekera, R. W. (2011). Types of the cerebral arterial circle (circle of Willis) in a Sri Lankan population. BMC neurology, 11(1), 1-8.
Eftekhar, B., Dadmehr, M., Ansari, S., Ghodsi, M., Nazparvar, B., & Ketabchi, E. (2006). Are the distributions of variations of circle of Willis different in different populations?–Results of an anatomical study and review of literature. BMC neurology, 6(1), 1-9.
El‐Barhoun, E., Gledhill, S., & Pitman, A. (2009). Circle of Willis artery diameters on MR angiography: an Australian reference database. Journal of Medical Imaging and Radiation Oncology, 53(3), 248-260.
Hindenes, L. B., Håberg, A. K., Johnsen, L. H., Mathiesen, E. B., Robben, D., & Vangberg, T. R. (2020). Variations in the Circle of Willis in a large population sample using 3D TOF angiography: The Tromsø Study. PloS one, 15(11), e0241373.
Klimek-Piotrowska, W., Rybicka, M., Wojnarska, A., Wójtowicz, A., Koziej, M., & Hołda, M. K. (2016). A multitude of variations in the configuration of the circle of Willis: an autopsy study. Anatomical Science International, 91(4), 325-333.
Nyasa, C., Mwakikunga, A., Tembo, L. H., Dzamalala, C., & Ihunwo, A. O. (2021). Anatomical variations and morphometric properties of the circulus arteriosus cerebri in a cadaveric Malawian population. Folia Morphologica, 80(4), 820-826.
Coronary Arterial Circulation
Variation Classification: Morphology and Frequency
Description of Anatomy
The coronary arterial circulation consists of the right and left coronary arteries and their branches to provide the blood supply to the myocardium of the heart. The right coronary artery arises as a collateral branch of the ascending aorta at the right aortic sinus. It then courses through the right atrioventricular groove to terminate in the wall of the left ventricle. While the right coronary artery has many small collateral branches, it typically has two large collateral branches: the right acute marginal artery that courses inferiorly onto the lateral wall of the right ventricle and the posterior interventricular or posterior descending artery that courses inferiorly along the posterior aspect of the interventricular groove. The left coronary artery arises as a collateral branch of the ascending aorta at the left aortic sinus. It is a relatively short vessel of approximately 1-2 cm in length, which terminates as the anterior interventricular or anterior descending artery and the circumflex artery. The anterior interventricular artery as its name suggests courses along the anterior aspect of the interventricular groove and the circumflex artery courses laterally through the left atrioventricular groove. These terminal branches also have many other small collateral branches.
Test your knowledge of the anatomy of the Coronary Arterial Circulation by identifying each of the major blood vessels labelled in the below diagram. Check each of your answers by clicking on the question mark icon.
Examples of Phenotypic Variation
Variation in the coronary arterial circulation is common with a large number of phenotypic variations observed. These variations can be classified on the basis of (i) morphological differences of the origin, length, diameter and branching pattern of the right and left coronary arteries (eg. the posterior interventricular artery can be a collateral branch of the circumflex artery rather than the right coronary artery; or the coronary ostium may be located on the pulmonary trunk rather than the ascending aorta); and (ii) frequency differences in the presence or absence of one of the coronary arteries (eg. a single coronary artery such as an absent left coronary artery where the circumflex and anterior interventricular arteries branch directly from the ascending aorta or arise as branches of the right coronary artery). Note that with these phenotypic differences, the vessel continues to be named according to its location rather than its origin or branching pattern.
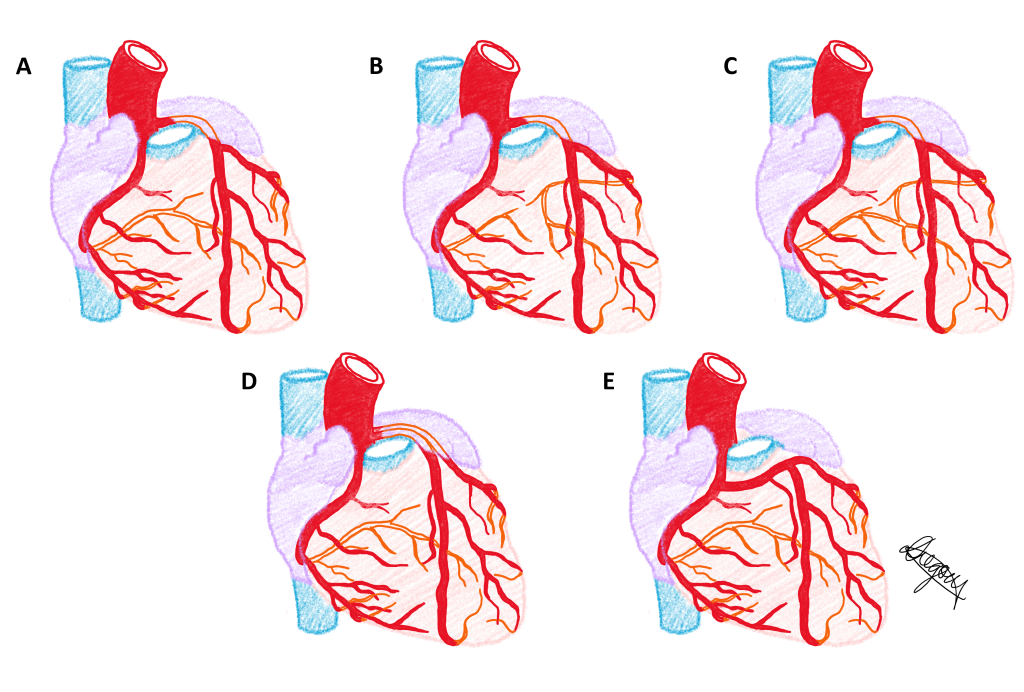
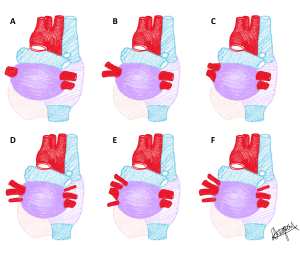
Five phenotypes of the coronary arterial circulation are presented in a series of diagrams below. Use the slider tool to move between each phenotype and read the text underneath that describes each phenotype. By dragging the slider tool you can view the transition between each phenotype to clearly see how each phenotype differs from the next.
The same five phenotypes of the coronary arterial circulation are presented in a single diagram below.
Population Frequencies of Phenotypic Variation of Coronary artery dominance
| Source | Paratz et al. (2022) | Hussain et al. (2008) | Singh et al. (2019) | Fazliogullari et al. (2010) | Rehman et al. (2011) | Gonzalez Bonilla et al. (2020) |
| Number of participants | 490 | 60 | 215 | 50 | 200 | 430 |
| Population | Australian | Bangladeshi | Northern Indian | Turkish | Pakistani | African American |
| Right dominance | 87% | 90% | 85% | 42% | 60.5% | 70% |
| Left dominance | 9% | 10% | 11% | 14% | 19.5% | 9% |
| Co-dominance | 2% | 0% | 4% | 44% | 20% | 21% |
Australian and New Zealand Context
Australia
To the best of our knowledge, there has only been one study investigating the population variance of coronary arteries in an Australian population. Paratz et al. (2022) performed an investigation into coronary artery anatomy and variation in a population of 490 individuals from Victoria, Australia. Patients were aged between 1 and 50 years old and all died from sudden cardiac death. A forensic pathologist performed autopsies on all patients, detailing the anatomical and histological features of the heart and coronary artery anatomy. Coronary artery anatomy was not deemed as a cause of death for any patients (Paratz et al., 2022).
Of the 490 patients that were included in the study, 87% displayed a right dominant arterial system: one right coronary artery giving rise to the posterior descending artery and the left coronary artery terminally dividing into the circumflex and left anterior descending artery. Nine percent (9%) of the patient population displayed a left dominant circulation, and co-dominance was reported in 2% of the population (Paratz et al., 2022). This incidence of coronary artery dominance is similar to that reported by Singh et al. (2019) in a Northern Indian population and Hussain et al. (2008) in a Bangladeshi population.
Paratz et al. (2022) also reported a total of 3 patients that displayed rarer anatomical variants – their variations are outlined below!
- The left coronary artery originated from the anterior (right) aortic sinus.
- Right coronary artery originated from the posterior (left) aortic opposite sinus. Because of this the ostium (opening) of the RCA is flattened and ‘slit-like’.
- Single left ostium with the right coronary artery arising from the left main ostium – meaning that both coronary arteries share the same origin.
New Zealand
Medrano-Gracia et al. (2016) explored variation in the diameter, length and angle of the major coronary artery bifurcations in a New Zealand Population (n=300, 85% European, 11% ‘other’). The authors aimed to develop a 3D computed tomography computational atlas of the typical coronary artery anatomy to aid in clinical practice stent design and selection, and to inform optimal treatment. They determined the mean length of the left coronary artery to be 10.5±5.3 mm, and the mean lumen diameter to be 3.5±0.8 mm. We can compare lumen diameter to other reported populations to demonstrate population variation; Korean average lumen diameter is 4.5±0.6 mm and in a Polish Caucasian population it is 5.07±0.7 mm (Skowronski et al., 2020).
Authors also reported significant sexual dimorphism in the angle of the bifurcation of the left coronary artery into the left anterior descending and circumflex artery. Males reported a wider angle of 85° compared to females who averaged 74° (p<0.001) (Medrano-Gracia et al., 2016).
Case Study on Coronary Arterial Circulation: Myocardial Infarction
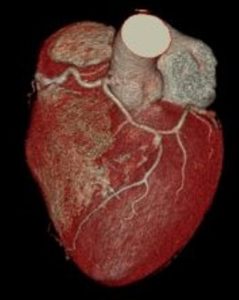
A 54 year old male patient presents having suffered a myocardial infarction. A computed tomography (CT) angiogram of the coronary arterial circulation was performed in the emergency department of the hospital. Review the phenotypic variation of the patient’s coronary arterial circulation on the right.
QUESTION 1: Significant atherosclerosis of the right coronary artery was identified in the posterior interventricular artery and circumflex artery.
- Consider the impact of total occlusion of the posterior interventricular artery on the patient. Will this occlusion lead to widespread ischaemia and cell death to the myocardium? Why or why not.
- Refer to the article by Loukas et al. (2010) and describe when, how and where anastomoses can form in the coronary arterial circulation.
- Would it make a difference to the patient outcome if the occlusion occurs by an occlusive thrombus compared to an embolus? Explain.
QUESTION 2: Describe the anatomical variation phenotype present in the patient. What impact does the anatomical variation phenotype of the patient have on the outcomes of an occlusion in this case compared to other phenotypes such as right dominant branching pattern?
QUESTION 3: Consider the patient now has two occlusions – one in the posterior interventricular artery and one in the circumflex artery, again with reference to the patient’s phenotypic variation. What impact does the position of the occlusion have on the patient outcomes? Consider:
- occlusion in circumflex artery proximal to anterior interventricular artery branch compared to distal to anterior interventricular artery branch
References and Further Reading
Fazliogullari, Z., Karabulut, A. K., Unver Dogan, N., & Uysal, I. I. (2010). Coronary artery variations and median artery in Turkish cadaver hearts. Singapore Medical Journal, 51(10), 775–780.
Gonzalez Bonilla, H. M., Ganta, N., Awan, A. A., & Opoku Asare, I. (2020). Coronary Artery Dominance, Anatomical Variants and Anomalies in African American Population. Circulation, 142(Suppl_3), A15360-A15360.
Hussain, M., Nahar, A., & Ara, S. (2008). The Dominance Pattern of Coronary Artery of Adult Bangladeshi People-A Postmortem Morphological Study. Cardiovascular Journal, 1(1), 21-25. http://dx.doi.org/10.3329/cardio.v1i1.8200
Loukas, M., Bilinsky, S., Bilinsky, E., Matusz, P., & Anderson, R. H. (2010). The clinical anatomy of the coronary collateral circulation. Clinical Anatomy (New York, N.Y.), 23(2), 247–247. https://doi.org/10.1002/ca.20929
Medrano-Gracia, P., Ormiston, J., Webster, M., Beier, S., Young, A., Ellis, C., Wang. C., Smedby. O., & Cowan, B. (2016). A computational atlas of normal coronary artery anatomy. EuroIntervention, 12(7), 845-854.
Paratz, E. D., van Heusden, A., Zentner, D., Morgan, N., Smith, K., Ball, J., Thompson, T., James, P., Connell, V., Pflaumer, A., Semsarian, C., Ingles, J., Stub, D., Parsons, S., & La Gerche, A. (2022). Prevalence of Coronary Artery Anomalies in Young and Middle-Aged Sudden Cardiac Death Victims (from a Prospective State-Wide Registry). The American Journal of Cardiology, 175, 127–130. https://doi.org/10.1016/j.amjcard.2022.03.055
Rehman, M., Hussain, J., Ahmad, I., & Mian, F. A. (2011). Coronary Artery Dominance: What pattern exists in Pakistani Population?Annals of Pakistan Institute of Medical Sciences, 7(1), 3-5.
Skowronski, J., Cho, I., Mintz, G. S., Wolny, R., Opolski, M. P., Cha, M. J., Lee, W. S., Michalowska, I., Kepka. C., Kruk. M., Tyczynski. P., Kalinczuk. L., Kukula. K., Ciszewski. M., Banasiak. A., Chmielak. Z., Witowski. A., Kim. S. W., & Pregowski, J. (2020). Inter-ethnic differences in normal coronary anatomy between Caucasian (Polish) and Asian (Korean) populations. European Journal of Radiology, 130, 109185.
Singh, V., Kottapalli, S. B., Gupta, R., Agarwal, N., & Yadav, Y. (2019). Coronary Artery Dominance In North Indian Population by The Angiographic Method. National Journal of Integrated Research in Medicine. (10), 70-72.
Pulmonary Veins
Variation Classification: Morphology and Frequency
Description of Anatomy
The right and left pulmonary veins transport oxygenated blood from the lungs to the left atrium of the heart. These vessels are typically more numerous at the hilum of the lungs and confluence (join together) as they course towards the heart. The pattern of confluence can vary between individuals such that the frequency of veins entering the left atrium and the size of the ostia (openings) of each vessel demonstrate phenotypic variation.
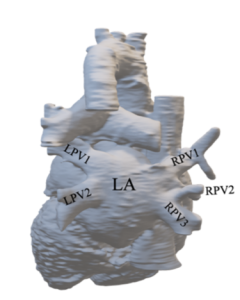
Test your knowledge of the anatomy of the Pulmonary veins by identifying each of the major blood vessels and chambers labelled in the below diagram of the posterior view of the heart. Check each of your answers by clicking on the question mark icon.
Examples of Phenotypic Variation
Pulmonary vein variation is classified by Shukla et al. (2012) based on the number of vessels entering the left atrium and whether these vessels have a separate or shared ostium within 10mm of the heart. The type number describes the number of pulmonary veins on each side and the letter (A or B) describes the number of ostia for these pulmonary veins, where A is a separate ostium per vessel, and B denotes having one or more shared ostia as they enter the left atrium. In most populations the most frequent phenotype is Type IIA having two right and two left pulmonary veins with two ostia. Variation is observed more commonly in the right pulmonary veins.
Each of the pulmonary vein phenotypes described by Shukla et al. (2012) classification are presented in a series of diagrams below. Use the slider tool to move between each phenotype and read the text underneath that describes each phenotype. By dragging the slider tool you can view the transition between each phenotype to clearly see how each phenotype differs from the next. Type I: one pulmonary vein; Type IIA: two pulmonary veins with two ostia; Type IIB: two pulmonary veins with shared ostium; Type IIIA: three pulmonary veins with three ostia; Type IIIB: three pulmonary veins with one or more shared ostia; Type IVA: four pulmonary veins with four ostia; Type IVB: four pulmonary veins with one or more shared ostia.
[Images: L. Gregory CC BY-NC 4.0]
Population Frequencies of Phenotypic Variation
| Source | Phillips et al. (under review 2023) | McLellan et al. (2014) | Thorning et al. (2011) | Harbi et al. (2014) | Skowerski et al. (2018) | Tekbas et al. (2012) | Wannasopha et al. (2012) | Shukla et al. (2012) |
| Population | Australian | Australian | British | Saudi Arabian | Polish | Turkish | Thai | Indian |
| Sample size | 86 | 102 | 176 | 151 | 271 | 783 | 2290 | 29 |
| Sample type | Non-Atrial Fibrillation patients | Atrial Fibrillation patients | Atrial Fibrillation patients | Healthy (135) + Cardiac pathology (16) patients | Healthy (40) + Atrial Fibrillation patients (231) | Healthy patients | Patients with Lung disorders | Healthy patients |
| Right – Number of Pulmonary Veins based on Skukla et al. (2012) classification | ||||||||
| 2 Pulmonary veins – shared ostium (Type IIB) | 1.2% | 2.0% | 0.5% | 0.0% | 2.3% | 11.0% | 3.8% | 3.4% |
| 2 Pulmonary veins (Type IIA) | 63.9% | 78.0% | 82.0% | 86.0% | 79.0% | 61.0% | 90.3% | 76.0% |
| 3 Pulmonary veins (Types IIIA and IIIB) | 27.9% | 20.0% (and type IV) | 17.0% | 14.0% | 18.7% | 14.6% | 6.3% | 17.2% |
| 4 Pulmonary veins (Type IV) | 7.0% | – | 0.5% | 0.0% | 0.0% | 13.4% | 0.0% | 3.4% |
| Left – Number of Pulmonary Veins based on Shukla et al. (2012) classification | ||||||||
| 2 Pulmonary veins – shared ostium (Type IIB) | 1.2% | 37.0% | 8.5% | 1.3% | 9.0% | 1.0% | 59.0% | 17.2% |
| 2 Pulmonary veins (Type IIA) | 93.0% | 59.0% | 91.0% | 96.0% | 89.2% | 2.0% | 41.0% | 79.3% |
| 3 Pulmonary veins (Types IIIA and IIIB) | 5.8% | 4.0% (and type IV) | 0.5% | 2.7% | 1.8% | 18.0% | 0.0% | 3.4% |
| 4 Pulmonary veins (Type IV) | 0.0% | – | 0.0% | 0.0% | 0.0% | 76.0% | 0.0% | 0.0% |
Australian and New Zealand Context
Phillips et al. (2023; under review) investigated the morphological and frequency-specific variations of the pulmonary veins in a Queensland, Australian paediatric population (n=86). The number of pulmonary veins and ostia were recorded for each side in each patient, and the normalised cross-sectional area was measured for each vessel. The majority of patients displayed the Type IIA phenotype with two pulmonary veins and two ostia on the right (63.9%) and left (93%) sides. Type I phenotype with a single pulmonary vein was observed in only one patient; Type III and Type IV phenotypes having three or four pulmonary veins were found to be more frequent on the right side (34.9% right, 5.8% left). This higher frequency of pulmonary veins on the right side may be associated with the vessel’s relationship with the number of lobes of the lung; with typically three lobes in the right lung, it is not surprising that more than two pulmonary veins were more common on the right side than the left (associated with typically two lobes of the left lung). This proportion of patients displaying Type III phenotypes is markedly larger in this Queensland population (27.9%), compared to other healthy populations such as 14.6% in a Turkish population (Tekbas et al., 2012) and 17.2% in an Indian population (Shukla et al., 2012). Pulmonary veins demonstrated significant variance in cross-sectional area on the one side, suggesting that ipsilateral vessels do not have equivalent sizes. The pulmonary veins had a significantly greater mean normalised cross-sectional area and significantly larger total cross-sectional area (total of all pulmonary vein areas on one side) on the right side compared to the left. Interestingly the data also indicated that the volume of blood flowing through the pulmonary veins varies between different phenotypes, with Type III phenotypes having significantly larger normalised total cross-sectional area than Type II phenotypes (Phillips et al., 2023; under review).
McLellan et al. (2014) studied a sample of atrial fibrillation patients from Victoria, Australia (n=102) prior to pulmonary vein ablation. The study concluded that pulmonary vein phenotype was a significant determinant on the patient outcome following pulmonary vein isolation to treat atrial fibrillation (refer to the case study below for more details). Patients with Type IIA phenotypes were at significantly greater risk of atrial fibrillation recurrence following treatment and patients having Type IIB phenotypes on the left side associated with a significantly improved outcome following surgery. The highest reported phenotype in this study was Type IIA with 78% observed on the right and 59% observed on the left. Interestingly a relatively high number of Type IIB were observed on the left side in this population (McLellan et al., 2014).
Clarke et al. (2021) conducted a study in 2021 to investigate the ethnic differences in anatomy between indigenous and non-indigenous Australians, that may contribute to the elevated risk of atrial fibrillation Aboriginal and Torres Strait Islander people. CT was used to categorise the anatomy of the left atrium, pulmonary vein (PV) and left atrial appendage within Indigenous Australians (n=20), and non-indigenous Australians (n=20). A total of 166 pulmonary veins were identified for analysis. Analysis identified no significant difference in phenotypic presentation between the two populations: including number, morphology, diameter or ostial (opening) characteristics. Regardless of ethnicity, the ostial diameter of the right-sided PVs were greater than the left-sided PVs. Despite previous studies reporting increased incidence of atrial fibrillation in patients with Type III or Type IV phenotypes, Clarke et al. (2021) concluded that there was no evidence of anatomical differences between the Indigenous and non-Indigenous cohorts, suggesting that atrial fibrillation risk was not dependent on anatomical variation of the pulmonary veins within these cohorts.
Case Study on Pulmonary Veins: Atrial Fibrillation
A 75 year old male patient presents with irregular heartbeat, shortness of breath and dizziness. An electrocardiogram of the pattern of contractions of the heart is performed, indicating the patient has atrial fibrillation. Atrial fibrillation is characterised by an irregular heartbeat where the electrical signals in the left atrium are chaotic, disrupting blood flow between the chambers and often resulting in the formation of blood clots. After medication fails to improve the irregular heartbeat, the patient is recommended for pulmonary vein isolation/ablation.
Pulmonary vein isolation/ablation is a surgical procedure that introduces heat or cold energy to burn small areas of the pulmonary vein wall just proximal to the left atrium where irregular electrical activity is occurring. The most common route for catheter entry is the femoral vein allowing the catheter to enter the right atrium. A transseptal puncture of the interatrial septum at the fossa ovalis is performed to allow the catheter access to the left atrium to perform the pulmonary vein ablation. Alternatively the catheter can be introduced into the left atrium via a retroaortic approach through the femoral artery.
Review Figure 4.6. Posterior view of a three-dimensional reconstruction of the patient’s heart.
QUESTION 1: Review the course of the catheter via the femoral vein and femoral artery to access the left atrium of the heart. Draw a flowchart to demonstrate the blood vessels the catheter would pass through in each procedure.
QUESTION 2: Describe the anatomical variation phenotype of the pulmonary veins present in the patient using the Shukla et al. (2012) classification system/ phenotype types above.
- A number of research studies have suggested that patients with atrial fibrillation have a higher number of accessory pulmonary veins (more than two on either side) than healthy patients. Considering that the risk of atrial fibrillation increases with age, hypothesise why the number of pulmonary veins may influence presentation of symptoms of atrial fibrillation?
- Why would knowledge of the number of pulmonary veins be important when performing pulmonary vein ablation?
QUESTION 3: Atrial fibrillation may result in the formation of blood clots. Describe how this can result in patient stroke if left untreated.
References and Further Reading
Clarke, N. A. R., Kangaharan, N., Costello, B., Tu, S. J., Hanna-Rivero, N., Le, K., Agahari, I., Choo, W. K., Pitman, B. M., Gallagher, C., Haji, K., Roberts-Thomson, K. C., Sanders, P., & Wong, C. X. (2021). Left atrial, pulmonary vein, and left atrial appendage anatomy in Indigenous individuals: Implications for atrial fibrillation. International Journal of Cardiology. Heart & Vasculature, 34, 100775–100775. https://doi.org/10.1016/j.ijcha.2021.100775
Harbi, A., Mhish, H., AlShehri, H. Z. M., & Das, K. M. (2014). Anatomical variation of pulmonary venous ostium and its relationship with atrial arrhythmia in the Saudi population. Journal Of The Saudi Heart Association, 26(2), 81–85. https://doi.org/10.1016/j.jsha.2013.11.007
McLellan, A. J. A., Ling, L., Ruggiero, D., Wong, M. C. G., Walters, T. E., Nisbet, A., Shetty, A. K., Azzopardi, S., Taylor, A. J., Morton, J. B., Kalman, J. M., & Kistler, P. M. (2014). Pulmonary vein isolation: The impact of pulmonary venous anatomy on long-term outcome of catheter ablation for paroxysmal atrial fibrillation. Heart Rhythm, 11(4), 549–556. https://doi.org/10.1016/j.hrthm.2013.12.025
Phillips, R., Reynolds, M.S., and Gregory, L.S. (2023) Pulmonary vein phenotypic and size variation in an Australian paediatric sample. (currently under review)
Shukla, L., Gaur, N., Soni, G., & Dhall, U. (2012). Variation in Number and Drainage Pattern of Pulmonary Veins Draining into the Left Atrium. Journal of the Anatomical Society of India, 61(1), 5–8. https://doi.org/10.1016/S0003-2778(12)80003-7
Skowerski, M., Wozniak-Skowerska, I., Hoffmann, A., Nowak, S., Skowerski, T., Sosnowski, M., Wnuk-Wojnar, A. M., & Mizia-Stec, K. (2018). Pulmonary vein anatomy variants as a biomarker of atrial fibrillation – CT angiography evaluation. BMC Cardiovascular Disorders, 18(1), 146–146. https://doi.org/10.1186/s12872-018-0884-3
Tekbas, G., Gumus, H., Onder, H., Ekici, F., Hamidi, C., Tekbas, E., Gulicetincakmak, M., Yavuz, C., & Bilici, A. (2011). Evaluation of pulmonary vein variations and anomalies with 64 slice multi detector computed tomography. Wiener Klinische Wochenschrift, 124(1-2), 3–10. https://doi.org/10.1007/s00508-011-0086-9
Thorning, C., Hamady, M., Liaw, J. V. P., Juli, C., Lim, P. B., Dhawan, R., Peters, N. S., Davies, D. W., Kanagaratnam, P., O’Neill, M. D., & Wright, A. R. (2011). CT evaluation of pulmonary venous anatomy variation in patients undergoing catheter ablation for atrial fibrillation. Clinical Imaging, 35(1), 1–9. https://doi.org/10.1016/j.clinimag.2009.11.005
Wannasopha, Y., Oilmungmool, N., & Euathrongchit, J. (2012). Anatomical variations of pulmonary venous drainage in Thai people: multidetector CT study. Biomedical Imaging and Intervention Journal, 8(1), e4–8. https://doi.org/10.2349/biij.8.1.e4
Renal Arteries
Variation Classification: Morphology, Topography and Frequency
Description of Anatomy
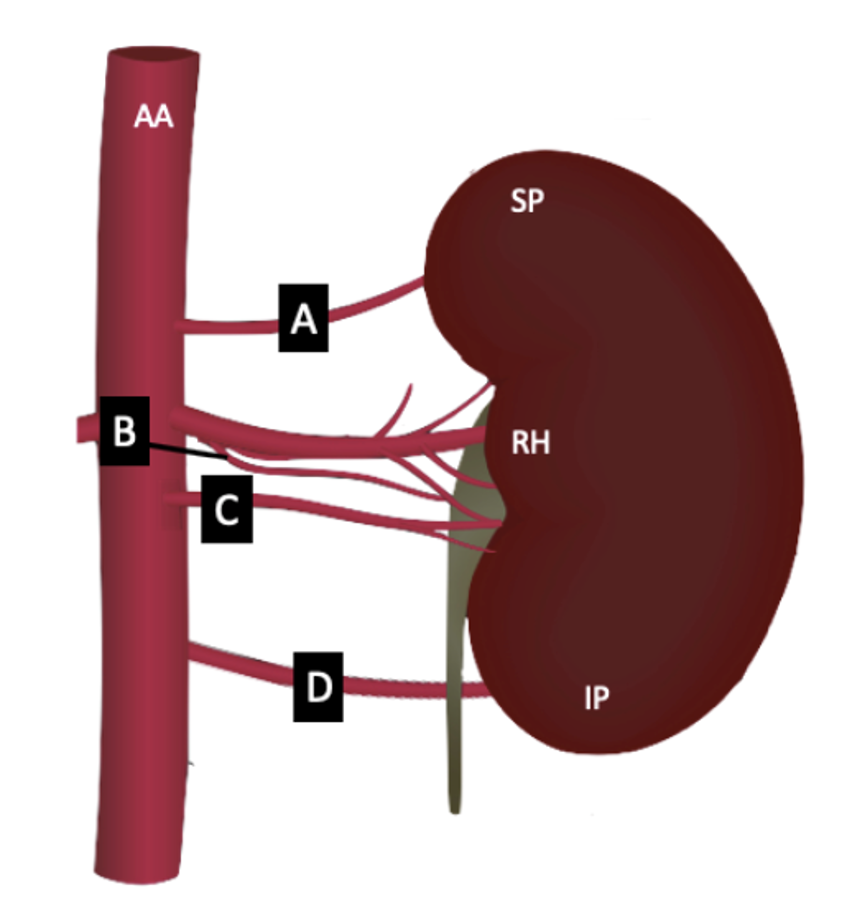
The right and left renal arteries typically arise as collateral branches of the abdominal aorta at a vertebral level of L1 just inferior to the origin of the superior mesenteric artery and enter the kidney at its hilum. The origin, course and number of these vessels can vary between individuals as well as intraindividually between the right and left sides of the same patient. There are two types of frequency-related renal artery variations described: accessory renal arteries and aberrant renal arteries. The renal artery origin also varies in morphology and togography with variation in the angle and vertebral level at which it branches from the abdominal aorta, respectively.
Examples of Phenotypic Variation
Frequency phenotypes: Accessory and aberrant renal arteries differ by the location where the vessel terminates to enter the kidney. Both accessory and aberrant renal arteries arise from either the abdominal aorta or the ‘main’ renal artery itself. Accessory renal arteries then terminate with the ‘main’ renal artery at the hilum in contrast to aberrant renal arteries that terminate at the superior or inferior poles of the kidney.
Phenotype Challenge
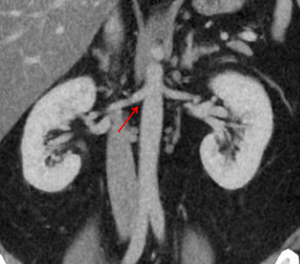
Using the phenotypic description of variant renal arteries above, describe and classify each patient’s renal artery morphology on the right and left sides (as indicated on each card) in this coronal view computed tomography (CT) arteriogram.
[Card 1 and 2 courtesy of Najibullah Rasouly, Radiopaedia.org, rID: 52292; Card 3 Case courtesy of Ivelin Vaskov, Radiopaedia.org, rID: 66357; Card 4 and 5 courtesy of Safwat Mohammad Almoghazy, Radiopaedia.org, rID: 54361; Card 6 courtesy of Roberto Schubert, Radiopaedia.org, rID: 17245 CC-BY-SA 3.0]
Population Frequencies of Phenotypic Variation
| Source | Smith et al. (2023; under review) | Tardo et al. (2017) | Holden et al. (2005) | Johnson et al. (2013) | Gümüs et al. (2011) | Budhiraja et al. (2013) | Ogeng’o et al. (2010) | |
| Number of participants | 302 | 300 | 100 | 302 | 820 | 37 | 178 | |
| Population | Australian – Queensland | Australian – Victoria | New Zealand | Jamaican | Turkish | Indian | Kenyan | |
| Multiple renal arteries (%) | 19.5% | 22% | 25%a | 36.1% | 27% | 47% | 14.3% | |
| Of the multiple vessels present: | ||||||||
| Accessory artery (%) | 90.3% | 48.7% | 8% | 41% | Not specified. | 46% | 50% | |
| Aberrant artery (%) | 9.7% | 51.3% | 92% | 59% | 54% | 50% | ||
a. data presented as percentage of kidneys with accessory arteries, not individuals.
Australian and New Zealand Context
As you can see from the table above, renal artery anatomy is highly variable between populations. In an Australian population, it has been shown that 19.5-22% of individuals, depending on their age, may have accessory or aberrant renal artery anatomy (Smith et al., 2023 under review; Tardo et al., 2017). One study conducted in 2017, investigated anatomical variation of the renal artery vasculature in a Victorian adult Australian population (Tardo et al., 2017). The investigation of both cadaveric specimens and computed tomography images identified that 22% of individuals (n=300) presented with multiple renal arteries. The presence of a single accessory renal artery was the most common phenotype (93.1%) with phenotypes of two and three accessory arteries presenting in lesser frequencies (Tardo et al., 2017). Researchers identified that unilateral variations (16.7%) were significantly more common than bilateral variations (3.4%) and that variant anatomy was significantly more prevalent in males (27.2%) compared to females (15.2%). Of the multiple renal arteries, a similar percentage were defined as accessory arteries (48.7%) compared to aberrant arteries (51.3%).
A more recent study, conducted by Smith et al. (2023 under review), however, reported a significantly higher number of accessory renal arteries compared to aberrant renal arteries. Smith et al. (2023 under review) investigated variant renal artery anatomy within a Queensland Paediatric population; reporting that 19.5% of individuals (n=59) presented with variant renal anatomy. Smith et al. (2023 under review) further reports high variation in the vertebral level of the right and left renal arteries. Whilst textbooks report that the renal arteries typically branch from the abdominal aorta at L1, research indicates a significant age-dependent shift in topography such that whilst 77.8% of left renal arteries in children under the age of 7 years arise at L1, only 48.8% of left renal arteries in individuals aged over 15 years arise at L1, with the remainder arising more inferior at the intervertebral disc between L1 and L2 (22.3%) or L2 (26.1%). Interestingly no significant age effect was observed in the right renal artery (Smith et al., 2023 under review), however significant variation in vertebral level was observed between individuals with only 59.6% of right renal arteries arising at L1 across the sample. No sex differences were observed in the vertebral level of the renal artery origin in this Australian study (Smith et al., 2023 under review).
The renal artery angle of origin is measured between the abdominal aorta and the inferior margin of the renal artery. Significant asymmetry in the right and left renal artery angles of origin has been observed in a Queensland Australian paediatric sample with a mean right angle of 59.05º and left angle of 73.8° (Smith et al., 2023 under review). The angle of origin of the right renal artery was also observed to significantly decrease with age in a sample of 0 to 24 year olds. The angle of origin of the left renal artery demonstrated significant sex differences with males having greater angles than females (Smith et al., 2023 under review).
Case Study on Renal Arteries: Percutaneous transluminal angioplasty
A 15 year old male patient presents with right renal artery stenosis (narrowing of blood vessel) due to fibromuscular dysplasia. The vascular surgeon has recommended percutaneous transluminal angioplasty to treat this condition to restore oxygenated blood flow to the kidney. Radiographic analysis of the patient’s right renal artery indicates a renal artery angle of origin of 65°.
Percutaneous transluminal angioplasty is a minimally invasive procedure where a balloon is introduced into the narrowed vessel via a catheter and inflated to widen the artery lumen. This procedure may be followed by stenting (inserted a mesh tube into the vessel) or atherectomy (removal parts of a plaque along the vessel wall) to improve patient outcomes. The catheter may be introduced via a retrograde approach where it enters the femoral artery or via an antegrade approach where it enters the brachial artery, to reach the renal artery.
QUESTION 1: Review the course of the catheter via the femoral artery and brachial artery to access the right renal artery. Draw a flowchart to demonstrate the blood vessels the catheter would pass through in each procedure.
QUESTION 2: In what circumstances would you perform a retrograde versus an antegrade procedure for renal artery angioplasty? Refer to the summary above of the study by Smith et al. (2023; under review) to examine the following related questions.
- In terms of the patient’s angle, would you recommend a retrograde or antegrade approach for catheterisation? Justify your answer.
- Does the sex of the patient influence the procedural approach?
- Does the age of the patient influence the procedural approach?
References and Further Reading
Budhiraja, V., Rastogi, R., Anjankar, V., Babu, C. S. R., & Goel, P. (2013). Supernumerary Renal Arteries and Their Embryological and Clinical Correlation: A Cadaveric Study from North India. International Scholarly Research Notices Anatomy, 2013, 405712–405714. https://doi.org/10.5402/2013/405712
Gümüş, H., Bükte, Y., Özdemir, E., Çetinçakmak, M. G., Tekbaş, G., Ekici, F., Önder, H., & Uyar, A. (2012). Variations of Renal Artery in 820 Patients Using 64-Detector CT-Angiography. Renal Failure, 34(3), 286-290. https://doi.org/10.3109/0886022X.2011.647295
Holden, A., Smith, A., Dukes, P., Pilmore, H., & Yasutomi, M. (2005). Assessment of 100 live potential renal donors for laparoscopic nephrectomy with multi-detector row helical CT. Radiology, 237(3), 973–980. https://doi.org/10.1148/radiol.2373041303
Johnson, P. B., Cawich, S. O., Shah, S. D., Aiken, W., McGregor, R. G., Brown, H., & Gardner, M. T. (2013). Accessory renal arteries in a Caribbean population: a computed tomography based study. SpringerPlus, 2(1), 1–5. https://doi.org/10.1186/2193-1801-2-443
Ogeng’o, J. A., Masaki, C. O., Sinkeet, S. R., Muthoka, J. M., & Murunga, A. K. (2010). Variant anatomy of renal arteries in a Kenyan population. Annals of Transplantation, 15(1), 40-45.
Smith, T., Reynolds, M.S. and Gregory, L.S. (2023; under review) Interindividual sex and age-specific variation in renal artery location, angle and size.
Tardo, D. T., Briggs, C., Ahern, G., Pitman, A., & Sinha, S. (2017). Anatomical variations of the renal arterial vasculature: An Australian perspective. Journal of Medical Imaging and Radiation Oncology, 61(5), 643–649. https://doi.org/10.1111/1754-9485.12618
