9 2022 Student Case Reports
Overview
Students in the Bachelor of Biomedical Science at the Queensland University of Technology, Australia have the opportunity to perform a full human donor dissection in their final semester of study. As part of their learning activities and assessment, students investigate the phenotypic variation of a wide range of structures across multiple organ systems by accurately describing the phenotypes observed in the donor and their population incidence based on published primary literature through both gross inspection of the donor body and image interpretation of the computed tomography scans of the donor. Students then select one organ or structure to investigate anatomical variation in more detail. This is presented as a summative assessment task, as described below. The highest quality anatomical variation student reports are presented in this chapter. All students have given written permission[1] to include their work into this Open Educational Resource.
Anatomical Variation Case Report (extract from student assessment task sheet, LQB670 Anatomical Dissection, QUT 2022)
Describe the phenotype of the anatomical variant using appropriate anatomical terminology – appearance (morphological description from macroscopic appearance and/or imaging appearance) and anatomical location. Include at least one diagram of the phenotype of your donor compared to other phenotypes reported in the literature. The most frequent phenotypes should be presented in this diagram with a minimum of 3 phenotypes to be included. This diagram should be in the form of an illustrative schematic. All figures should have clear headings and be referred to in the text.
Research your anatomical variant – what is the population frequency, is it sexually dimorphic, does it have any functional consequences in the patient, possible causes of variant (if applicable). Ensure you include a description of the other phenotypic variations of the organ (ie. What is the range of variation typical of this organ and what are these other phenotypes?); this should be concise as the focus is on your donor’s variant. Use primary research literature (at least three articles) to extend knowledge on the variant using APA referencing style.
Present your case of variability as a succinct professional report similar to a journal case study. You should not exceed 750 words for this section and a maximum of 2 pages including all figures (12 point font; 2cm margins). A minimum of 3 figures is required: one illustration of your donor’s phenotypic variation; one demonstrating examples of other phenotypes demonstrated across the population; and one showing population statistics such as a table or graph of incidence or population variation.
Aortic Arch
Author: Mahin Alam (2022)
Donor number 5825 presented an aortic arch located within the mediastinum, arising from the ascending aorta and travelled posteriorly over the left of the anterior surface of the trachea. It continued superiorly to the manubrium of the sternum, and curves around the hilum of the left lung. It descended posteriorly to the left of the fourth thoracic vertebra, continuing as the descending aorta. The aortic arch displayed a branching pattern typical of the bovine arch where the brachiocephalic trunk (which bifurcates into the right common carotid and right subclavian arteries) and the left common carotid artery shared a common origin. The left subclavian artery originates from the aortic arch (Standring et al., 2022). This can be seen in figure 1.
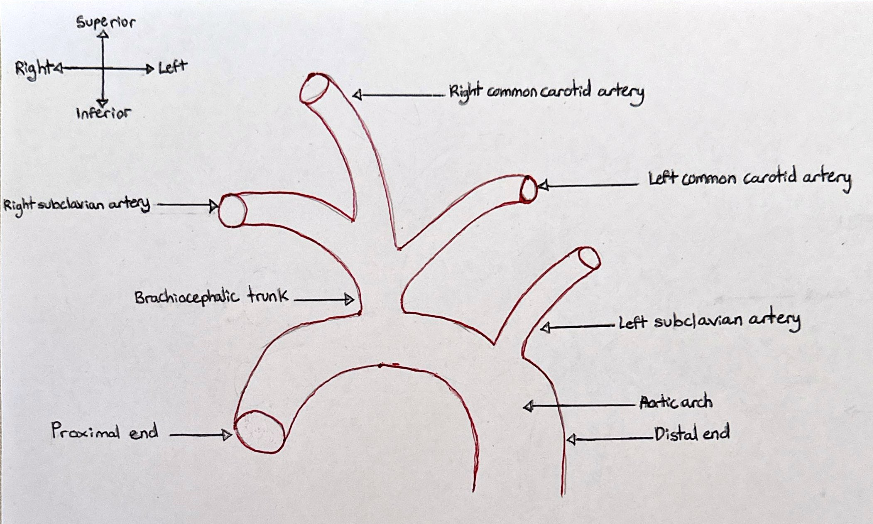
Figure 1: A coronal view of the bovine arch branching pattern phenotype present in donor 5825. [Image: © M. Alam 2022. Reproduced with permission]
The bovine arch is not the most frequently occurring aortic arch variation. A 2015 study reviewed computed tomography (CT) images of 817 adult patients residing in America to investigate the prevalence of the bovine arch. The results showed that 122 patients (14.9% of the population) featured a bovine arch (Moorehead et al., 2016). Similarly, a 2012 study in Serbia found that 15.56% of 1,265 patients presented a bovine arch (Vučurević et al., 2013). A 2016 study in China focused on the morphologic features of the aortic arch branching patterns and found that 229 patients (9.6%) from the total 2370 showed bovine arch branching patterns (Wang et al., 2016). Similarly, a 2012 found that 7.8% of the 1001 patients from a Turkish population displayed branching patterns indicative of a bovine arch (Ergun et al., 2012). Table 1 shows a summary of the findings from different studies.
Table 1: Summary of bovine arch prevalence in different sample sizes and countries from different studies.
| Studies (first author) | Country | Sample size | Bovine arch prevalence |
| (Moorehead et al., 2016) | America | 817 | 14.9% |
| (Vučurević et al., 2013) | Serbia | 1265 | 15.56% |
| (Wang et al., 2016) | China | 2370 | 9.6% |
| (Ergun et al., 2012) | Turkey | 1001 | 7.8% |
The bovine arch branching pattern is not sexually dimorphic. One study found 254 out of the total 2370 patients had a bovine arch, specifically 119 males and 126 females (Wang et al., 2016). However, another study focusing on a Japanese population found that 141 out of the 2352 patients had a bovine arch, specifically 71 males and 70 females (Uchino et al., 2012). Another study found that out of the total 1000 patients included (610 male and 390 female), the bovine arch variation was found in 86 males and 55 females (Karacan et al., 2013), but the sample size for this study was smaller than the other 2 studies. However, the bovine arch appears to be prevalent in certain races. A study found that 41% of patients with a bovine arch were of black race with the remainder being of white race, Hispanic race or other (Moorehead et al., 2016), corroborating with findings from other studies (DeGaris, 1994; McDonald & Anson, 1940).
Patients with the bovine arch are linked to other heart conditions. A 2012 study investigated the correlation between bovine arch and thoracic aortic disease, by analysing CT and MRI scans of 612 patients with thoracic aortic disease and 844 patients without thoracic aortic disease. The results found 26.3% of thoracic aortic disease patients had a bovine arch as opposed to 16.4% of the patients without thoracic aortic disease (Hornick et al., 2012). Similarly, another study investigated if aortic arch branching patterns impact cardioembolic stroke laterality. The results found that from the total 615 patients, a bovine arch was linked to left stroke distribution the most by 51.3% (98 patients) (Matakas et al., 2020). There is no confirmed cause of the bovine arch. A possible cause could be the underdevelopment of the aortic sac during foetal development (approximately days 26-30 days) (Meyer et al., 2019). Another possible cause of the bovine arch could be heritability. A 2022 study found the bovine arch had a 53% prevalence rate in relatives with chest imaging and concluded that the bovine arch was highly heritable in the sample population (Shang et al., 2022).
Different aortic arch variations exist. A study found 74.72% of patients have an aortic branching pattern of 3 great vessels: the brachiocephalic trunk (bifurcating into the right common carotid and subclavian arteries) and both the left common carotid artery and subclavian artery (Wang et al., 2016). This finding corroborated with other studies (Ergun et al., 2012; Karacan et al., 2013). There is also a 4-vessel branching pattern consisting of both the right and left common carotid arteries and both the right and left subclavian arteries, with the right subclavian artery as a distal aortic branch. This variation occurred in 7 patients out of the 1266 patients in one study (Vučurević et al., 2013), which corroborated with another study (Ergun et al., 2012). Another variation displays the brachiocephalic trunk (bifurcating into the right common carotid and subclavian arteries) and both the left common carotid and subclavian arteries. However, the left vertebral artery originates between the left common carotid artery and subclavian artery. This variation was found in approximately 3.63% of the population used in a study (Vučurević et al., 2013). Figure 2 displays different aortic branching pattern phenotypes observed in studies.
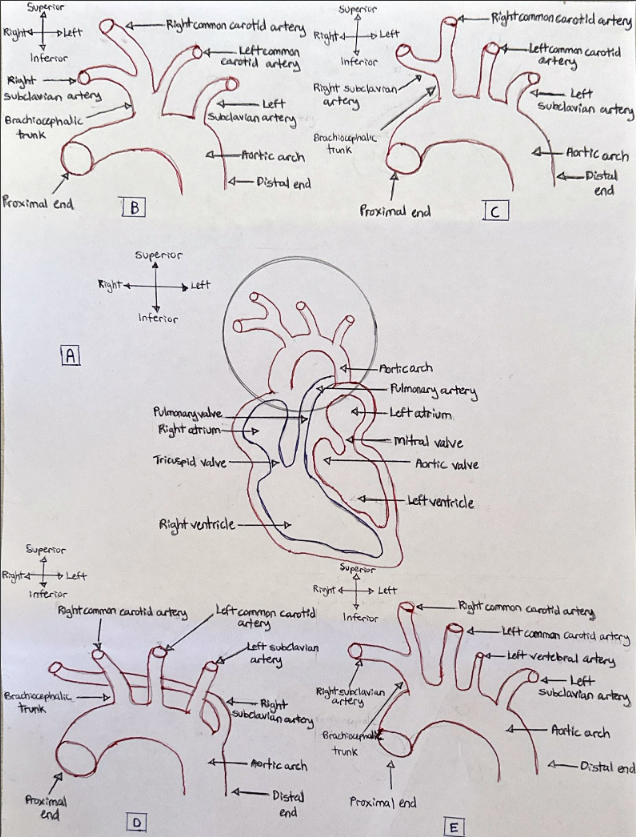
Figure 2: A coronal view of various aortic arch branching pattern phenotypes. (A): The aortic arch (circled in black) in relation to its supporting structures. The circled area is the specific area the various phenotypes occur. (B): The bovine arch phenotype. (C): The most frequently occurring phenotype. (D): 4-vessel branching phenotype. (E): The left vertebral artery phenotype. [Image: © M. Alam 2022. Reproduced with permission].
References
DeGaris, C. (1994). Patterns of branching of the subclavian artery in white and negro stocks. American Journal Of Physical Anthropology, 7(1), 95-107. https://doi.org/10.1002/ajpa.1330070116
Ergun, E., Şimşek, B., Koşar, P., Yılmaz, B., & Turgut, A. (2012). Anatomical variations in branching pattern of arcus aorta: 64-slice CTA appearance. Surgical And Radiologic Anatomy, 35(6), 503-509. https://doi.org/10.1007/s00276-012-1063-3
Hornick, M., Moomiaie, R., Mojibian, H., Ziganshin, B., Almuwaqqat, Z., & Lee, E. et al. (2012). ‘Bovine’ Aortic Arch – A Marker for Thoracic Aortic Disease. Cardiology, 123(2), 116-124. https://doi.org/10.1159/000342071
Karacan, A., Türkvatan, A., & Karacan, K. (2013). Anatomical variations of aortic arch branching: evaluation with computed tomographic angiography. Cardiology In The Young, 24(3), 485-493. https://doi.org/10.1017/s1047951113000656
Matakas, J., Gold, M., Sterman, J., Haramati, L., Allen, M., Labovitz, D., & Slasky, S. (2020). Bovine Arch and Stroke Laterality. Journal Of The American Heart Association, 9(13). https://doi.org/10.1161/jaha.119.015390
McDonald, J., & Anson, B. (1940). Variations in the origin of arteries derived from the aortic arch, in American whites and negroes. American Journal Of Physical Anthropology, 27(1), 91-107. https://doi.org/10.1002/ajpa.1330270129
Meyer, A., Turek, J., Froud, J., Endelman, L., Cavanaugh, N., Torres, J., & Ashwath, R. (2019). Insights into Arch Vessel Development in the Bovine Aortic Arch. Pediatric Cardiology, 40(7), 1445-1449. https://doi.org/10.1007/s00246-019-02156-6
Moorehead, P., Kim, A., Miller, C., Kashyap, T., Kendrick, D., & Kashyap, V. (2016). Prevalence of Bovine Aortic Arch Configuration in Adult Patients with and without Thoracic Aortic Pathology. Annals Of Vascular Surgery, 30, 132-137. https://doi.org/10.1016/j.avsg.2015.05.008
Shang, M., Vinholo, T., Buntin, J., Zafar, M., Ziganshin, B., & Elefteriades, J. (2022). Bovine Aortic Arch: A Result of Chance or Mandate of Inheritance?. The American Journal Of Cardiology, 172, 115-120. https://doi.org/10.1016/j.amjcard.2022.02.030
Standring, S., Anand, N., & Tunstall, R. (2022). ClinicalKey. Clinicalkey.com.au. Retrieved 14 September 2022, from https://www.clinicalkey.com.au/#!/content/book/3-s2.0-B9780702077050000586?scrollTo=%23hl0000180.
Uchino, A., Saito, N., Okada, Y., Kozawa, E., Nishi, N., & Mizukoshi, W. et al. (2012). Variation of the origin of the left common carotid artery diagnosed by CT angiography. Surgical And Radiologic Anatomy, 35(4), 339-342. https://doi.org/10.1007/s00276-012-1038-4
Vučurević, G., Marinković, S., Puškaš, L., Kovačević, I., Tanasković, S., Radak, D., & Ilić, A. (2013). Anatomy and radiology of the variations of aortic arch branches in 1,266 patients. Folia Morphologica, 72(2), 113-122. https://doi.org/10.5603/fm.2013.0019
Wang, L., Zhang, J., & Xin, S. (2016). Morphologic features of the aortic arch and its branches in the adult Chinese population. Journal Of Vascular Surgery, 64(6), 1602-1608.e1. https://doi.org/10.1016/j.jvs.2016.05.092
Coeliac Trunk
Author: Meri Kallinen (2022)
The coeliac trunk, like many blood vessels, has many different anatomical variations. It is located posterior to the stomach and usually superior to the pancreas, and it most typically presents as a collateral branch from the abdominal aorta at approximately the level of the intervertebral disc between T12 and L1, with a terminal trifurcation into the left gastric, common hepatic, and splenic arteries. In addition to this pattern, multiple other variations of the coeliac trunk have been found.
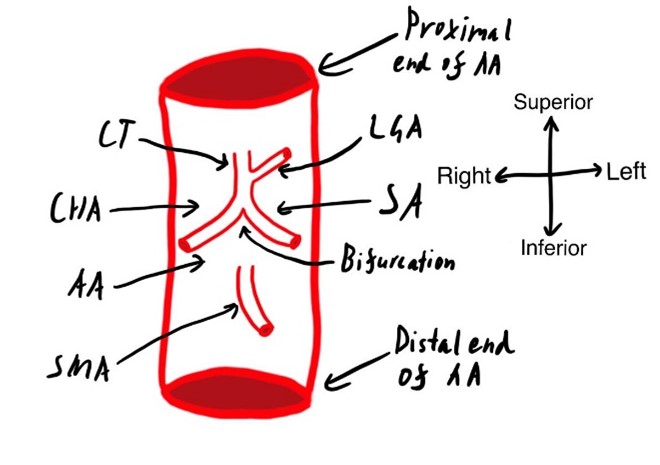
Many classifications of the variations have been described, but for this case study, the Panagouli classification will be used (Panagouli et al., 2013) as it combines many studies and defines the largest number of variations. The case in question exhibited a variation known as type 1, form 2a, which has been found to have an incidence of 6% in an Indian population (Koshariya et al., 2021). This branching pattern refers to the left gastric artery branching off more proximally from the coeliac trunk than the splenic and common hepatic arteries, which then form its termination as a bifurcate, shown in Figure 1. In this donor the left gastric artery branches off approximately 1cm proximally from the bifurcation.
Type 1 refers to the typical three vessels branching from the coeliac trunk, while the form (1 or 2) describes if it is ‘true’ or ‘false’ trifurcation (Panagouli et al., 2013). When the trifurcation is ‘true’, all three form the termination of the coeliac trunk. When it is ‘false’, one of the three vessels branches more proximally than the others. True trifurcations (type 1, form 1) have been found at frequencies ranging from 7.1% up to 76% in different populations (Juszczak et al., 2021; Koshariya et al., 2021; Pinal-Garcia et al., 2018; Venieratos et al., 2013), however are generally regarded as the most common phenotype. False trifurcations have been found to range from 6% to 64%, again depending on the population studied, including Indian, Mexican, Polish, and Greek populations (Juszczak et al., 2021; Koshariya et al., 2021; Pinal-Garcia et al., 2018; Venieratos et al., 2013). Some other phenotypes are shown in Figure 2, have also been classified, typically with much lower frequencies, including a bifurcating coeliac trunk with one of the three vessels branching directly from the aorta instead, as well as a combined hepatosplenic and gastromesenteric trunk, and the absence of the coeliac trunk entirely (Panagouli et al., 2013). These variations, along with other abdominal aorta variation, are thought to arise during foetal development due to differences in the ventral segmental arteries (Koshariya et al., 2021)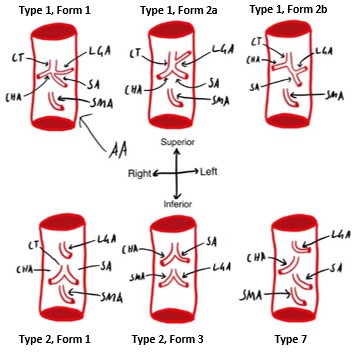
Figure 2: Variations of the Coeliac trunk. Classified using Panagouli classification (Panagouli et al., 2013). Showing abdominal aorta (AA), coeliac trunk (CT), left gastric artery, (LGA), common hepatic artery (CHA), splenic artery (SA), superior mesenteric artery (SMA). [Image: © M. Kallinen 2022. Reproduced with permission]
In general, discrepancies between the population frequencies for coeliac trunk variants can be attributed to ancestry. From the systematic review performed by Panagouli et al. (2013), a statistically significant difference was found that showed that both Japanese and Korean populations exhibited a lower proportion of trifurcated (type 1) phenotypes compared to Caucasian populations (Panagouli et al., 2013). Regarding other studies, one focused on the Mexican population found a lower prevalence of type 1 phenotypes than other studies (43.6%), but with a higher proportion of form 2 to form 1 phenotypes: 36.4% to just 7.1% (Pinal-Garcia et al., 2018). The opposite was reported in a Greek population, with type 1 dominating the variations (90.1%) (Venieratos et al., 2013).
Table 1: Population percentages of Coeliac trunk type 1 and 2 variations
| Study | Population | Type 1, Form 1 | Type 1, Form 2 | Type 2 |
| (Koshariya et al., 2021) | Indian | 76% | 12% | 10% |
| (Pinal-Garcia et al., 2018) | Mexican | 7.1% | 36.4% | 7.1% |
| (Juszczak et al., 2021) | Polish | 16.4% | 65.6% | 16.67% |
| (Venieratos et al., 2013) | Greek | 74% | 16.9% | 1.3% |
Multiple studies have found no significant sexual dimorphism in coeliac trunk variation frequencies (Panagouli et al., 2013; Venieratos et al., 2013). Overall, variations of the coeliac trunk have no direct functional consequences but are important to account for in procedures such as liver transplants, pancreatoduodenectomies, and catheterisation of the coeliac trunk (Juszczak et al., 2021; Panagouli et al., 2013). Being aware of the variability in the coeliac trunk would improve general preparedness for surgeries conducted in that region.
References
Juszczak, A., Mazurek, A., Walocha, J. A., & Pasternak, A. (2021). Coeliac trunk and its anatomic variations: a cadaveric study. Folia Morphologica, 80(1), 114-121. https://doi.org/10.5603/FM.a2020.0042
Koshariya, M., Khare, V., Songra, M. C., Shukla, S., & Gupta, A. (2021, Oct). Anomalous Anatomical Variations of Coeliac Trunk: A Cadaveric Study. Cureus, 13(10), e19108. https://doi.org/10.7759/cureus.19108
Panagouli, E., Venieratos, D., Lolis, E., & Skandalakis, P. (2013, Dec). Variations in the anatomy of the celiac trunk: A systematic review and clinical implications. Ann Anat, 195(6), 501-511. https://doi.org/10.1016/j.aanat.2013.06.003
Pinal-Garcia, D. F., Nuno-Guzman, C. M., Gonzalez-Gonzalez, M. E., & Ibarra-Hurtado, T. R. (2018, Apr). The Celiac Trunk and Its Anatomical Variations: A Cadaveric Study. J Clin Med Res, 10(4), 321-329. https://doi.org/10.14740/jocmr3356w
Venieratos, D., Panagouli, E., Lolis, E., Tsaraklis, A., & Skandalakis, P. (2013, Sep). A morphometric study of the celiac trunk and review of the literature. Clin Anat, 26(6), 741-750. https://doi.org/10.1002/ca.22136
Ascending Colon
Author: Laura Barrett (2022)
Phenotype Present in Donor:
The ascending colon within the cadaver investigated (Donor 5803) had a secondarily retroperitoneal attachment. The colon was immediately visible upon the opening of the peritoneal cavity of the cadaver. The colon has a typical tubular shape and was a neutral pink colour. The inferior aspect of the colon arose from the cecum and the most superior aspect connects with the proximal transverse colon. The colon in this donor was completely adhered to the right aspect of the posterior abdominal wall, with no visible mesentery.
The computed tomography (CT) images of the abdomen of the donor further confirmed the secondarily retroperitoneal nature of the ascending colon. The colon, which is visualised as a semi radiopaque tubular structure with radiolucent spots throughout, appears closely adhered to the abdominal wall in both axial and coronal views. Using RadiANT DICOM Viewer 2022, the colon was estimated to be approximately 17 centimetres in length.
Population Frequency of Variation:
Whilst the ascending colon is traditionally considered a secondarily retroperitoneal organ, this phenotype is only one of the possible attachment variations of the colon. The adherence of the colon to the abdominal wall is attributed to the embryological development of the human midgut. During embryological development, after the ascending colon has formed and is in its correct anatomical position, the colon begins to retract into the abdomen (Phillips et al., 2015). The mesentery of the ascending colon then begins to degenerate and fuse with the peritoneum. As a result, the posterior portion of the colon lies posterior to the peritoneum, leading to the classification as a secondarily retroperitoneal organ. This fusion fixes the colon in place and prevents the mobility of the organ. A conceptualised illustration of this phenotype can be seen in Figure 1.
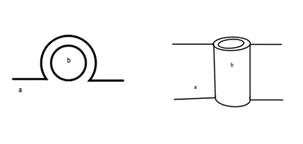
Figure 1: Left: A cross-sectional view of the attachment of the ascending colon (a) to the peritoneum (b). Right: A conceptualised anterior view of the attachment of the ascending colon (a) to the peritoneum (b). [Image: © L.Barrett 2022. Reproduced with permission]
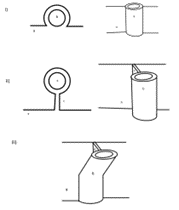
Figure 2: Conceptualised illustrations of the i) secondarily retroperitoneal phenotype, the ii) persistent congenital mesocolon phenotype and iii) the partially mobile mesocolon phenotype. These images demonstrate the relationship between the peritoneum (a), the ascending colon (b) and the mesentery of the ascending colon (c). [Image: © L.Barrett 2022. Reproduced with permission]
This phenotype is present in 34% of the population of an English population in accordance with studies conducted by Phillips et al. (2015). The study found that in a group of 48 human cadavers, 66% of the group had mobile portions of the ascending colon, implying only 34% population frequency of a secondarily retroperitoneal ascending colon. Interestingly, the study also found statistically significant sexual dimorphism, as females within the study were significantly more likely to have a mobile portion of the ascending colon. This phenotype has no functional consequences on the individual.
Varied embryological development can often result in a range of different phenotypes of structures. In the case of the ascending colon, there are two other distinct phenotypes that have been identified within the available literature. One of the more prominent variations is the partial mobility of the proximal portion of the ascending colon, as illustrated in Figure 2iii. The study conducted by Phillips et al (2015) found that in 66% of the cadavers studied had this phenotype, with a distinct portion of the proximal ascending colon being attached to the peritoneum via mesentery (Phillips et al., 2015).
A rare variation exists in which the mesentery of the ascending colon exists in its entirety, a condition which is termed as persistent congenital mesocolon, as illustrated in Figure 2ii. In a Japanese population, this phenotype was found to have a 3.6% frequency based on a study of 110 patients (Takahashi et al., 2019). Similarly, a fully mobile ascending colon was found to have occurred in 3.3% of an Indian population, based on the results of a study conducted on 32 cadavers (Sar et al., 2021). The current available literature regarding these phenotypes is summarised in Table 1.
Table 1: Summary of ascending colon mesentery variation population frequencies available in current literature.
| Ascending Colon Phenotype | Population Frequency | Population Details | Article Authors |
| Secondarily Retroperitoneal Attachment | 34% (based off results of Phillips et al.) | 48 British Cadavers | Phillips et al., 2015 |
| Partially Mobile Mesocolon | 66% | 48 British Cadavers | Phillips et al., 2015 |
| Persistent Congenital Mesocolon | 3.6% | 110 Japanese laparoscopy patients | Takahashi et al., 2019 |
| Persistent Congenital Mesocolon | 3.4% | 32 Indian Cadavers | Sar et al., 2021 |
References
Phillips, M., Patel, A., Meredith, P., Will, O., & Brassett, C. (2015). Segmental colonic length and mobility. Annals of the Royal College of Surgeons of England, 97(6), 439–444. https://doi.org/10.1308/003588415X14181254790527
Sar, M., Singh, S., Bara, D. P. ., Behera, S., Baa, J. ., & Mishra, S. K. . (2021). Morphological Variants of Colon: A Cadaveric Study. International Journal of Health and Clinical Research, 4(5), 350–355. Retrieved from https://ijhcr.com/index.php/ijhcr/article/view/1201
Takahashi, H., Tanaka, N., Takayama, O., Baba, M., Murata, M., Yamamoto, M., & Hiratsuka, M. (2019). Persistent descending mesocolon as a risk factor of laparoscopic surgery for colorectal cancer: A single institution experience. International Surgery, 104(9-10), 439–445. https://doi.org/10.9738/intsurg-d-16-00085.1
Os Naviculare
Author: Tejas Bhat (2022)
Anatomical variations are differences in topography, morphology, frequency, or developmental timing of anatomical structures. They develop during embryological or subadult development and don’t have significant impact on an individual’s ability to function. Variations in anatomy are important to understand as they may be mistaken for abnormalities or pathologies in a clinical setting. In the case of skeletal development, variations in secondary ossification centres have been mistaken for fractures and its associated fragments (Feldman et al., 1970).
A bone window axial computer tomography (CT) of donor 5803 (84-year-old male) highlighted that an accessory bone is present posteromedial to the left navicular bone; this is known as an accessory tarsal navicular bone (os naviculare). This structure is located contralaterally to the cuboid bone and is the most medial bone in the pedal region. The bone appears as a triangular/heart shaped radiopaque structure with the approximate dimensions of 8.16 mm at its widest, and 136 mm at its longest. Note that the measurements were made using the in-built measuring tool in RadiAnt DICOM viewer, and the accuracy of the dimensions are heavily reliant on the resolution of the CT scan.
There are three classifications for os naviculare based on morphology – see Figure 1. Type I os naviculare is the presence of a round/oval sesamoid bone located in the distal posterior tendon of the tibia as it passes adjacent to the posteromedial tubercle of the navicular bone; as this accessory bone is in the tendon itself, it can be separated by up to 5 mm and makes up 30% of cases (Nwawka et al., 2013). Type II occurs due to the incomplete fusion of a secondary ossification centre with the navicular bone, resulting in joining via synchondrosis anywhere from 1-2 mm away from the navicular bone. Type II constitutes 50% of os naviculare cases (Nwawka et al., 2013). Type II is categorised further into type IIa, in which the accessory bone connected to the navicular bone at a less acute angle, and type IIb, in which the accessory bone is connected to the navicular more inferiorly (Ng et al., 2022). Type III os naviculare is the partial fusion of a secondary ossification centre, resulting in the appearance of a large tuberosity on the posteromedial aspect of the navicular bone; these account for 20% of cases (Nwawka et al., 2013). From these classifications listed, Donor 5803 appears to have a unilateral type IIa os naviculare in the left foot – see Figure 2.
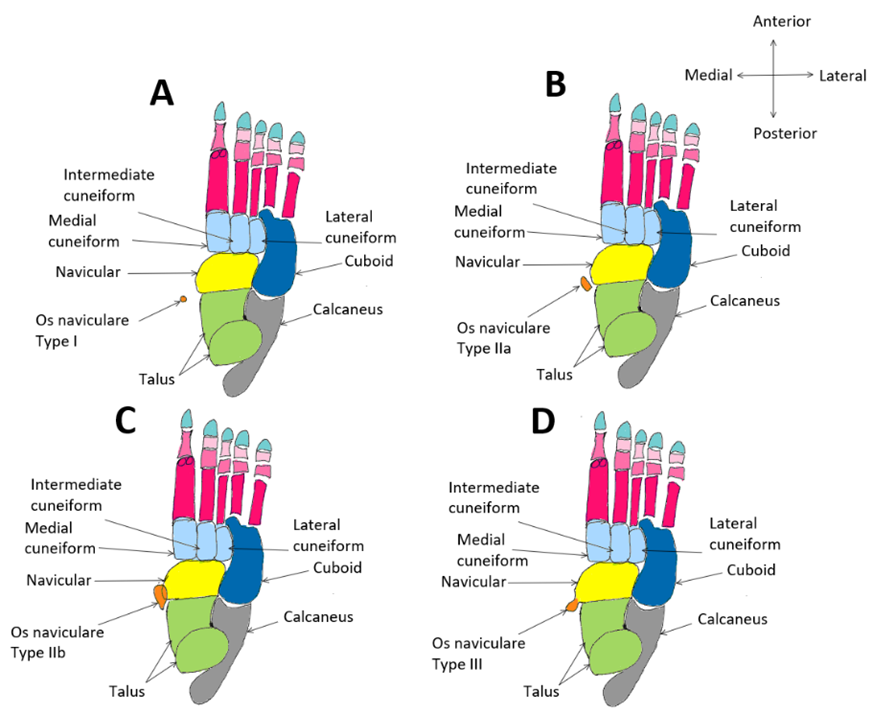
Figure 1: Diagram of os naviculare classifications in the left foot from an inferior view. A: Type I with sesamoid bone in the distal posterior tibial tendon. B: Type IIa caused by non-fusion of secondary ossification centre resulting in synchondrosis. C: Type IIb caused by non-fusion of secondary ossification centre inferior to the posteromedial aspect of cuneiform. D: Type III os naviculare caused by partial fusion of secondary ossification centre resulting in the appearance of a large tuberosity on the navicular bone. [Image: © T. Bhat 2022. Reproduced with permission]
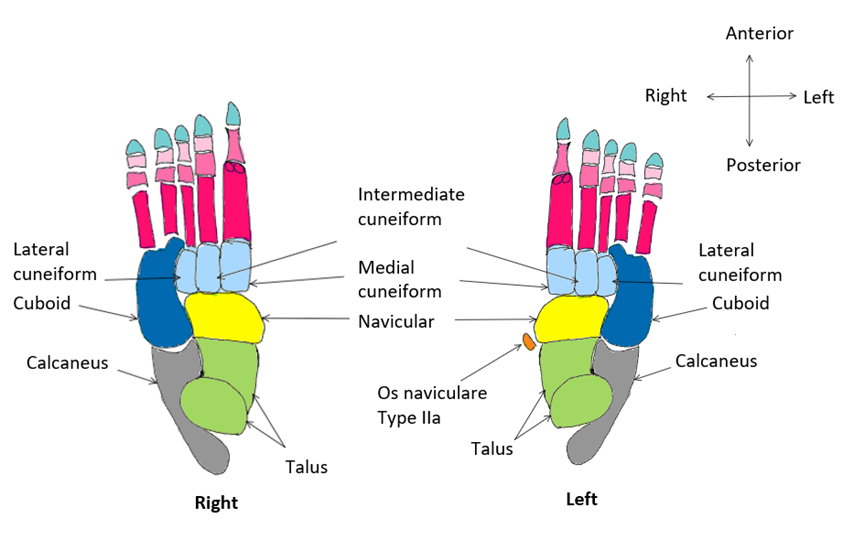
Figure 2: Diagram of Donor 5803’s feet (from an inferior view) with a Type IIa os naviculare posteromedial to the navicular bone on the left side. This accessory bone is unilateral and therefore not present in the right foot. [Image: © T. Bhat 2022. Reproduced with permission]
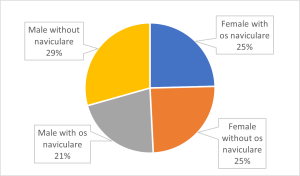
One of the most recent studies conducted on os naviculare found that in a population of 439 Asian participants (of Chinese, Malay, Indian, and Eurasian decent), 46.0% had an asymptomatic accessory navicular bone, with 76.7% of cases of os naviculare occurring bilaterally (Ng et al., 2022). When observing for sexual dimorphism, of the 291 Chinese participants, 54.3% of females and 45.7% of males presented with os naviculare – therefore, females appear more likely to present with this phenotype. This pattern is congruent with the Malay (46.5% females and 39.6% males) and Indian (33.3% female and 30% male) ethnic groups (Ng et al., 2022). Remaining ethnic groups did not follow the trend as perhaps the sample size was too small for the Eurasian (n=5) and Others (n=9) sub groups (Ng et al., 2022). Figure 3 allows for visualisation of the comparison between total male and female incidence of os naviculare in the study (Ng et al., 2022). The figure suggests that os naviculare is more prevalent in the females of Asian descent compared to males of Asian descent.
While anatomical variation shouldn’t impact physiological function, some reports have been made regarding the correlation between people with type II os naviculare and foot pain in that region. Five of seven patients with confirmed type II os naviculare experienced pain in a study conducted in 1995 (Miller et al., 1995). This may be due to the os naviculare interfering with tendon function or even the proliferation of cartilage and bone remodelling at the interface between cartilage and bone which degenerates the synchondrosis (Lawson et al., 1984). Based on the variation in donor 5803, we might expect they experienced unilateral pain in the medial aspect of their left foot (Ng et al., 2022), as well as increasing likelihood of pain to present due to progressive symptoms over a period of time (Huang et al., 2014).
References
Feldman, F., Pochaczevsky, R., & Hecht, H. (1970). The Case of the Wandering Sesamoid and Other Sesamoid Afflictions. Radiology, 96(2), 275-283. https://doi.org/10.1148/96.2.275
Huang, J., Zhang, Y., Ma, X., Wang, X., Zhang, C., & Chen, L. (2014). Accessory navicular bone incidence in Chinese patients: a retrospective analysis of X-rays following trauma or progressive pain onset. Surg Radiol Anat, 36(2), 167-172. https://doi.org/10.1007/s00276-013-1158-5
Lawson, J. P., Ogden, J. A., Sella, E., & Barwick, K. W. (1984). The painful accessory navicular. Skeletal Radiol, 12(4), 250-262. https://doi.org/10.1007/BF00349506
Miller, T. T., Staron, R. B., Feldman, F., Parisien, M., Glucksman, W. J., & Gandolfo, L. H. (1995). The symptomatic accessory tarsal navicular bone: assessment with MR imaging. Radiology, 195(3), 849-853. https://doi.org/10.1148/radiology.195.3.7754020
Ng, W. L. S., Tan, T. J., Kam, J. W., & Mehta, K. (2022). The Incidence and Anatomic Variation of Os Naviculare in a Multiethinic Asian Population. J Foot Ankle Surg, 61(3), 456-458. https://doi.org/10.1053/j.jfas.2021.05.013
Nwawka, O. K., Hayashi, D., Diaz, L. E., Goud, A. R., Arndt, W. F., 3rd, Roemer, F. W., Malguria, N., & Guermazi, A. (2013). Sesamoids and accessory ossicles of the foot: anatomical variability and related pathology. Insights Imaging, 4(5), 581-593. https://doi.org/10.1007/s13244-013-0277-1
Sciatic Nerve
Author: Rebecca Nelson (2022)
In 1937, Beaton & Anson of Chicago’s Anatomical Laboratory of Northwestern University Medical School undertook a study of 120 cadavers with the help of their medical students. The aim of the study was to determine the various anatomical variations of the sciatic nerve (SN) with relation to the piriformis muscle (PM). In this landmark study, the anatomists found several variants of this sciatic nerve-piriformis relationship. This study then went on to be the reference point for all classifications of standard and variant SN anatomy for the better part of the next century. Three (3) of the classification types were more prevalent than the others and made up the bulk of the rates in the population at the time.
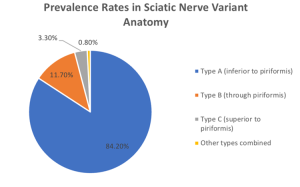
Type A was the most common occurring in 84.2% of subjects in their study, where the SN exits the greater sciatic foramen as one singular entity immediately inferior to the head of the PM (see figure 1 below). This variant is what is identified as textbook standard anatomy. The second most frequent variant is Type B with a prevalence of 11.7% in the North American population. This phenotype is characterised as a division in the SN forming the common peroneal nerve (CPN) superiorly and the SN inferiorly. The CPN, also known as the common fibular nerve, courses between the separated PM head, as though it is traversing through the piriformis, whereas the SN passes inferior to it (see figure 1). The third most prevalent classification is Type C which is found in 3.3% of the population. In this phenotype, the SN is divided into the CPN which exits the greater sciatic foramen superior to the PM head, whilst the SN passes inferior to it (see figure 1).
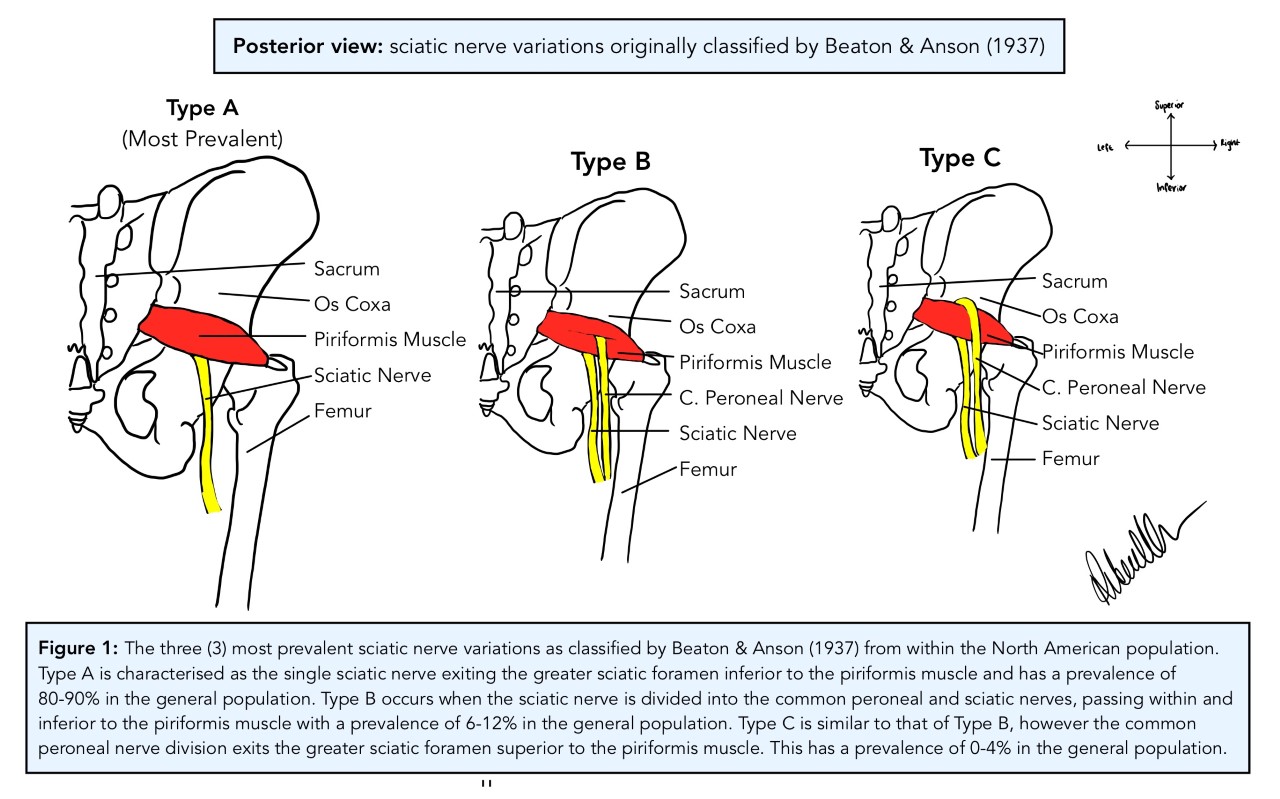
[Image: © R. Nelson 2022. Reproduced with permission]
Recently, several studies have attempted to confirm and validate those findings of Beaton & Anson from 1937. The question was asked: do these classification subtypes still hold true today and are they relevant to differing populations? Heavy emphasis was also placed on linking the variants of the anatomy to disease states such as sciatica and piriformis syndrome with conflicting results between studies (Bartret et al., 2018; Natsis et al., 2014; Varenika et al., 2017). In 2014, Natsis et al. dissected 147 embalmed cadavers over a 15-year period and determined that Type A was found in 89.8% of their Grecian population, whereas 6.1% of the population had Type B and 0.7% of the population had Type C. Interestingly, the researchers found 2% of the population, formed by three individual specimens withintheir study cohort, had variant anatomy outside of the Beaton & Anson (1937) classification system (p. 277). One specimen, for example, had a double PM head where the SN was divided into the CPN, passing between the superficial and deep muscle bellies of the PM, while the tibial nerve passed inferior to the PM as the SN would in other phenotypes (Natsis et al, 2014, p. 276). They, along with other researchers such as Jha & Baral (2020) also hypothesized that variant sciatic anatomy caused piriformis syndrome and sciatica. Despite the promising hypothesis, no medical data for the human donors for either study was available to researchers, preventing them from confirming the link they had made. A few years later in 2017, a team of researchers in San Fransisco, CA studied a series of 755 MRI scans and found that 87% of the patients had Type A sciatic nerve variation (Varenika et al., 2017). Whereas 13% of the population had the Type B variation and 0.26% had Type C.
In 2018, Bartret et al. surveyed 1039 MRIs in Stanford, CA and found that there was no statistical difference between rates of piriformis syndrome and sciatica with either Type A or variant SN anatomy, where the symptoms occurred in relatively equal amounts between anatomical groups. The causative link between SN variant anatomy and symptomatology has been found in smaller cohorts, but not in larger studies (Bartret et al., 2018). A definitive answer to this question has yet to be uncovered.
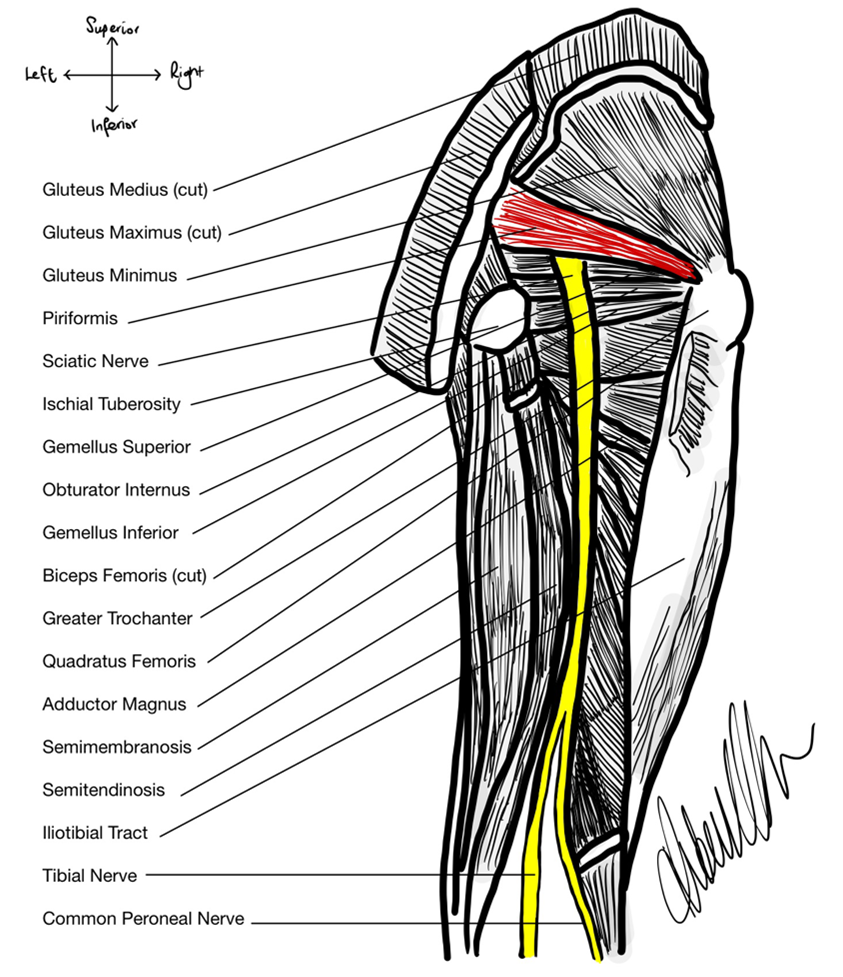
In Donor 5814, the SN anatomy is Type A, as depicted in figure 2. The donor had a very clear, pink cord-like SN around 15mm in diameter protruding from the greater sciatic foramen inferior to the muscle belly of the PM. The SN then travelled distally posterior to the external rotator muscle group consisting of the superior gemellus, obturator internus, inferior gemellus and the quadratus femoris. It coursed posterior to the adductor magnus muscle and anterior to the long head of the biceps femoris before bifurcating into the tibial nerve medially and the CPN laterally at ~30mm superior to the popliteal fossa. This phenotype of sciatic nerve exit from the greater sciatic foramen is the most prevalent in the general population, found in ~84% of individuals (Beaton & Anson, 1937; see figure 3).
References
Bartret, A., Beaulieu, C., & Lutz, A. (2018). Is it painful to be different? Sciatic nerve anatomical variants on MRI and their relationship to piriformis syndrome. European Radiology, 2018(28), 4681-4686. https://doi.org/10.1007/s00330-018-5447-6
Beaton, L., & Anson, B. (1937). The relation of the sciatic nerve and its subdivisions to the piriformis muscle. The Anatomical Record, 70(1), 1-5.
Jha, A., & Baral, P. (2020). Composite anatomical variations between the sciatic nerve and the piriformis muscle: a nepalese cadaveric study. Case Report in Neurological Medicine, 2020, ID 7165818. https://doi.org/10.1155/2020/7165818
Natsis, K., Titlis, T., Konstantinidis, G., Paraskevas, G., Piagkou, M., & Koebke, J. (2014). Anatomical variations between the sciatic nerve and the piriformis muscle: a contribution to surgical anatomy in piriformis syndrome. Surgical Radiological Anatomy, 2014(36), 273-280. DOI 10.1007/s00276-013-1180-7
Varenika, V., Lutz, A., Beaulieu, C., & Buckner, M. (2017). Detection and prevalence of variant sciatic nerve anatomy in relation to the piriformis muscle on MRI. Skeletal Radiology, 2017(46), 751-757. DOI 10.1007/s00256-017-2597-6
Transitional Vertebra: Sacralisation and Lumbarisation
Author: Kelsey Andrew (2022)
A female donor aged 77 presented at Queensland University of Technology’s Medical Engineering Research Facility for anatomical variation examination. Skeletal analysis was conducted through computed tomography (CT) and three-dimensional CT reconstruction on a DICOM viewer. Following evaluation, lumbarisation and sacralisation was dismissed in the donor, however, an additional sacral vertebra was discovered and lumbar vertebrae 5 (L5) was partially fused to the sacrum.
Anatomical variations, arising throughout embryological or subadult development, exist in all individuals (Kachlìk et al., 2020). Structural anatomical differences in frequency, morphology and topography that deviate from the most frequently observed phenotypes, and which present without considerable functional physiological changes, are all anatomical variations (Kachlìk et al., 2020).
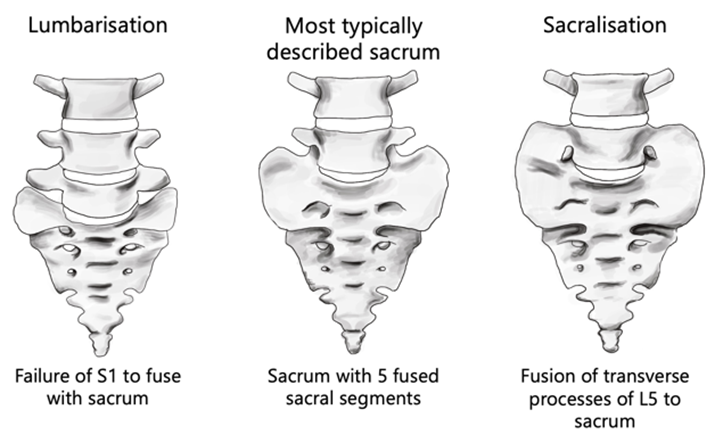
The most frequent sacrum phenotype occurs when five sacral vertebrae fuse forming four pairs of anterior and posterior sacral foramina (Vasuki et al., 2016). Sacralisation and lumbarisation are both anatomical variations of the vertebral column, refer to Figure 1 (Nastoulis et al., 2019). The sacralisation phenotype is an individual with one less vertebra (the fifth lumbar segment, L5) due to it being partially or fully fused to the sacrum (Sharma et al., 2016), whereas the lumbarisation phenotype occurs when the first sacral segment is separated from the sacrum to move freely as an additional vertebra (Nastoulis et al., 2019). Lumbosacral transitional vertebrae (LSVT) anatomical variations fall into four different types. See Table 1 for classification and Figure 2 for visual representation of each Type (Konin & Walz, 2010).
Table 1: Phenotypic variations can be categorised by Castellvi’s 1984 radiographic classification of lumbosacral transitional vertebra (Konin & Walz, 2010).
| Classification | Description | Subtype a | Subtype b |
| Type I | Enlarged and dysplastic transverse process (at least 19 mm) | Ia: Unilateral | Ib: Bilateral |
| Type II | Pseudoarticulation of the transverse process and sacrum with incomplete lumbarisation/sacralisation; enlargement of the transverse process with pseudoarthrosis. | IIa: Unilateral | IIb: Bilateral |
| Type III | Transverse process fuses with the sacrum and there is complete lumbarisation or sacralisation, enlarges transverse process with complete fusion. | IIIa: Unilateral | IIIb: Bilateral |
| Type IV | Type IIa on one side and Type IIIa on the contralateral side. |
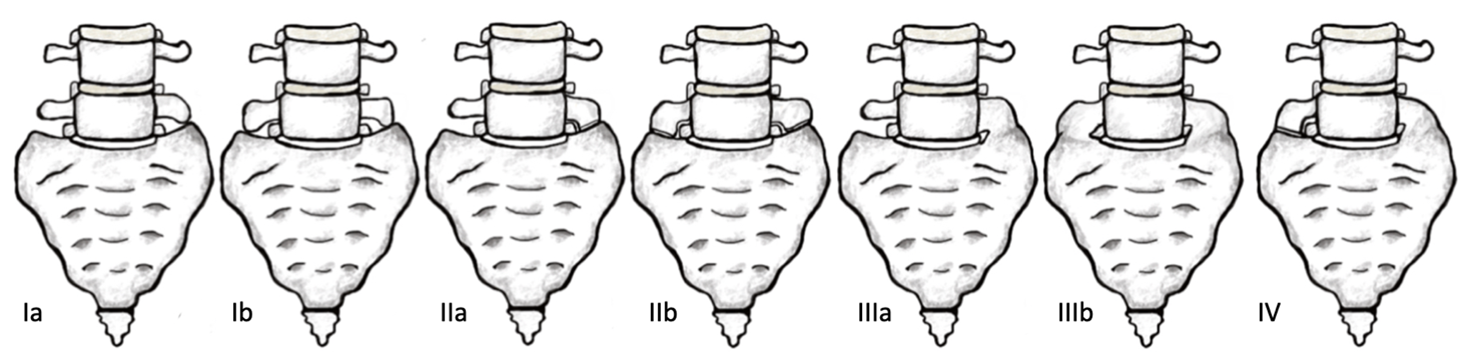
Figure 2: Anterior view of Castellvi’s 1984 radiographic classification of Lumbosacral transitional vertebra. [Image: © K. Andrew 2022. Reproduced with permission]
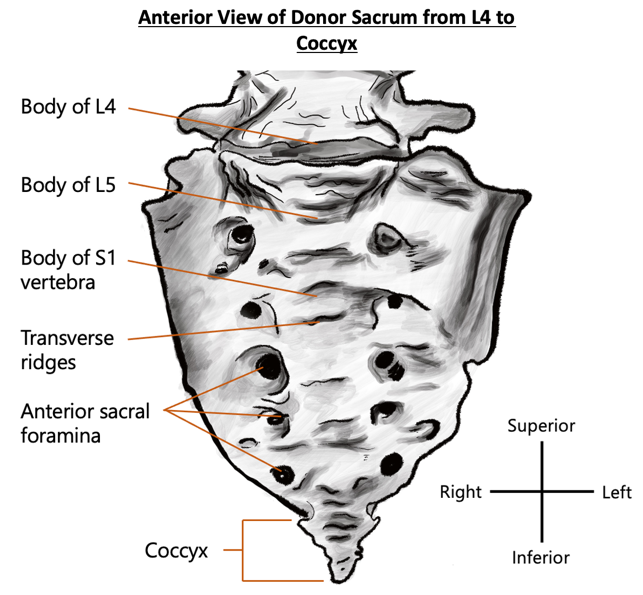
Observable in the donor is an anatomical variation of six sacral segments that are fused anteriorly and posteriorly to form the triangular-shaped sacral bone. Located at the base of the vertebral column, the inferior aspect of vertebral body L5 articulates with the sacral plateau and partially fuses with the first sacral segment—likely due to age related pathology rather than anatomical variation (see Figure 3 below). The sacrum has a concave pelvic surface and a convex posterior surface. From an anteroinferior and posterosuperior view, characteristics of the donor’s sacrum include protuberant anteriorly pointing sacral promontory, five pairs of anterior, posterior sacral and intervertebral foramina, subtle transverse ridges and irregular morphological divergence of the sacral hiatus.
The ancestry of the donor is unknown; however, a comprehensive study presents a Turkish population with the incidence of sacralisation at 21.2% and lumbarisation at 2.4%. The most observed phenotype was anatomical variant Castellvi Type Ia, occurring in 6.8% of the studied population (Bulut et al., 2013). In central India, sacralisation frequency was 14.1% and lumbarisation was 4.3% (Sharma et al., 2016). The sacrum has sexually dimorphic features. It is, however, inaccurate for sex estimation due to its high variability and dependence on population sample and study method (Krenn et al., 2022). It is unclear if anatomical sexually dimorphic characteristics produce symptoms; other variations may cause clinical consequences (Bulut et al., 2013). Symptoms may include lumbar disc prolapse and natal difficulties due to sacrum immobility (Vasuki et al., 2016). For the donor, it is unlikely that the six-sacral-segment phenotype would have dramatically impacted quality of life.
The causation-correlation between lower back pain and LSTV has not been identified due to the lack of a comprehensive classification system of LSTV and small study sample sizes (Bulut et al., 2013). More research in this area will likely increase clinicians’ awareness of LSTV, thereby improving clinical outcomes for individuals (Pandey, 2021).
References
Bulut, M., Uçar, B. Y., Uçar, D., Azboy, İ., Demirtaş, A., Alemdar, C., Gem, M., & Özkul, E. (2013). Is Sacralization Really a Cause of Low Back Pain? ISRN Orthopedics, 2013, e839013. https://doi.org/10.1155/2013/839013
Gregory, L. (2021.). Definition of Anatomical Variation. Introduction to Anatomical Variation. Retrieved October 1, 2022, from https://rise.articulate.com/share/C_GBr2PLUJMP4Kwqc0U_zI0vEbpQgUjT#/lessons/YrbfeLxX6mSmo-Vyxu-8i6vRHJu4shzT
Kachlík, D., Varga, I., Báča, V., & Musil, V. (2020). Variant Anatomy and Its Terminology. Medicina, 56(12). https://doi.org/10.3390/medicina56120713
Konin, G. P., & Walz, D. M. (2010). Lumbosacral Transitional Vertebrae: Classification, Imaging Findings, and Clinical Relevance. American Journal of Neuroradiology, 31(10), 1778–1786. https://doi.org/10.3174/ajnr.A2036
Krenn, V. A., Webb, N. M., Fornai, C., & Haeusler, M. (2022). Sex classification using the human sacrum: Geometric morphometrics versus conventional approaches. PLOS ONE, 17(4), e0264770. https://doi.org/10.1371/journal.pone.0264770
Nastoulis, E., Karakasi, M.-V. ., Pavlidis, P., Thomaidis, V., & Fiska, A. (2019). Anatomy and clinical significance of sacral variations: a systematic review. Folia Morphologica, 78(4), 651–667. https://doi.org/10.5603/FM.a2019.0040
Pandey, M. (2021). A Study on Anatomical Variations of Sacral Foramina and its Clinical Relevance. INTERNATIONAL JOURNAL of ANATOMY RADIOLOGY and SURGERY. https://doi.org/10.7860/ijars/2021/45487.2593
Sharma, V., Sharma, D., Baweja, S. S., & Sharma, D. K. (2016). Osteogenic study of lumbosacral transitional vertebra in central India region. Journal of the Anatomical Society of India, 65, S11. https://doi.org/10.1016/j.jasi.2016.08.042
Vasuki, A. K. Manicka., Sundaram, K. Kalyana., M.Nirmaladevi, M.Jamuna, Hebzibah, D. J., & Fenn, T. K. Aleyemma. (2016). ANATOMICAL VARIATIONS OF SACRUM AND ITS CLINICAL SIGNIFICANCE. International Journal of Anatomy and Research, 4(1), 1859–1863. https://doi.org/10.16965/ijar.2015.352
Xiphisternum
Author: Rhianna Keen (2022)
The sternum is a T-shaped bone located in the anterior wall of the thoracic cavity. It comprises of three parts, the manubrium located most superiorly, the body, mesosternum, or corpus sterni and the xiphisternum or xiphoid process located most inferiorly (Mashriqi et al., 2017).
The xiphoid process typically articulates with the superiorly located corpus sterni at the xiphisternal joint. The xiphisternal joint is a fibrocartilaginous immovable joint or symphysis, which later becomes a synostosis by fusion of the xiphoid process and corpus sterni at approximately 40 years-of-age (Kumar et al., 2014). The xiphoid process is an attachment point for muscles of the anterior thoracic wall such as the transversus thoracic muscle, as well as muscles of the anterior abdominal wall including the internal and external oblique muscles and the rectus abdominis muscle (Mashriqi et al., 2017). The xiphoid process is also attached to the diaphragmatic muscular bundles, the costoxiphoid ligaments and the linea alba (Mashriqi at al., 2017).
Using post-mortem computed tomography (CT) scans, the anatomical phenotype of an 87-year-old female’s xiphoid process was analysed. The patient’s xiphoid process was located inferior to the corpus sterni within the anterior thoracic wall. Costal cartilage from thoracic rib seven articulated at the costal notch of the xiphoid process bilaterally. When visualising the xiphoid process in an axial plane, the cortical bone periphery appeared radiopaque, and the trabecular bone located within the cortical bone has a semiradiopaque appearance. The xiphoid process exhibits a singular extension or process with an oval shape, and no xiphoidal foramen (refer to L, figure 1). It measures approximately ~2.47 cm in length, ~1.58 cm in width and ~0.46cm in depth. This patient’s xiphoid process however had not formed a synchondrosis to the corpus serni , but rather remains isolated and is positioned ~0.83cm inferior to the corpus sterni (refer to D, figure 1 ). When observing the xiphoid process in a sagittal view, the xiphoid process deviated ventrally as seen in G of figure 1.
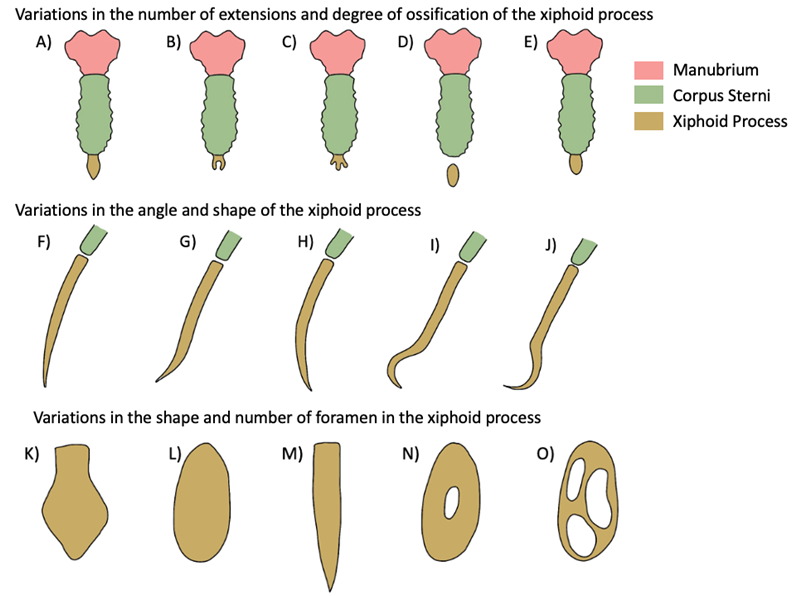
Figure 1: Examples of anatomical phenotypes of the xiphoid process. (A) Single-ended; (B) Double-ended; (C) Triple-ended; (D) No ossification at xiphisternal joint; (E) Complete ossification at xiphisternal joint; (F) Xiphoid process in line with corpus sterni; (G) Ventrally deviated; (H) Dorsally deviated; (I) Hook-shaped; (J) Reverse S-shaped; (K) Pointed shape; (L) Oval shape; (M) Elongated shaped; (N) One xiphoidal foramen; (O) Three xiphoidal foramina. [Image: © R. Keen 2022. Reproduced with permission]
In 2011, 2017 and 2022, studies investigating the prevalence of anatomical phenotypes of the xiphoid process were performed within the Kenyan, Turkish and Greek populations, respectively . Xiphoid processes with a singular extension were recorded within 72.2% of the Turkish population, and 80% of the Kenyan population (Turkay et al., 2017; El-Busaid et al., 2011). Xiphoid processes without foramina were prevalent within 97.5% of the Kenyan population and 95.1% of the Greek population (El-Busaid et al. (2011) and Vatzia et al. (2021). An isolated xiphoid with no xiphisternal fusion was prevalent within 52% of the Turkish population (Bolatl et al., 2020). Finally, xiphoid processes positioned in line with the corpus sterni (which did not deviate dorsally or ventrally) were present in 77% of the Greek population (Vatiza et al., 2021).
Although the term ‘xiphoid process’ is derived from the Greek root ‘Xiphos,’ meaning a straight double-edged sword, numerous phenotypic variations, other than a singular straight xiphoid process can occur (Kumar et al., 2014). Some of these anatomical variations are presented in figure 1. The morphology of the xiphoid process is highly variable, with single, bifurcate, and trifurcate xiphoid extensions being reported frequently within the literature, as seen in figure 2 (Turkay et al., 2017). The xiphoid process can also vary significantly in shape and thickness, including circular, oblong, elongated and thin, or flat and wide shapes. The angle of the xiphoid is also highly variable and can be positioned directly inferior to the corpus sterni, deviating dorsally or ventrally, or more rarely, resembling a hook or an ‘S shape.’ Variations in synchondrosis fusion to the corpus sterni can range from completely fused, partially fused or isolated. The literature has also noted the infrequent occurance of xiphoidal foramina ranging from singular foramina (most commonly) to more than three foramina (Mashriqi et al., 2017).
Within the Turkish population, the length of the xiphoid process was found to be sexually dimorphic, as the distance from the xiphisternal joint to the most inferior part of the xiphoid process measured 1.37 ± 1.32 cm in females and 3.27 ± 1.23 cm in males (Manché et al., 2021). However, sexual dimorphism regarding the shape of the xiphoid was not observed. In the Kenyan population, a single-ended xiphoid process was prevalent in 34 males and 30 females, and double-ended xiphoid process were prevalent in five males and five females (Bolatl et al., 2020).
During embryological development, the sternum is formed by a pair of mesenchymal bands (or sternal bars), located in the ventrolateral body wall. From the 7th week of development, the sternal bars begin to fuse in a cranial to caudal orientation. Failure of the sternal bars to fuse or ossify result in anatomical variations of the sternum (Chun et a.l, 2022).
Understanding the phenotypic variations of the sternum as well as analysing a patient’s sternum before invasive procedures is necessary for safe medical care. Unfortunately, cases of fatal cardiac tamponade have been reported in patients with xiphoid foramina, due to accidental puncturing of the pericardial sac during acupuncture or bone marrow aspiration procedures (Kumar et al., 2014).
References
Bolatl, G., Dogan, N., Koplay, M., Fazliogullari, Z., Karabulut, A. (2020). Evaluation of sternal morphology according to age and sex with multidetector computerized tomography. An International Journal of Experimental and Clinical Anatomy 14(1). https://doi.org/10.2399/ana.20.016
Chun, T., Iwanaga, J., Dumont, A., & Tubbs, S. (2022). Trifid and ventrally curved xiphoid process with two sternal foramina. Surgical and Radiologic anatomy 44, 1253–1255. https://doi.org/10.1007/s00276-022-03011-9
Duraikannu, C., Noronha, O., & Sundarrajan, J. (2016). MDCT evaluations of sternal variations: Pictoral Essay. Indian Journal of Radiology and Imaging 26(2), 185-194. https://doi.org/10.4103/0971-3026.184407
El-Busaid, H., Kaisha, W., Hassanali, J., Hassan, S., Ogeng’o, J., & Mandela, P. (2011). Sternal foramina and variant xiphoid morphology in a Kenyan population. Folia Morphology 71(1), 19-22. https://journals.viamedica.pl/folia_morphologica/article/view/19266/15159
Kumar, S., Bravian, D., & More, A. (2014). Xiphoid Foramen and its Clinical Implication. International Journal of Anatomy and Research 2(2), 240-243. https://www.ijmhr.org/ijar_articles_vol2_2/IJAR-2014-431.pdf
Manché, A., Grima, C., & Camilleri, L. (2021). Xiphoid Size and Gender Differences: an Anatomical Study. International Journal of Anatomical Variation 14(5). https://www.pulsus.com/scholarly-articles/xiphoid-size-and-gender-differences-an-anatomical-study.pdf
Mashriqi, F., D’Antoni, A., & Tubbs, R. (2017). Xiphoid Process Variations: A Review with an Extremely Unusual Case Report. Cureus 9(8). https://doi.org/10.7759/cureus.1613
Turkay, R., Inci, R., Ors, S., Nalbant, M., & Gurses, I. (2017) Frequency of Sternal variations in living individuals. Surgical Radiologic Anatomy 39, 1273-1278. https://doi.org.10.1007/s00276-017-1854-7
Vatzia, K., Fanariotis, M., Makridis, K., Vlychou, M., Fezoulidis, I., & Vassiou, K. (2021). Frequency of sternal variations and anomalies in living individuals evaluated by MDCT. European Journal of Radiology, 142. https://doi.org/10.1016/j.ejrad.2021.109828
Portal Vein
Author: Jenny Ostrom (2022)
The portal vein was investigated in an 85 year old caucasian female donor from Queensland, Australia. The portal vein macroscopically was approximately 10mm in diameter, light pink in colour, soft to the touch and ‘flattened’ as it did not contain any blood. In CT imaging, its appearance was semi-radiopaque without intravenous contrast. The hepatic portal vein was located posterior to the neck of the pancreas and anterior to the inferior vena cava in the epigastric region of the abdominal cavity. Originating as a confluence of the superior mesenteric vein and splenic vein, with the inferior mesenteric vein a tributary of the splenic vein, and the left gastric vein a tributary of the hepatic portal vein. This pattern is known as ‘Thompson classification Type I’ (Figure 1). The hepatic portal vein ascends posterior to the proximal duodenum and terminally divides into the right and left portal veins at the porta hepatis of the liver.
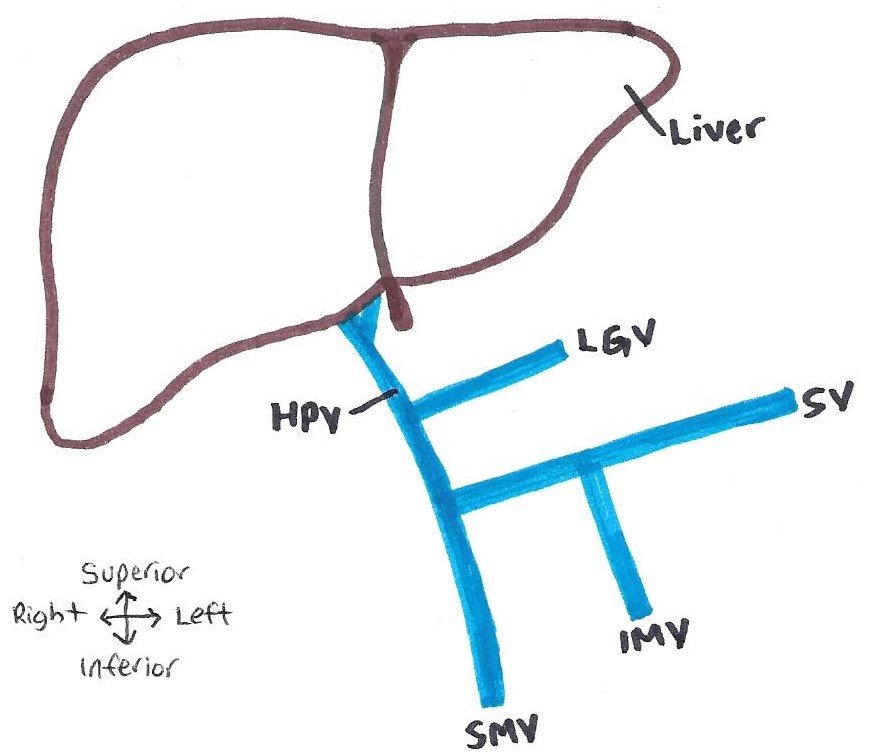
Figure 1: Hepatic portal system variant observed in the donor. Known as Thompson classification type I – with IMV a tributary of the SV and LGV a tributary of the HPV. HPV: hepatic portal vein, SV: splenic vein; SMV: superior mesenteric vein, IMV: inferior mesenteric vein, LGV: left gastric vein. [Image: © J. Ostrom 2022. Reproduced with permission]
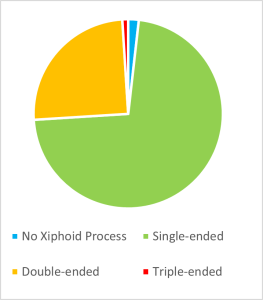
The population frequency for each hepatic portal vein Thompson classification in a Thai, Irish, and American population, are displayed in Table 1 below. The Type I variant seen in our donor is also the most common variant in all three of the populations listed.
Table 1: Hepatic portal vein Thompson classification types variation across populations.
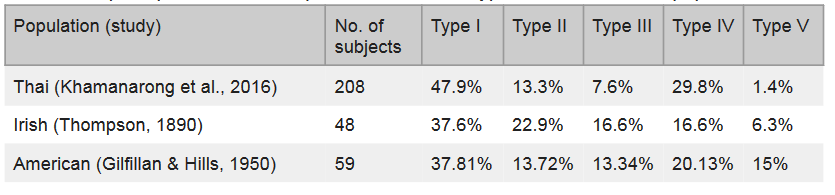
The Type II-V Thompson classifications are presented in Figure 2 (Thompson, 1890). Type II (Figure 2 A) presents with the inferior mesenteric vein as a tributary of the superior mesenteric vein, and the left gastric vein a tributary of the splenic vein. Type III (Figure 2 B) presents as the inferior mesenteric vein and left gastric vein as tributaries of the splenic vein. Type IV (Figure 2 C) presents as the inferior mesenteric vein a tributary of the superior mesenteric vein, and the left gastric vein a tributary of the hepatic portal vein. Type V (Figure 2 D) presents as the hepatic portal vein formed from a confluence between the inferior mesenteric vein, superior mesenteric vein and splenic vein.
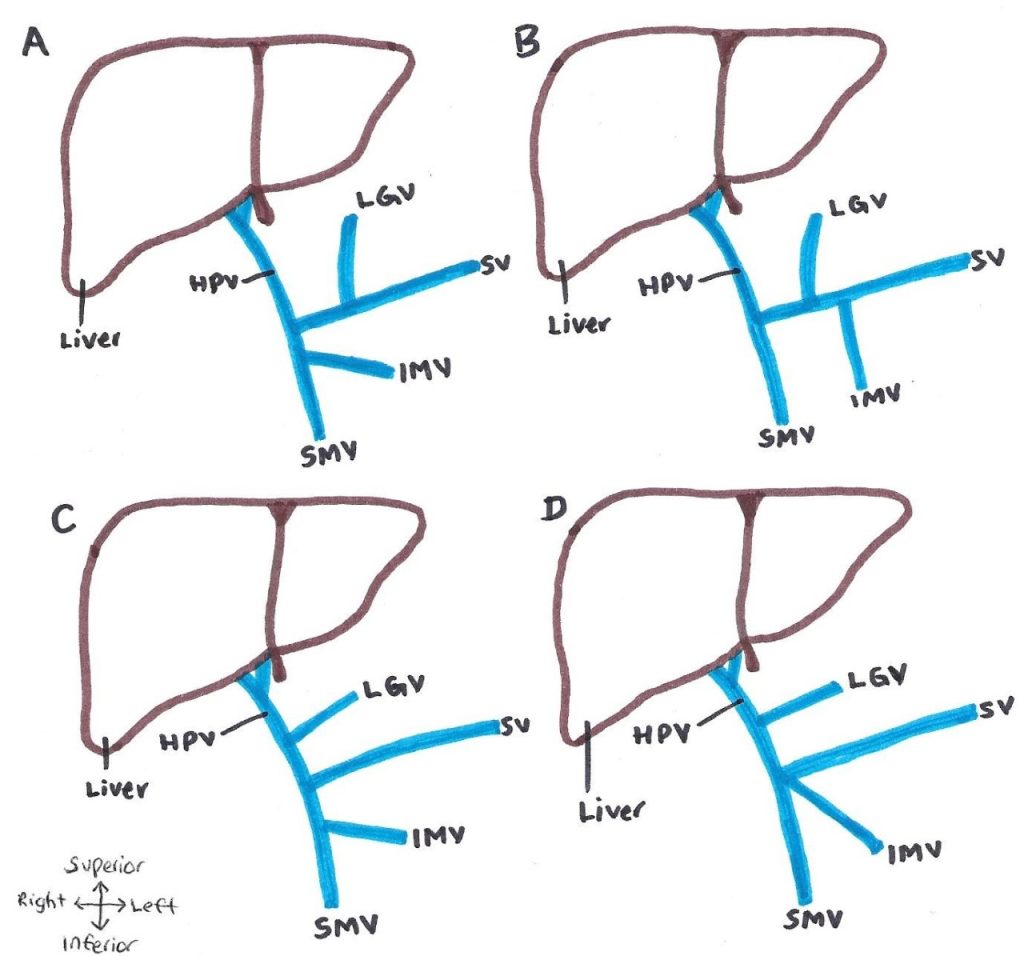
Figure 2: Common anatomical variations of the hepatic portal system, according to Thompson (1890) classification. (A) Type II – IMV a tributary of the SMV and LGV a tributary of the SV. (B) Type III – IMV and LGV tributaries of the SV. (C) TYpe IV – IMV a tributary of the SMV and LGV a tributary of the HPV. (D) Type V – HPV formed from a confluence between the SMV, IMV and SV. HPV: hepatic portal vein, SV: splenic vein; SMV: superior mesenteric vein, IMV: inferior mesenteric vein, LGV: left gastric vein. [Image: © J. Ostrom 2022. Reproduced with permission]
The hepatic portal vein variations are not reported as sexually dimorphic or to have any functional consequences. However, as variations are fairly common, the knowledge of these extrahepatic portal vein variations is important for surgeons and interventional radiologists when performing surgeries, particularly involving portal vein resection, the liver, pancreas and duodenum. A lack of knowledge of the drainage pattern of these veins (particularly the left gastric vein) and vessel injury, could result in gastroesophageal varices, venous stasis, gastric haemorrhage or many other postoperative complications (Khamanarong et al., 2016; Rebibo et al., 2012).
References
Gilfillan, R. S., & Hills, H. L. (1950). Anatomic study of the portal vein and its main branches. Archives of Surgery (Chicago, Ill.: 1920), 61(3), 449–461. https://doi.org/10.1001/archsurg.1950.01250020454005
Khamanarong, K., Woraputtaporn, W., Amarttayakong, P., Ahooja, A., & Khuntikeo, N. (2016). Classification of portal vein tributaries in Thai cadavers including a new type V. Surgical and Radiologic Anatomy, 38(6), 735–739. https://doi.org/10.1007/s00276-015-1592-7
Rebibo, L., Chivot, C., Fuks, D., Sabbagh, C., Yzet, T., & Regimbeau, J.-M. (2012). Three-dimensional computed tomography analysis of the left gastric vein in a pancreatectomy. The Official Journal of the International Hepato Pancreato Biliary Association, 14(6), 414–421. https://doi.org/10.1111/j.1477-2574.2012.00468.x
Thompson, W. H. (1890). Collective investigation in the anatomical department of Trinity College, Dublin. Transactions of the Royal Academy of Medicine in Ireland, 8(1), 516–521. https://doi.org/10.1007/BF03169521
Thyroid Gland
Author: Brianna Frost (2022)
In this variation report, the thyroid gland of an 87-year-old old cadaveric female donor body was observed. In doing so, a morphological variation of the thyroid gland was identified, known as a tubercle of Zuckerkandl. A tubercle of Zuckerkandl is an atypical variation, in that it is not the most commonly observed morphological phenotype of the thyroid (Ozgur et al., 2011).
As occurs in 60.4% of patients with Zuckerkandl tubercles, the tubercle in this patient presented unilaterally on the right side of the thyroid (Deniz et al., 2022). Presentation can also occur unilaterally on the left side (13.2%) or bilaterally (26.6%) (Deniz et al., 2022). The thyroid gland in this patient was located anteriorly to the trachea and inferiorly to the thyroid cartilage of the larynx. The tubercle, which is a protrusion composed of condensed parenchymal tissue, was located on the posterolateral aspect of the right lateral thyroid lobe (as seen in figure 1). The tubercle was a greyish-beige colour and extended laterally, approximately 5 mm, in the shape of a rounded balloon and had a height of approximately 9 mm.
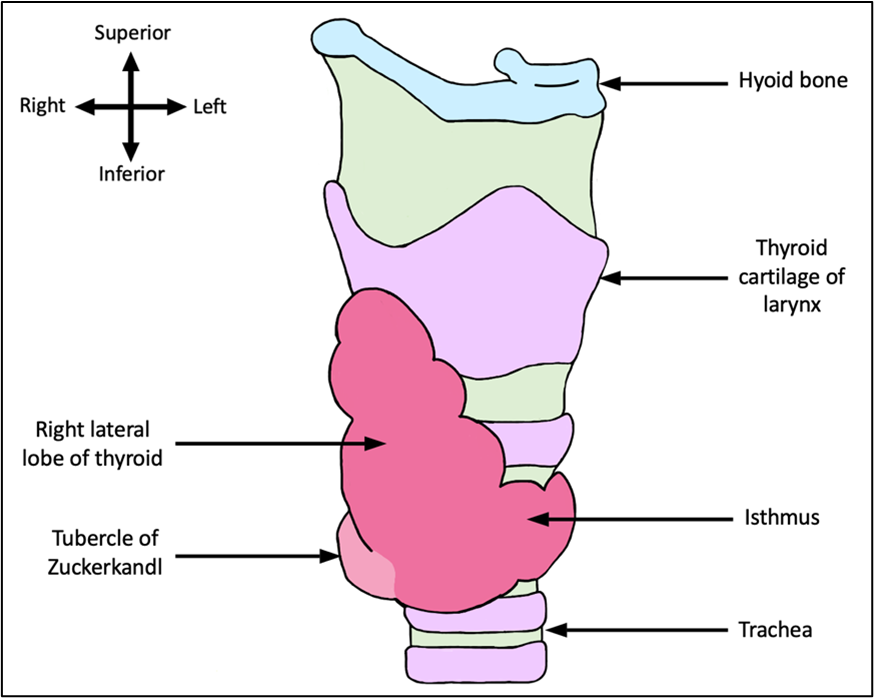
Figure 1: Anterolateral view of the right lateral lobe of the thyroid gland and tubercle of Zuckerkandl. This figure shows the morphological thyroid gland phenotype observed in the donor. Image is not to scale. [Image: © B. Frost 2022. Reproduced with permission]
When it comes to frequency of this phenotype, a variety of values have been reported. The majority of studies, such as those conducted by Won et al. (2017), Irkorucu (2016), Mehmood et al. (2017) and Sañudo et al. (2012), which investigated Korean, Turkish, Pakistani and Spanish populations respectively, all reported higher frequencies, ranging between 62% and 83%. These studies, however, were all conducted using smaller populations (between 84 and 173 subjects). A larger study by Deniz et al. (2022), which investigated a Turkish population, that and used 1000 subjects found a lower frequency of 22%. When incorporating all the data available, the frequency for this particular phenotype, on average, ranges between 64% and 74%, based on a population of males and females of a variety of ethnicities.
In addition to this phenotype, another common morphological phenotype of the thyroid is a butterfly-shaped thyroid gland with symmetry between sides and unity of the two lobes at the isthmus, with no extensions or attachments (figure 2, B). This phenotype has a frequency of 40% in a Northeast Indian population (Rajkonwar & Kusre, 2016). Another common morphological phenotype of the thyroid is the presence of a pyramidal lobe. This phenotype is characterised by a thyroid gland with the symmetrical butterfly-shaped morphology previously described, but with a narrow projection of thyroid tissue that extends superiorly from any location on the thyroid (figure 2, C) and has a frequency of 39% in a Northeast Indian population (Rajkonwar & Kusre, 2016). A further common morphological phenotype of the thyroid is the absence of an isthmus. The morphology of this phenotypes also follows the symmetrical butterfly-shaped morphology previously described but the two lobes are not united at the anterior aspect of the gland due to a gap created by the absence of the isthmus of the thyroid (figure 2, D). This phenotype has a frequency of 21% in a Northeast Indian population (Rajkonwar & Kusre, 2016).
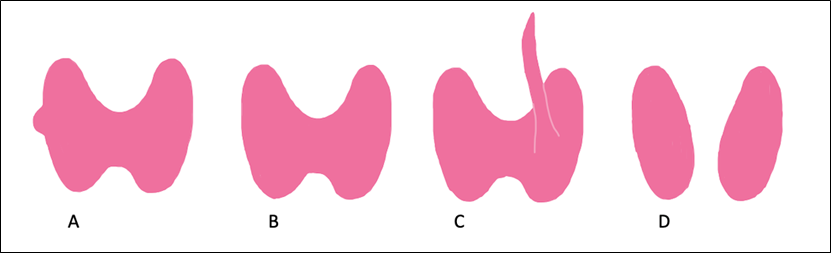
Figure 2. Four common thyroid gland phenotypes. A. Symmetrical butterfly-shaped thyroid with tubercle of Zuckerkandl present unilaterally, as observed in the donor. B. Symmetrical butterfly-shaped thyroid with no extensions or attachments. C. Symmetrical butterfly-shaped thyroid with the presence of a pyramidal lobe. D. Symmetrical butterfly-shaped thyroid with the isthmus absent. Image not to scale. [Image: © B. Frost 2022. Reproduced with permission]
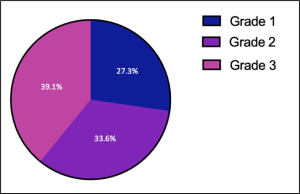
It should also be noted that within the population of people with the Zuckerkandl tubercle phenotype, there is further variation relating to the width of the tubercle, allowing for tubercles to be classified into different gradings. The presence of only a slight thickening in place of a protrusion constitutes a grade one Zuckerkandl tubercle, whereas a protrusion measuring less than 1 cm is a grade two and a protrusion measuring more than 1 cm, is a grade three (Mehanna et al., 2014). The frequencies of each of these three grades of Zuckerkandl tubercles can be seen in figure 3 (Mehanna et al., 2014). Based on this classification system, the tubercle observed in this donor would be a grade two tubercle of Zuckerkandl.
The phenotype is also influenced by sex, with females having a significantly higher frequency of the Zuckerkandl tubercle phenotype (27.5%) than males (18.8%) (Deniz et al., 2022). Additionally, it should be noted that the presence of a Zuckerkandl is an anatomical variation rather than a pathology and therefore does not have any negative functional consequences, and at present, no studies have identified this phenotype as a risk factor for particular morbidities (Lee et al., 2012; Sadacharan et al., 2020).
References
Deniz, M. A., Turmak, M., Hattapoglu, S., Akbudak, I., & Tay, M. (2022). Evaluation of thyroid Zuckerkandl tubercle by computed tomography. Surg Radiol Anat., 44(6), 907-912. https://doi.org/10.1007/s00276-022-02963-2
Irkorucu, O. (2016). Zuckerkandl tubercle in thyroid surgery: Is it a reality or a myth? Ann Med Surg (Lond), 7(1), 92-96. https://doi.org/10.1016/j.amsu.2016.03.030
Lee, T. C., Selvarajan, S. K., Curtin, H., & Mukundan, S. (2012). Zuckerkandl tubercle of the thyroid: a common imaging finding that may mimic pathology. AJNR Am J Neuroradiol., 33(6), 1134-1138. https://doi.org/10.3174/ajnr.A2914
Mehanna, R., Murphy, M. S., & Sheahan, P. (2014). Thyroid tubercle of zuckerkandl is more consistently present and larger on the right: a prospective series. Eur Thyroid, 3(1), 38-42. https://doi.org/10.1159/000355823
Mehmood, Z., Khan, U., Bokhair, I., Hussain, A., Subhan, A., & Nazeer, M. (2015). Zuckerkandl Tubercle: An Important Landmark in Thyroid Surgery. J Coll Physicians Surg Park, 25(7), 495-497. https://pubmed.ncbi.nlm.nih.gov/26208551/
Ozgur, Z., Celik, S., Govsa, F., & Ozgur, T. (2011). Anatomical and surgical aspects of the lobes of the thyroid glands. Eur Arch Otorhinolaryngol., 268(9), 1357-1363. https://doi.org/10.1007/s00405-011-1502-5
Rajkonwar, A. J., & Kusre, G. (2016). Morphological Variations of the Thyroid Gland among the People of Upper Assam Region of Northeast India: A Cadaveric Study. J Clin Diagn Res., 10(12), 01-03. https://doi.org/10.7860/JCDR/2016/19395.8966
Sadacharan, D., Mahadevan, S., Sathya, A., Gopal, J., Murthy, S., Chandrashekaran, S., Shanmugasundar, G., & Rao, S. S. (2020). Prevalence and implications of thyroid related embryological remnants: A prospective study of 1118 total thyroidectomies. J Family Med Prim Care., 9(2), 632–636. https://doi.org/10.4103/jfmpc.jfmpc_1141_19
Sañudo, E. G, Argüelles, M. E. M., Valdezate, L. A. V., Calvo, D. H., & García, L. M. G. (2012). Zuckerkandl’s tubercle. Location, shape and dimensions. Acta Otorrinolaringol Esp., 63(6), 443-449. https://doi.org/10.1016/j.otorri.2012.05.003
Won, H. J., Won H. S., Kwak, D. S., Jang, J., & Kim I. B. (2017). Zuckerkandl Tubercle of the Thyroid Gland: Correlations between Findings of Anatomic Dissections and CT Imaging. AJNR Am J Neuroradiol., 38(7), 1416-1420. https://doi.org/10.3174/ajnr.A5172
- Student works are the copyright of the student listed and excluded from the CC BY-NC licence of the book. No further reproduction of this content is permitted. If you would like to reproduce this content, please contact the authors of the book found on https://oercollective.caul.edu.au/anatomical-variation/front-matter/about-the-authors/. ↵
