4.4 Genomes
The genome is all the genetic material contained within a cell and contains the information needed for an organism to grow, mature and function. However, your genome includes more than just protein-coding genes.
How many genes are there?
The Human Genome Project, completed in 2003, identified that humans have roughly 20,000 protein-coding genes. Researchers were expecting many more protein-coding genes, but it has been revealed that about 1–2% of our DNA encodes proteins. The rest was thought to be ‘junk DNA’ that we don’t need, but it turns out there is a lot of important information hidden in this non-coding DNA. The non-coding portion of the genome includes regulatory information (what should be expressed when) and RNA components such as transfer RNA and ribosomal RNA. Some of it probably is ‘junk’, however, that has remained in our genome throughout our evolution. Or perhaps we just haven’t discovered its purpose yet.
How is DNA organised?
In 2022, it was revealed that each of your cells has 3,054,815,472 nucleotides (A, T, C and Gs) in its DNA. That equates to about 2 metres of DNA per cell! How does that fit into a nucleus that is only approximately 0.01 mm wide? A bit like how a long slinky can collapse to much smaller than its extended length, the DNA ladder rolls up, wraps around histones (little balls of protein) and supercoils its way into chromosomes. The next video shows how the supercoil works, along with other processes discussed above.
DNA animation
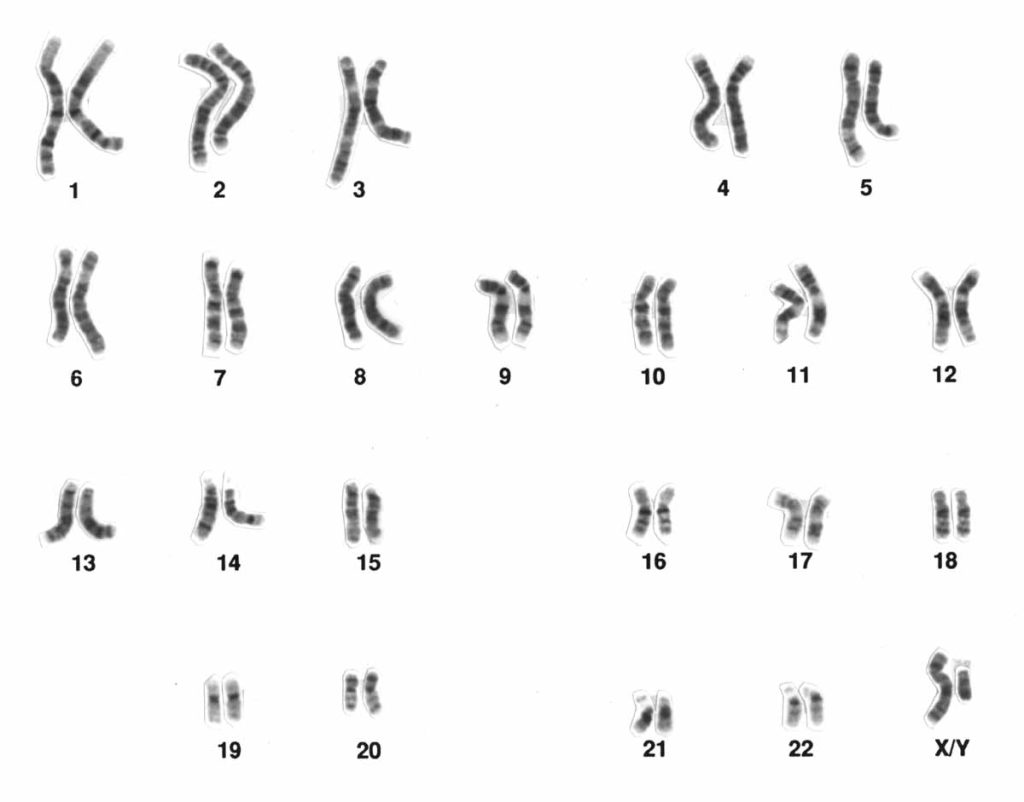
Typically, humans have 23 pairs of chromosomes: 44 autosomes and two sex chromosomes. Chromosomes are labelled in order of size, with chromosome 1 being the largest and chromosome 22 the smallest (the X and the Y sex chromosomes are always put as a pair at the end even though their size is different – see Figure 4.10). You inherit 23 chromosomes from your biological mother and 23 chromosomes from your biological father. Biological females have two X chromosomes (one from each parent), while biological males have one X (from their mother) and one Y chromosome (from their father).
As we have seen, DNA exists tightly coiled into chromosomes, but it will uncoil for two reasons: gene expression (transcription explained above) and DNA replication. DNA replication occurs early in mitosis or meiosis, when the cell divides to form daughter cells. It involves DNA polymerase copying the entire chromosome from end to end. It is like transcription, except that the whole chromosome is copied, not just a single gene, and it is completed by DNA polymerase so that the resulting copied chromosome is made up of DNA, not RNA. When all 46 chromosomes have been copied, the cell is ready to divide. Here is a great cartoon video comparing mitosis and meiosis.
Mitosis vs meiosis: Side by side comparison
The ends of chromosomes
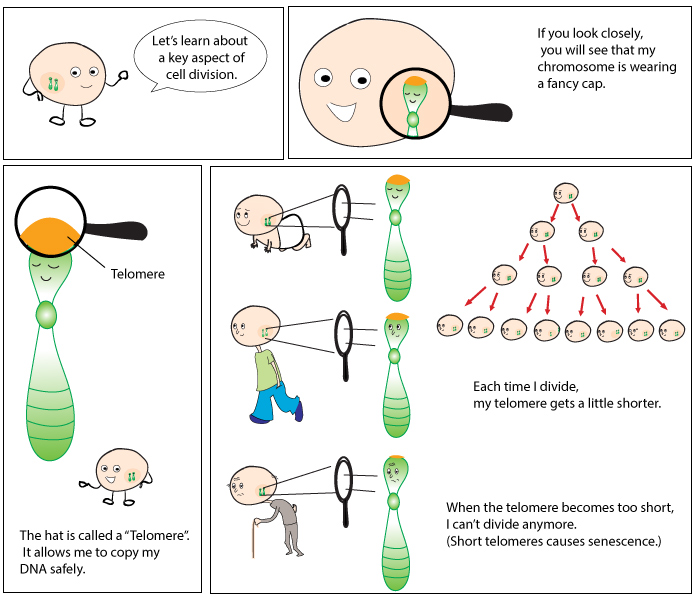
![]() At both ends of each of your chromosomes, there are little ‘caps’ called telomeres. Telomeres protect chromosomes during cell division, preventing degradation of the DNA. Interestingly, telomeres shorten as we age. When they get too short, the cell becomes inactive and no longer divides (this is called senescence and is why we age).
At both ends of each of your chromosomes, there are little ‘caps’ called telomeres. Telomeres protect chromosomes during cell division, preventing degradation of the DNA. Interestingly, telomeres shorten as we age. When they get too short, the cell becomes inactive and no longer divides (this is called senescence and is why we age).
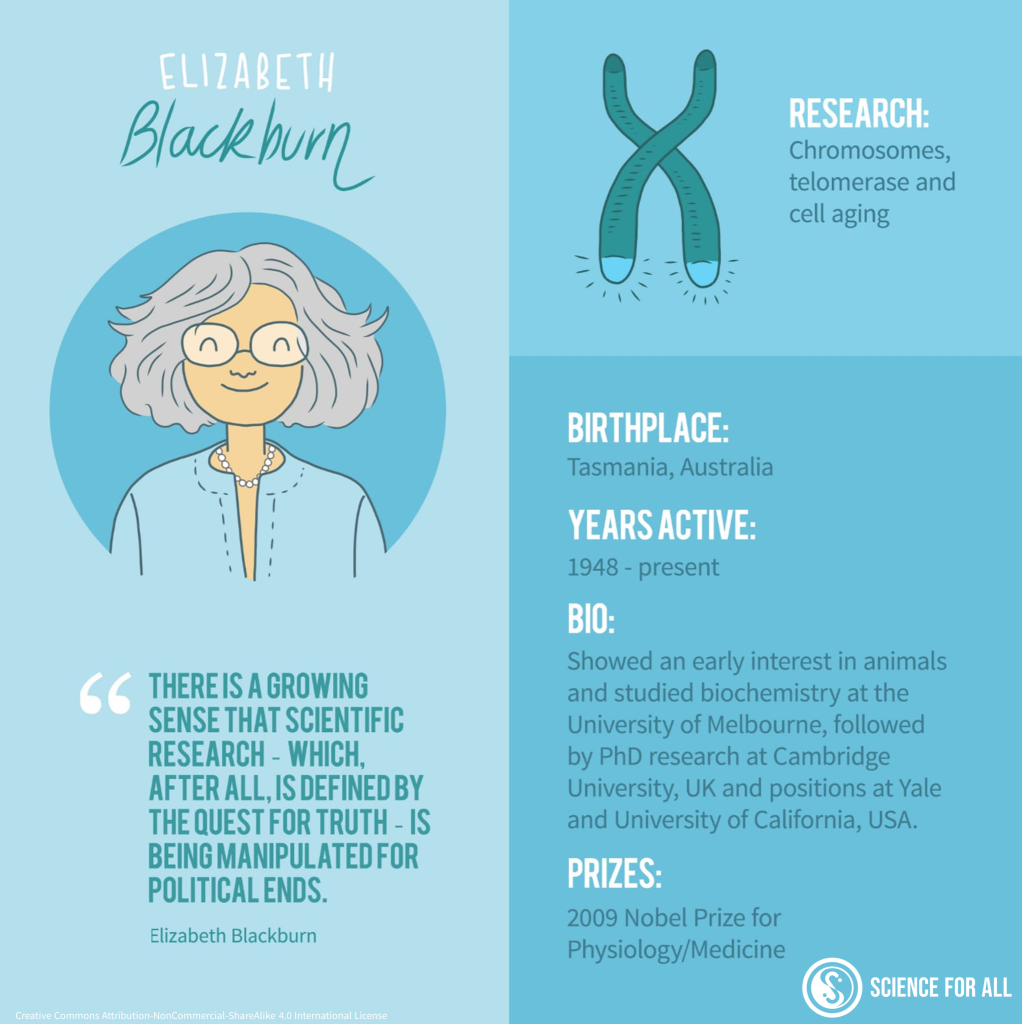
Telomerase is the enzyme that replenishes telomeres, by adding DNA to the ends of chromosomes. In 1984, Australian scientist Elizabeth Blackburn along with Carol Greider discovered telomerase, for which they were awarded a Nobel prize in 2009 alongside Jack Szostak. Telomerase is not normally active in somatic (body) cells, but it is busy working in germ cells (those that make eggs and sperm), some stem cells and cancer cells. This is because these cells are constantly dividing, and if telomerase was not extending the chromosome’s telomeres, the cells would undergo cell death (apoptosis) or enter senescence.
How and when do genes turn on?
Twenty-thousand protein-coding genes is a lot of information, and not all of it is relevant or needed all the time. Cells in your liver don’t need to communicate visual information like the cells of your eye do. So how do cells know which nucleotides make up the genes that the cells need? And how do they know when to turn them ‘on’? (As in, when to transcribe and translate the gene to make its associated protein.)
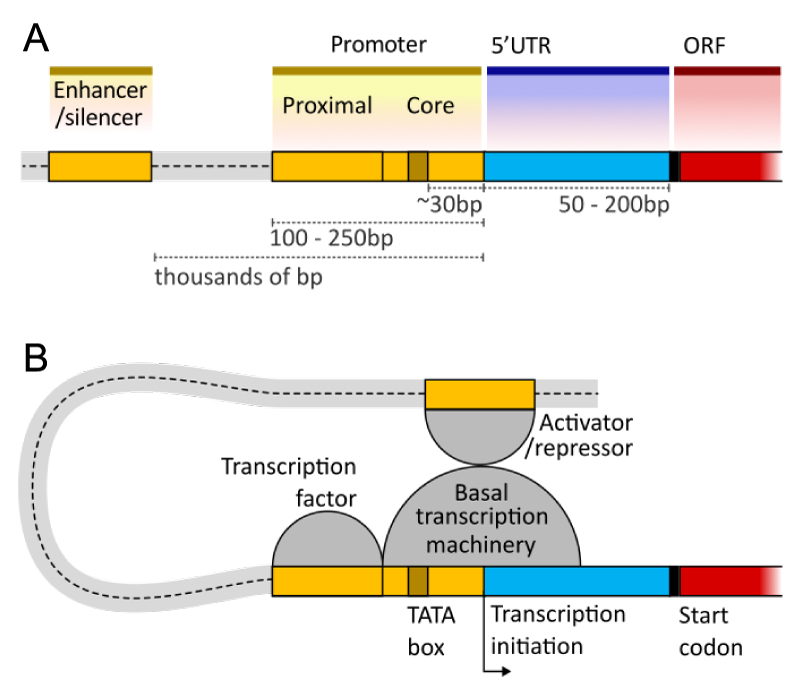
Gene regulation – how genes are turned on or off at certain times – is a complex process, but it is controlled (regulated) in a number of ways. The nucleotides before the start of the coding region of a gene (called upstream) contain a number of regions that can aid in turning on or off gene expression. Just upstream of the transcription start site is the promoter region, where RNA polymerase binds to start transcription. Further upstream of this (up to thousands of nucleotides before the promoter region) are regulatory elements such as enhancer or silencer regions, which transcription factors bind to and influence if gene expression is ‘enhanced’ or ‘silenced’. There may also be regulatory sequences after the open reading frame of the gene (Figure 4.11).
DNA methylation is another way gene expression can be controlled. If certain genes are not required to be expressed, they can be ‘methylated’ – the nucleotides have methyl groups attached so that the enzymes involved in transcription cannot access them to turn the gene ‘on’. When the genes are needed, they are unmethylated so that RNA polymerase has access to start transcription. DNA methylation is controlled by epigenetics – when gene expression is influenced by the environment.
Did you know mitochondria have their own DNA?
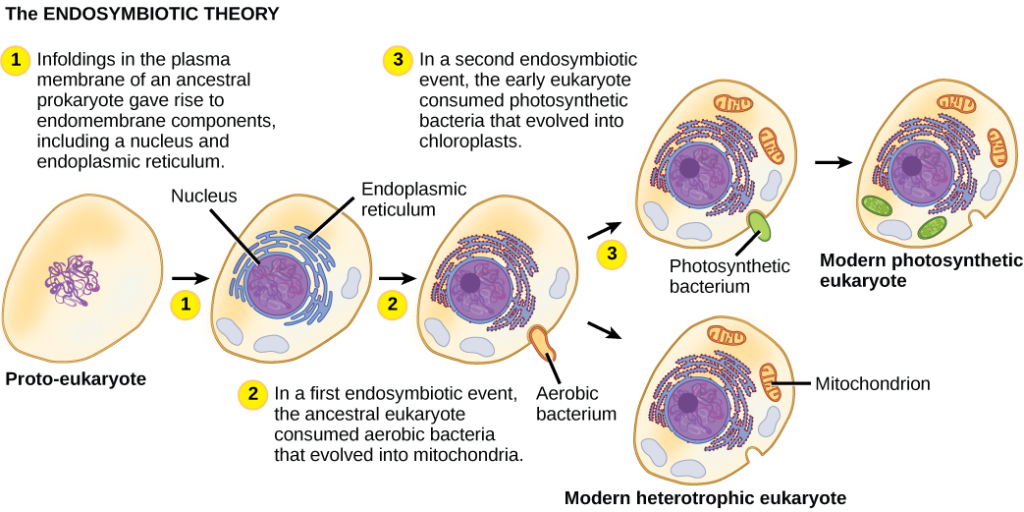
There is evidence that mitochondria, the organelles within the cell that make ATP (energy), were once a standalone organism, but a symbiotic relationship evolved and they ended up living inside eukaryotic cells (the endosymbiotic theory – see Figure 4.13). It is hypothesised that they were engulfed by a larger cell, the cell provided the mitochondria with food, and in return the mitochondria provided the cell with energy. This is why mitochondria have their own DNA, although some of their genes have integrated into the nuclear DNA. The same goes for chloroplasts in plant cells.
Mitochondrial DNA is inherited maternally (from your mother), as the mitochondria exist within the egg at fertilisation, but the mitochondria in the tail of the sperm is destroyed upon fertilisation.

.png)