12 Sampling methods
This chapter is adapted from the Australian Bureau of Statistics licensed under a Creative Commons Attribution 4.0 International license.
Learning Objectives
By the end of this chapter, students must be able to:
- understand the steps in a sampling plan
- differentiate between different types of sampling methods
Introduction
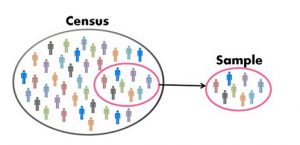
In most situations, it is not feasible for the researcher to collect information from all people within a population, usually referred to as a census. It is important to have a plan on how to select a ‘sample’ of individuals who could be tapped for data collection. The major decisions to be made for a ‘sampling plan’ are:
- defining the population and sampling units;
- identifying the sampling frame;
- estimating the sample size;
- determining the sampling methodology; and
- choosing a sampling technique
This chapter will examine all these topics in detail.
Defining the population and sampling units
The population is the aggregate or collection of units (e.g., individuals, households, schools, hospitals, businesses) about which the survey will be conducted. The target population is also known as the scope of the survey. It is the ‘population’ that the survey is aimed at.
A critical component of sampling is to accurately define the population that the researcher is interested in surveying. This means making sure that the definition includes key characteristics of the population units, which would make it easier to identify the exact group of individuals to target.
Identifying the sampling frame
The frame refers to the list of units (eg, persons, households, businesses, etc) in the survey population. Since the selection of the sample is directly based on this list, the frame is one of the most important tools in the design of a survey. It determines how well a target population is covered and affects the choice of the data collection method. It is also desirable that the frame contains auxiliary information on the units so that a more efficient sample plan can be developed. The frame should contain contact points for each of the units listed so that it can be used to access the population. This means that for postal surveys the frame should contain postal addresses; for interviewer-based surveys, the frame should contain street addresses, and for telephone surveys, the frame should contain telephone numbers.
A good frame is up-to-date, does not have any missing units, contains only relevant units, does not include duplicates, is accessible to frame users, and contains sufficient information to uniquely identify and contact each unit.
Sample size determination
An important aspect of sample design is deciding upon the sample size given the objectives and constraints that exist. Since every survey is different there are no fixed rules for determining sample size. However, factors to be considered include
- the population size and variability within the population;
- resources (time, money, and personnel);
- level of accuracy required of the results;
- level of detail required in the results;
- the likely level of non-response; and
- the relative importance of the variables of interest
Once these issues have been addressed, you are in a better position to decide on the size of the sample.
Variability
The more variable the population is, the larger the sample required to achieve specific levels of accuracy. However, actual population variability is generally not known in advance; information from a previous survey or a pilot test may be used to give an indication of the variability of the population.
When the characteristic being measured is comparatively rare, larger sample size will be required to ensure that sufficient units having that characteristic are included in the sample.
Population size
An aspect that affects the sample size required is the population size. When the population size is small, it needs to be considered carefully in determining the sample size, but when the population size is large it has little effect on the sample size. Gains in precision from increasing the sample size are by no means proportional to population size.
Resources and accuracy
As discussed earlier, the estimates are obtained from a sample rather than a census, therefore the estimates are different from the true population value. A measure of the accuracy of the estimate is the standard error. A large sample is more likely to have a smaller standard error or greater accuracy than a small sample.
When planning a survey, you might wish to minimize the size of the standard error to maximize the accuracy of the estimates. This can be done by choosing as large a sample as resources permit. Alternatively, you might specify the size of the standard error to be achieved and choose a sample size designed to achieve that. In some cases, it will cost too much to take the sample size required to achieve a certain level of accuracy. Decisions then need to be made on whether to relax the accuracy levels, reduce data requirements, increase the budget or reduce the cost of other areas in the survey process.
Level of detail required
If we divide the population into subgroups (strata) and we are choosing a sample from each of these strata then a sufficient sample size is required in each of the subgroups to ensure reliable estimates at this level. The overall sample size would be equal to the sum of the sample sizes for the subgroups. A good approach is to draw a blank table that shows all characteristics to be cross-classified. The more cells there are in the table, the larger the sample size needed to ensure reliable estimates.
Likely level of non-response
Non-response can cause problems for the researcher in two ways. The higher the non-response the larger the standard errors will be for a fixed initial sample size. This can be compensated for by assigning a larger sample size based on an expected response rate, or by using quota sampling.
The second problem with non-respondents is that the characteristics of non-respondents may differ markedly from those of respondents. The survey results will still be biased even with an increase in sample size (ie. increasing the sample size will have no effect on the non-response bias). The lower the response rate, the less representative the final sample will be of the total population, and the bigger the bias of sample estimates. Non-response bias can sometimes be reduced by post-stratification as well as through intensive follow-up of non-respondents, particularly in strata with poor response rates.
The relative importance of the variables of interest
Generally, surveys are used to collect a range of data on a number of variables of interest. A sample size that will result in insufficiently precise information for one variable may not result in sufficiently precise information for another variable. It is not normally feasible to select a sample that is large enough to cover all variables to the desired level of precision. In practice, therefore, the relative importance of the variables of interest are considered, priorities are set and the appropriate sample size is determined accordingly.
Sampling methodology: probability and non-probability
A probability sample is one in which every unit of the population has a known non-zero probability of selection and is randomly selected. A probability sample allows inferences about the target population to be made. By knowing the selection probability for each unit, objective selections can then be made which should produce a more representative sample. Known probabilities also allow the measurement of the precision of the survey estimates in terms of standard errors and confidence intervals.
If the probability of selection for each unit is unknown, or cannot be calculated, the sample is called a non-probability sample. Non-probability samples are often less expensive, easier to run, and don’t require a frame. However, it is not possible to accurately evaluate the precision (ie. closeness of estimates under repeated sampling of the same size) of estimates from non-probability samples since there is no control over the representativeness of the sample. If a non-probability sample is carried out carefully, then the bias in the results can be reduced.
Choosing between probability and non-probability samples
The choice between using a probability or a non-probability approach to sampling depends on a variety of factors:
- the objectives and scope of the survey;
- the method of data collection suitable to those objectives;
- the precision required of the results and whether that precision needs to be able to be measured;
- the availability of a sampling frame;
- the resources required to maintain the frame; and
- the availability of extra information about the units in the population.
Probability sampling is normally preferred when conducting major surveys, especially when a population frame is available ensuring that we are able to select and contact each unit in the (frame) population. However, where time and financial constraints make probability sampling infeasible, or where knowing the level of accuracy in the results is not an important consideration, non-probability samples do have a role to play since they are inexpensive, easy to run and no frame is required. For this reason, when conducting qualitative (investigative), rather than quantitative research, non-probability samples & techniques such as case studies are generally superior to probability samples & quantitative estimation. Non-probability sampling can also be useful when piloting surveys.
Sampling techniques – non-probability samples
Different types of non-probability samples are discussed below. In a non-probability sample, all members of a population do not have an equal chance of being selected for a sample. However, if a non-probability sample is carried out carefully, then the bias in the results can be reduced.
Quota sampling
To select a quota sample, the interviewers select respondents until a pre-determined number of respondents in certain categories are surveyed (eg. the interviewers might select the sample to achieve a certain age/sex breakdown reflective of the target population).
This is the method of sampling commonly used by market researchers and political pollsters as it can produce fairly good estimates if it is properly conducted. When top-up units are selected randomly to fill a quota, and no element of judgment is used by the researcher for unit selection, it is very similar to a probability sample. However, when non-response is significant (which is almost always the case for voluntary surveys), quota sampling can under-represent those portions of the population that are unwilling to respond or hard to contact.
Convenience and haphazard sampling
Street corner interviews, magazine and newspaper questionnaires, and phone-in polls are all examples of convenience or haphazard samples. These types of surveys are subject to biased or unrepresentative samples as only persons who feel strongly about the topic will respond. These surveys also have a tendency to ask questions that are loaded or have biased wording.
Street corner interviews can be biased depending on the timing and the placement of the interviewer. There is no control over selecting the sample of respondents in any of these methods, however, they are very cheap and easy to administer.
Judgment or purposive sampling
Judgment sampling is where a ‘representative’ sample is chosen by an expert in the field of study. Judgment sampling is subject to unknown biases but may be justified for very small samples. This form of sampling can be used to choose a sample for a pilot test of a probability survey but inferences about the population should not be made from judgment samples. Judgment sampling is also known as purposive sampling.
Snowball sampling (or chain referral sampling)
According to this type of sampling technique, the researcher seeks assistance from research participants to help identify and recruit other participants for the study. This can be particularly useful in a situation where the target population is hard to find. Examples include minority groups, people with a medical condition, or people with a particular ideology.
Sampling techniques – probability samples
Simple random sampling
Simple random sampling (SRS) is a probability selection scheme where each unit in the population is given an equal probability of selection, and thus every possible sample of a given size has the same probability of being selected. One possible method of selecting a simple random sample is to number each unit on the sampling frame sequentially and make the selections by generating “selection numbers” from a random number table or, from some form of random number generator.
Table: Advantages and Disadvantages – Simple Random Sampling
| Advantages | Disadvantages |
| Simple; Easy to use | Requires a complete list of all population units |
| Absolute random selection so no bias | Expensive; not feasible to implement |
In practice, simple random sampling is rarely used because there is almost always a more efficient method of designing the sample (in terms of producing accurate results for a given cost). Nevertheless, simple random sampling forms the basis of a number of the more complex methods of sample design, and is used as a benchmark to which other designs are compared.
To participate in a focus group discussion, a teacher could use a computer to randomly generate the names of five students from a complete class list of twenty students.
Systematic sampling
Systematic sampling provides a simple method of selecting the sample when the sampling frame exists in the form of an explicit list. Where the frame contains auxiliary information then the units in the frame are ordered with respect to that auxiliary data (eg employment size of a business). A fixed interval (referred to as the skip) is then used to select units from the sampling frame. Systematic sampling is best explained by describing how the sample selections are made.
| Advantages | Disadvantages |
| Ease of use | Requires a complete list of all population units |
| More accurate results | Periodicity Bias: daily sales in a supermarket are expected to peak on weekends. If the skip is calculated as 7, a bias is introduced yielding samples which are not representative of the population. |
Surveying every fifth household on a street
Stratified sampling
Stratified sampling is a technique that uses auxiliary information which is referred to as stratification variables to increase the efficiency of a sample design. Stratification variables may be geographical (eg. state, rural/urban) or non-geographical (eg. age, sex, number of employees).
Stratified sampling involves
- the division or stratification of the population into homogeneous (similar) groups called strata; and
- selecting the sample using SRS or systematic sampling within each stratum and independent of the other strata.
Stratification almost always improves the accuracy of estimates. This is because the population variability can be thought of as having components within strata and between strata. By independently sampling within each stratum we ensure each stratum is appropriately reflected in the sample, so between stratum variability is eliminated and we are left only with the within stratum component. With this factor in mind we see that the most efficient way to stratify is to have strata which are as different from each other as possible (to maximise the variance which is being eliminated) while being internally as homogeneous as possible (to minimise the variance remaining).
Practical considerations
When planning a stratified sample, a number of practical considerations should be kept in mind:
- the strata should be designed so that they collectively include all members of the target population;
- each member must appear in only one stratum, ie strata should be non overlapping; and
- the definitions of boundaries of the strata should be precise and unambiguous.
As an example of stratification, if we were interested in the educational background of members of a Science faculty at a University, we could select a sample from the faculty as a whole or select samples independently from each of the departments within the faculty, such as mathematics, physics, chemistry etc. This latter method would ensure that each department was adequately represented (which would not necessarily happen otherwise), and should increase the precision of the overall estimate.
If on the other hand, we were interested in the level of education (PhD, Masters, Bachelor) rather than the background we should stratify the faculty by level (Professor, Senior Lecturer, Lecturer) rather than by department. Using this stratification we are more likely to find uniformity of educational standards within a level rather than an area of work, and we are also more likely to separate the better-qualified from the less-qualified.
Table: Advantages and Disadvantages of Stratified Sampling
| Advantages | Disadvantages |
| Minority groups are included | Increase in costs |
| More accurate results | A danger of stratifying too finely |
| Analysis across different groups |
Number of stratas
There is no rule as to how many strata the population should be divided into. This depends on the population size and homogeneity and the format in which the output is required. If output is required for some sub-groups of the population these subgroups must be considered as separate strata.
ABS surveys
All surveys conducted by the Australian Bureau of Statistics employ stratification. Household surveys (such as the Monthly Population Survey and the Household Expenditure Survey) use geographic strata. Business surveys use variables such as state and industry strata and use some measure of size (eg employment) to form size strata.
Cluster and multi-stage sampling
So far we have considered a number of ways which a sample of population units can be selected and population characteristics estimated on the basis of this sample. In this section consideration is given to a sampling scheme where the selection of population units is made by selecting particular groups (or clusters) of such units and then selecting all or some of the population units within selected groups for inclusion in the sample.
Cluster sampling
Cluster sampling involves selecting a sample in a number of stages (usually two). The units in the population are grouped into convenient, usually naturally occurring clusters. These clusters are non-overlapping, well-defined groups which usually represent geographic areas. At the first stage of selection, a number of clusters are selected. At the second stage, all the units in the chosen clusters are selected to form the sample.
Practical considerations
- The clusters should be designed so that they collectively include all members of the target population;
- each member must appear in one and only one cluster; and
- the definitions or boundaries of the clusters should be precise and unambiguous; in the case of geographical clusters natural and man-made boundaries such as rivers and roads are often used to delimit the cluster boundaries.
TABLE: Advantages and Disadvantages of Cluster Sampling
| Advantages | Disadvantages |
| Costs can be low as not all units of the population included | Less accurate than other techniques |
Multi-stage sampling
Multi-stage sampling involves selecting a sample in at least two stages. At the first stage, large groups or clusters of population units are selected. These clusters are designed to contain more units than are required for a final sample.
At the second stage, units are sampled from the selected clusters to derive the final sample. If more than two stages are used, the process of selecting “sub-clusters” within clusters continues until the final sample is achieved.
The same practical considerations apply to multi-stage sampling as to cluster sampling.
The following is an example of the stages of selection that may be used in a three-stage household survey.
- Stage 1. Electoral Subdivisions
Electoral subdivisions (clusters) are sampled from a city or state.
- Stage 2. Blocks
Blocks of houses are selected from within the electoral subdivisions.
- Stage 3. Houses
Houses are selected from within the selected blocks.
Uses of multi-stage sampling
Multi-stage sampling is generally used when it is costly or impossible to form a list of all the units in the target population. Typically, a multi-stage sample gives less precise estimates than a simple random sample of the same size. However, a multi-stage sample is often more precise than a simple random sample of the same cost, and it is for this reason that the method is employed.
Advantages and disadvantages
The advantages and disadvantages of multi-stage sampling are similar to those for cluster sampling. However, to compensate for the lower accuracy, either the number of clusters selected in the first stage should be relatively large (but this increases the cost of the survey) or the sampling fraction for later stages should be high (i.e. a large percentage of each cluster should be selected).
River sampling and panel sampling
This section is derived from the Lehdonvirta, Oksanen, Rasanen and Blank 2020 [1] licensed under Creative Common 4.0 International (CC BY 4.0)
There are two common approaches used in non-probability online surveys. The simplest non‐probability approach to recruiting respondents online is “river” sampling, also known as intercept sampling or real‐time sampling (Olivier, 2011; Walsh et al., 1992; Yun & Trumbo, 2000, cited in Lehdonvirta, Oksanen, Rasanen and Blank 2020). The second approach is referred to as panel sampling.
River sampling means recruiting respondents by inviting them to follow a link to a survey placed on a web page, email, or somewhere else where it is likely to be noticed by members of the target population. The name refers to the idea of researchers dipping into the traffic flow of a website, catching some of the users floating by. This method is similar to the convenience or haphazard sampling method described above. A basic problem with river sampling is the coverage bias. Coverage bias occurs because not every subpopulation is represented proportionately or indeed at all in digital media (Räsänen, 2006, cited in Lehdonvirta, Oksanen, Rasanen and Blank 2020).
Panel sampling refers to the recruitment of survey respondents usually with the help of commercial non‐probability online panel providers. There are many such providers today, ranging from new startup companies to established media and research outfits such as Ipsos Mori, Qualtrics, and Survey Sampling International (SSI) (Callegaro et al., 2014a, cited in Lehdonvirta, Oksanen, Rasanen and Blank 2020). In contrast to probability‐based online panels, typical recruitment strategies of non‐probability online panels include placing ads on websites or social media and distributing invitations to newsgroups and mailing lists. Interested users opt in to become panel members, and users from multiple sources are often blended into a single panel (Lorch, Cavallaro, & van Ossenbruggen, 2014, cited in Lehdonvirta, Oksanen, Rasanen and Blank 2020). A key difference to river sampling is that the panel providers undertake to manage the demographic compositions of their respondent pools, trying to correct the biases stemming from digital medias’ uneven coverage so that the panels would be demographically similar to national populations. Online panel surveys are widely used by social scientists as well as policy consultants and think tanks. However, previous work suggests that panel surveys still systematically over-represent some groups and under‐represent others (Willems et al., 2006, cited in Lehdonvirta, Oksanen, Rasanen and Blank 2020). For instance, U.S. online panel surveys over‐represent white, better-educated, active Internet users (Chang & Krosnick, 2009; Dever, Rafferty, & Valliant, 2008; Malhotra & Krosnick, 2007, cited in Lehdonvirta, Oksanen, Rasanen and Blank 2020).
Media Attributions
- Population sample © Parliament of Australia is licensed under a CC BY-NC (Attribution NonCommercial) license
- Lehdonvirta, V, Oksanen, A, Rasanen, P and Blank, G, 'Social media, web and panel surveys; using non-probability samples in social and policy research', Policy and Internet journal, vol. 13, no. 1, pp. 134 - 155. ↵
