2 What is Crime? Defining and Measuring Criminal Behaviour
David Bartlett
Learning Objectives
- Explain how crime is defined and identify the primary sources of crime data and explain their strengths and limitations.
- Identify key factors that affect the interpretation of various crime statistics.
- Understand how different sources of crime data can be drawn upon to address crime related questions.
Before You Begin
- Take a moment to think about the last time you heard someone talk about crime. Did the speaker make broad statements about crime, like maybe it was going up? How did that make you feel?
- Are you confident that everything you think is legal really is legal?
- Can you think of anything in your lifetime that has changed status from illegal to legal? Or the other way around?
INTRODUCTION
Crime is simple, yet complex, to define. One could simply ask ‘Is it a breach of the law?’ If yes, then it’s a crime. If no, then it is not a crime. There are, however, a number of complexities in that approach, along with a range of alternate definitions. Understanding these is important; how we define crime has implications for how it is measured and in turn how it is reported. Changes in the number and rate of reported crimes, particularly increases in crime, can generate considerable political and media attention. This can lead to a range of flow-on effects, including increased community fear of crime and resulting changes in behaviour. For example, some people may start to avoid a geographic area which has been reported to be experiencing an increase in crime. Yet someone’s risk of being a victim of crime may not have changed. The ability to access and interpret crime data is fundamental to understanding and making informed decisions regarding crime.
This chapter explores the ways in which crime can be defined and measured. In doing so, it highlights the nuances that impact the collection and reporting of various crime statistics. The key aim of this chapter is to help you become a sophisticated consumer of crime data.
What is crime?
Crime can be defined multiple ways. In this section we explore three sources of crime definitions:
- Dictionary definitions
- Harm-based and human rights definitions
- Legal definitions
When searching for a definition of crime one could simply consult a dictionary. While dictionary definitions may vary, they often share commonalities. As Ransley and Prenzler (2020) highlight, most dictionaries identify crimes as acts or omissions that:
- cause public harm
- are forbidden by law
- are punishable by law
In their analysis of dictionary definitions Ransley and Prenzler (2020) argue that they suffer from three key deficits:
- they exclude harmful behaviours that are not punishable by law
- they encapsulate behaviours that are forbidden by and punishable under law, but cause no public harm
- concepts of what constitutes public harm varies across cultures, geographic regions and time
Dictionary definitions therefore present significant challenges for defining crime.
Harm-based and human rights definitions are also challenging when it comes to defining crime. A harm-based definition would, for example, see a mother’s consumption of alcohol in pregnancy as a crime if it resulted in the child acquiring Foetal Alcohol Spectrum Disorder. However, is it fair and just to treat this as a crime when the mother may have consumed alcohol early in the pregnancy, before she was even aware she was pregnant? Moreover, the research evidence and medical advice in respect of safe alcohol limits has changed over time (Dejong et al., 2019). Similarly, what constitutes human rights changes over time and across jurisdictions. A comparison of country reports on human rights shows there to be considerable variation between countries, even our Pacific region neighbours, in terms of what constitutes a human right. At a practical micro-level, how are we to resolve who the ‘offender’ is in a situation where two parties are exercising competing rights – whose right is more important or takes precedence?
Legal definitions, with their focus on acts or omissions that render a person liable to punishment, provide greater clarity as to whether a particular behaviour is a crime. However, it is important to note that legally the term ‘crime’ is often reserved for the most serious criminal offences. Other types of offences not usually defined legally as ‘crimes’ include traffic offences, corporations law offences, regulatory offences relating to the operation of businesses, and less serious criminal offences. However, it is common for people, including criminology researchers, to use the term crime to mean all offences at law.
For the remainder of this chapter crime is defined by the legal definition and includes all types of offences regardless of seriousness.
Crime is Social
Crime is a social construction. That is, a behaviour is deemed to be a crime only after a law is passed to render the commission or omission of that action unlawful. In determining which behaviours to make unlawful lawmakers consider cultural factors and the prevailing community values and interests (Findlay, Odgers & Yeo, 2010). Behaviours deemed to be criminal therefore vary between jurisdictions and over time.
There are some behaviours for which there is little variation across jurisdictions and time periods. These are often termed ‘core crimes’ and include offences such as murder, assault, sexual assault, robbery, kidnapping and theft which are universally regarded as morally wrong (Ransley & Prenzler, 2020). While these offences have longevity in being regarded as crimes, in some jurisdictions there have been changes in societal attitudes that have led to the legislating of defences (e.g., domestic violence related defences to murder of an abusive spouse or partner).
There is often far less public agreement, and therefore greater variability in attitudes, on other types of behaviours. The result can lead to significant differences between jurisdictions in terms of the lawfulness of behaviour. Take differences between jurisdictions in the age of consent. In Victoria, the age of consent for sexual activity between consenting parties is 16 years. Yet in neighbouring South Australia, the age of consent is 17 years. The practical implications and consequences of that variation for young couples can be significant. Consensual sexual activity between the same young couple may, depending upon which side of the state border they are, render the older partner liable to prosecution for a sexual offence. However, the decision to charge the 17-year-old likely will come down to police discretion.
The socially constructed nature of crime means that the behaviours which are criminalised can change over time. Ransley and Prenzler (2020) identify four primary sources of change in the criminal law:
- social change (e.g. recognition of coercive control and domestic violence)
- technological change (e.g. new crimes relating to ‘revenge porn’)
- evolving morality (e.g. enabling voluntary assisted dying for people who are terminally ill)
- law reform programs (e.g. decriminalising possession of non-prescribed drugs in some jurisdictions)
Changes in which behaviours are criminalised can have significant effects on crime statistics. Take, for example, a change in the law to decriminalise possession of drugs. In Queensland in 2021/22 there were 61,909 recorded drug offences, of which 28,325 offences were for possession of drugs (Queensland Government Statistician’s Office, 2023). If all other factors remained constant, passing a law to decriminalise possession of drugs would reduce recorded drug offences by 45.8%.
Measuring Crime
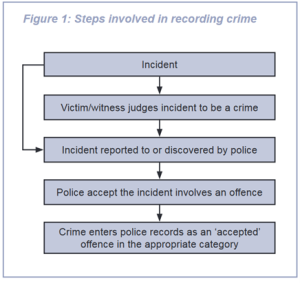
Administrative data collected by criminal justice agencies is our most common source of crime data and knowledge. In particular, police data on recorded crimes is one of the most frequently cited sources of crime statistics. However, it is important to remember that not all offences that are committed are recorded. As Figure 2.1 shows, there are a number of steps that determine whether a matter becomes a recorded crime.
Criminologists reply upon a range of other data sources to ascertain the extent of the dark figure of crime. The most commonly relied upon source are victimisation surveys. These surveys typically ask people whether they have been a victim of crime in a prescribed period, often the last 12 months, and whether they reported the crime to the police. Since 2008 the Australian Bureau of Statistics has conducted an annual crime victimisation survey. Similar surveys exist in other jurisdictions including New Zealand, the United Kingdom, Canada and Korea. Criminologists sometimes draw upon other sources of data, such as ambulance calls for service data and hospital admission data, to gauge the extent of violent crime in a locality. Additionally, technological innovations have created new opportunities to collect data on crime; for example the Australian Criminal Intelligence Commission operates a waste water monitoring program to understand trends in drug use.
Researchers sometimes differentiate between reported crime and recorded crime. Reported crimes are typically those that have a victim and are reported to the police by the victim or a witness (e.g., assaults and thefts). Many other types of offences, such as drug and traffic offences are detected by police. Recorded crimes are those that have been officially recorded by police, either after being reported to or detected by police. Crimes that are not recorded by police form part of what criminologists refer to as the dark figure of crime.
Safer inside: Comparing the experiences and risks faced by young people who couch-surf and sleep rough
Katie Hail-Jares, Rhianon Vichta-Ohlsen, & Caitlin Nash
Published in Journal of Youth Studies (2021). Volume 24, Issue 3, pages 305-322.
Homelessness and unstable housing among young people have risen due to the current cost of living crisis and global economic downturn, with a particular increase in reliance on couch-surfing. The literature review conducted for the study found that there were varying definitions of youth homelessness, resulting in limited empirical knowledge regarding the prevalence and impacts of couch-surfing amongst young people. The study also found that many young people do not consider couch-surfing a form of homelessness and that overall comparisons of the risks to other forms of homelessness is not generally understood.
The research aimed to describe the characteristics of young people who are sleeping rough, couch-surfing, or other accommodation and compare the risk factors between those who are rough sleeping to those who are couch-surfing, as well as compare the risk factors of rough-sleepers to all other young people utilising homelessness services.
Data was collected from Brisbane Youth Service (BYS), totalling a sample of 808 records. BYS is a non-governmental organisation that operates a youth-specific service. The data was selected as it provides a fairly in-depth insight into what issues a young person may be experiencing, including their living arrangements. Whilst this study compared couch-surfers and rough-sleepers to fill the gap in the knowledge, limitations were identified in using cross-sectional data and no record of the duration of the young person’s current living situation. The researchers suggest future studies should use a life-calendar approach to housing to obtain more accurate information.
Findings from the research concluded that couch surfers are more likely to be female, have limited community support, reported poor mental health, and had more serious histories of self-harm. Other findings were in line with previous research where couch-surfers may not identify as homeless or feel that services or organisations do not meet their needs. There is a perception amongst the respondents that service providers view couch-surfing as less critical than rough-sleeping. As couch-surfers are not as visible as rough-sleeping, their situation is often perceived as needing fewer support than those sleeping in public spaces.
Recommendations include that homelessness services classify couch-surfing as critical due to the risk factors faced by those engaging in it. Support programs need to adapt risk assessments for couch-surfers that respond to identified patterns or risk and use targeted harm reduction practices in providing support. It is important to identify all forms of youth homelessness and broaden the knowledge around the differences in couch-surfing and rough-sleeping to identify the risks and needs of young people who are experiencing homelessness.
A summary by Melissa Osborn
Offender surveys collect data to help us understand offenders’ self-reported frequency of offending, offence characteristics and offending trajectories. Surveying offenders can be helpful in understanding the dark figure of crime, developing crime prevention strategies and identifying factors that lead to desistance from offending. Offender surveys are typically performed as part of specific research projects rather than as part of routine crime data collections. One Australian exception is the Australian Institute of Criminology’s Drug Use Monitoring in Australia (DUMA) program which has been surveying police detainees since 1999.
Population surveys are a further means of quantifying the dark figure of crime. These self-report surveys sample large numbers of people about their engagement in particular behaviours. Typically they are targeted to particular groups of people, such as young people, or particular issues. One such survey is the Australian Institute of Health and Welfare’s National Drug Strategy Household Survey which was last conducted in 2019.
Often overlooked in crime data are white collar crimes committed by corporations and businesses. Responsibility for investigating and prosecuting those offences is within the jurisdiction of a plethora of regulatory agencies. In Australia these include the Australian Securities and Investments Commission, Australian Competition and Consumer Commission, Fair Work Ombudsman and state and territory based workplace health and safety regulators. In many jurisdictions including Australia each regulatory agency maintains and reports their own data. The absence of a single dataset means that the extent of white collar crime committed by corporations is largely unknown (Bartlett et al., 2020).
Corporate Crime in Australia: The Extent of the Problem
David Bartlett, Ransley, Janet, Lucy Forrester, and Kristine Middendorp
Corporate crime has the capacity to cause harms at both the societal and individual level and it is becoming an important concern for the governments and the public. This study identifies two main gaps within the current literature; the lack of research on the offending behaviours of corporate offenders and the lack of research that measures parent and their wholly owned subsidiary companies as one entity. This aimed to close these gaps within the current literature with the final goal of examining the extent and context of offending and seeking to assess the offending behaviours of corporations within Australia.
Data for this study was consolidated from four primary national regulators; ASIC, the ACC, the ATO and the FWC/FWO. A cross-sectional study was conducted to examine the offending and regulatory actions taken against Australia’s largest corporations and their wholly owned subsidiary corporations that were publicly listed in the Australian Securities Exchange’s ASX200 index from the beginning of January 2010 to the end of December 2015. The total sample contained 1,941 corporations which was comprised of 33 parent corporations and 1,908 subsidiary corporations.
The results of this study indicate that corporate crime is patterned and not evenly distributed with corporate offending being concentrated in specific industry sectors such as financial services, utilities, and consumer staples sectors. In addition, the results show that corporate offending is concentrated in wholly owned subsidiary companies with many of the offences being related to market integrity, misleading representations, and deceptive conduct. This study also found that actions taken in response to offending varied by industry sector however, these variations may be due to the different regulatory styles being enforced to different industries.
The most important improvement to policy and practices that was suggested by the researchers would be to establish a national database for corporate offending. This national database would allow Australian regulators to have access to a company’s overall history thus allowing the appropriate enforcement sanctions to be applied which would help increase deterrence and decrease rates of corporate crime within Australia. It would also improve transparency, which would assist regulatory agencies in monitoring and capturing offending companies. Furthermore, the transparency would increase the ability for third parties to undertake due diligence upon their commercial partners thus promoting ethical business practices.
In conclusion, according to the researchers, this study was the first empirical study to examine corporate crime across multiple different industries and regulatory agencies whilst also including subsidiary offending data within Australia. While there were limitations in the study, most of which resulted from the sampling data, the researchers did acknowledge that there is a possibility that the results of this study were not naturally present but only occurred because of this investigation. Therefore, more research into this area would be required to further corroborate these results. Nevertheless, one of the most important findings from this study is the lack of coordination between different regulatory agencies and the need for a national database of corporate offending.
Summary by Natasha Smith
The remainder of this chapter is dedicated to understanding the nuances of criminal justice agency data and the highlighting the dedicated crime and justice research agencies that exist in Australia.
Criminal Justice Agency Statistics
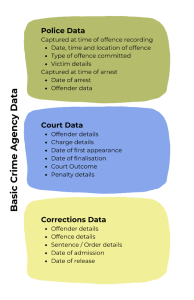
Agencies forming the three arms of the criminal justice system – police, courts and corrections – collect administrative data for the purpose of discharging their functions, for example:
- police collect data on the date, time, location and type of offences committed so they know where to deploy resources to solve crimes and prevent further offending.
- courts collect data to assist in managing workloads.
- corrective services collect data to assist in managing the offender population.
Each agency collects a plethora of administrative data. Figure 2.2 shows the basic types of data often collected by each agency. While that data is collected largely for agency management purposes, it also provides us with rich data on various dimensions of crime and crime trends. However, with offences varying between jurisdictions depending upon which behaviours have been criminalised, comparisons of crime data between different State, Territories and countries can be difficult.
To resolve this challenge, in 1997 the Australian Bureau of Statistics published the Australian and New Zealand Standard Offence Classification (ANZSOC) as a framework for classifying offences and producing national standardised crime statistics. Similar classification frameworks exist in other jurisdictions, for example the Uniform Crime Reporting program operating in the United States.
The ANZSOC framework classifies crime into 17 categories. Those categories can be further aggregated to produce broader categories such as crimes against the person (also referred to as violent crime) and property crime.
Since development of the ANZSOC, the Australian Bureau of Statistics has produced national crime statistics that enable researchers to broadly compare crime data over different time periods and jurisdictions. However, in comparing offence counts between jurisdictions it is important to always be alert to jurisdictional differences; for example, different ages of consent means that the same behaviour is criminal in one jurisdiction but lawful in another.
Jurisdictions also vary in population. With crime being the result of human behaviour, population size differences often affect the volume of committed crime. In western liberal democracies in particular, as the population increases so too does the number of offences. Put simply, the higher the population the more likely it is that there will be people who will offend and consequently the higher the number of offences. Even within jurisdictions and localities the population rarely remains consistent over time, making it challenging to compare crime across different time periods.
To overcome the challenge of different population sizes, criminologists standardise the data. This is typically done by comparing the rate of offending as opposed to the number of offences. The rate of offending creates a standardised measure of crime to enable fair comparisons between different jurisdictions and time periods. Figure 2.3 shows how to calculate a rate of offending and demonstrates the importance of utilising the rate of offending as opposed to offence counts where comparing different localities.
While usually applied to the population as a whole, rates may also be calculated for specific age groups. As Chapter 3 will highlight, crime is typically committed by younger people. Unsurprisingly then, localities with a higher proportion of younger people generally have more crime than those with a predominantly older population. Examining the age structure of a population and calculating crime rates for each age group can give a more nuanced measure of crime in a locality and how it changes over time.
Figure 2.3: Where is crime higher?
In 2021/2022, the Queensland cities of Cairns and Gold Coast had a similar number of recorded offences; Cairns = 6,258 and Gold Coast = 6,359. Based upon these numbers, some people would conclude that the Gold Coast had a slightly higher amount of crime.
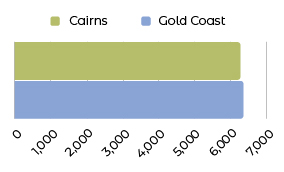
However, the Gold Coast has a much higher population.
Converting the number of offences to a rate per 100,000 of the population standardises the number and enables a fair comparision.
The formula to calculate a rate per 100,000 population is: [Number of Offences / Population] x 100,000.
When the size of the population is taken into account, Cairns has a higher crime rate than the Gold Coast.
Cairns = 2,431.6 offences per 100,000 population
Gold Coast = 973.9 offences per 100,000 population
It is important to note that the Population used is the equation is the resident population. This presents a ch allenge for interpreting the rate of offending. In some areas, a high number of visitors and tourists means there are far more people (and potential offenders) in the area. Yet the number of offences is divided by only the resident population. This tends to produce a rate of offending much higher than would be expected for the size of the locality.
Data source: Crime Report, Queensland, 2021-2022.
Four other factors should be considered when comparing crime data over different jurisdictions and time periods: policing practices, victim reporting, counting rules and temporal variation.
Policing Practices
Policing practices and technologies can significantly influence the volume of recorded crime in a locality. Consider the impact of increased policing resources being devoted to a specific area. Increases in both police officer numbers and the frequency of patrols increase the chances of police detecting offences. This in turn results in more recorded offences. While the actual number of offences being committed in the locality may be stable, the increased police detection serves to increase the volume of recorded crime. This may occur infrequently, such as when police run dedicated operations targeting a particular area or type of behaviour.
Even very temporary increases in police numbers or targeted operations can have a noticeable impact on crime statistics. These police activity driven increases in recorded offences can lead to public concern about a crime problem when the actual volume of crime occurring in the area has not changed. Researchers have highlighted that some communities, particularly First Peoples communities, have a higher police-to-citizen ratio than other communities leading to criticism that those communities are over-policed (Cunneen, 2019). That is, the proportionately higher numbers of police in those communities leads to increased offence detection and high numbers and rates of offending in the police recorded crime data.
Technological advances have also served to increase police ability to detect offences. In some localities monitored CCTV networks in public places increase surveillance with control room operators reporting offences and in real time and directing police to the offender. Automatic number plate recognition technologies fitted to police vehicles enable police to easily detect unregistered vehicles, along with unlicensed and disqualified drivers. Drug detection dogs enable police to quickly and effectively identify people carrying drugs within a crowd. Adoption of these and other technologies all serve to increase detection and in turn the recording of offences.
How the police count and respond to reported offences can also significantly impact recorded crime statistics. Offences are counted in police recorded crime data at the time of recording, not the date of offence. A sudden increase in victims reporting of historical offences to police can therefore produce a spike in the current year’s crime statistics. Consider for example the significant increase in reported sexual offence victimisation between 2011 and 2017. During that period, police recorded sexual assault victimisation in Australia increased 26% from 83.3 to 105 per 100,000 (Australian Bureau of Statistics, 2023). However, this increase in reported sexual assault needs to be understood in context of the prevailing social situation. Between 2013 and 2017, the Royal Commission into Institutional Responses to Child Sexual Abuse was in operation conducting hearings throughout Australia and making 2,575 referrals to authorities including the police. With much of the royal commission’s work focused on historical matters, a significant proportion, if not all, of those referrals related to historical offending. Consequently, as the Australian Institute of Health and Welfare (2020) notes, it is unclear whether the steep increase in reported sexual assault victimisation during that period reflects an actual increase in sexual assaults, the increased reporting of historical crimes or some other explanation.
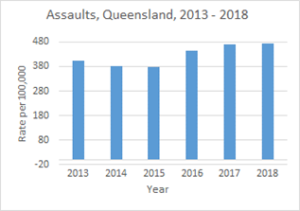
Changes in policing practices can also impact recorded crime statistics. In Queensland between 2015 and 2016 there was a 16.9% increase in the number of recorded assaults, which continued to increase over subsequent years (Figure 2.4). This increase is in part likely attributed to implementation of the recommendations of the Special Taskforce on Domestic and Family Violence in Queensland which, in its 2015 report Not Now, Not Ever, recommended increased criminal prosecution of domestic violence offenders. This was in stark contrast to the previous practice where police responded only by seeking a domestic violence protection order against the offender. This change in practice served to bring some of the dark figure of crime into the recorded police offence data.
Changes in counting rules can also serve to reduce the number of recorded offences. In January 2002, the Queensland Police Service changed its counting rules to not count wilful damage offences if they were ancillary[1] to an unlawful entry offence (Queensland Police Service, 2010). Many break an enter offences are facilitated by performing some act of damage, such as breaking a window or door. Prior to January 2002 both the wilful damage and break and enter offences were counted in the recorded crime data. However, with the 2002 change in counting rules, the number of wilful damage offences decreased 31.6% compared to the prior year, down from 1,736.45 to 1,187.31 per 100,000.
Victim Reporting
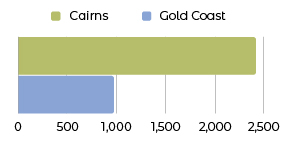
Variations in victims’ willingness to report offences also affects recorded crime. These variations can have a significant impact upon the number of recorded offences. The range of factors influencing whether or not victims report to police include: fear of repercussion; victim perceptions of the seriousness of offending; the relationship between the victim and offender; perceptions of police; demographic; and, cultural factors (Xie & Bumer, 2019). Figure 2.5 shows how variations in victim reporting can impact recorded offences and give the appearance that crime is increasing or decreasing.
Figure 2.5: Victim Reporting and Crime Statistics Impacts
Changes in the number of victims reporting their victimisation to police can give the appearance of increases or decreases in crime over time. In 2012/13, the ABS Crime Survey reported a substantial reduction in the proportion of assault victims reporting the offence to the police.
| Year | Told Police | Didn't Tell Police |
|---|---|---|
| 2010/11 | 50.7 | 49.3 |
| 2011/12 | 49.0 | 50.4 |
| 2012/13 | 37.2 | 62.8 |
| 2012/14 | 51.5 | 47.0 |
| 2014/15 | 54.7 | 45.1 |
| 2015/16 | 54.9 | 45 |
| 2016/17 | 53.8 | 45.5 |
| 2017/18 | 51.8 | 47.6 |
A reduction in victim reporting serves to reduce the number of recorded offences. Conversely, an increase in the proportion of victims reporting to the police leads to increases in recorded crime.
If each year there were consistently 100 assaults per year, and the only thing that changes was whether or not the victims reported to the police, the trend in recorded assaults for 2010/11 to 2017/18 is:
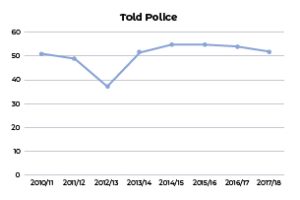
However, the 38.4% increase in assaults between 2012/13 and 2013/14 is attributed solely to an increase in victim reporting, not an increase in actual assaults.
Data Source: Australian Bureau of Statistics, Crime Victimisation, Australia 2010/11 – 2017/18.
Counting Rules
When publishing reported offence data some agencies only publish the most serious or principal offence. It is not unusual for a person to be charged with multiple offences from a single event. Consider the case of an offender who breaks into a home and then uses the resident’s car keys to steal their motor vehicle. Two offences have occurred: break and enter and unlawful use (stealing) of the motor vehicle. However, in publishing crime data some agencies and publications will only record the most serious of the two offences. In Australia, the principle offence is determined according to the Australian Bureau of Statistics’ National Offence Index which ranks offence categories contained in the ANZSOC.
Finally, it should always be remembered that offence data is a count of offences, not offenders. One of the iron laws of criminology is that a relatively small proportion of people are responsible for the majority of offences. This is often expressed by reference to the Pareto Principle, or 80-20 rule, which in criminology holds that 20% of offenders will be responsible for 80% of offences. While the actual percentages may not be 80-20, research consistently finds that a large proportion of offences are committed by a comparatively small number of people. In very recent times this has led to some jurisdictions publishing data on unique offenders. The Queensland Government Statistician’s Office (2023) has recently adopted this practice and for the 2021/22 year found that the 524,145 recorded offences were committed by only 102,849 unique offenders.
Temporal Factors
Adding further complexity to our interpretation of crime data is the often-observed seasonality in crime, along with changed social conditions. Two commonly observed trends in recorded data are the increase of violent crime during summer months and increase in property crime during school holiday periods. Seasonal variations in crime render comparisons of crime statistics over short time period problematic. For that reason, criminologists often examine crime statistics over longer time periods, typically years, to ensure that seasonal effects are appropriately considered. Changed social conditions, for example those experienced during COVID-19 lockdowns, can also result in changes in the type and volume of crime committed.
Changes in crime and crime trends in response to COVID-19 lockdowns is currently fertile ground for criminological research. While changes in recorded crime may be an artefact of the data measurement and collection process, it may also be that the actual number of offenders and offences committed has increased or decreased in response to seasonal and social factors.
Court Data
Courts also collect administrative data to manage their organisational functions. In almost all cases offender charge data from police and other prosecting agencies, such as regulatory agencies, are transmitted initially to Magistrates Courts (referred to as Local Courts in some jurisdictions) and Children’s Courts. The majority of defendants are finalised in these lower courts. This is because the majority of offending is less serious in nature. More serious offences are transmitted to higher courts which incorporated the Supreme Court and intermediate courts (such as the District Court, referred to the County Court in Victoria).
Court data provide insights into how defendants progress through the court process. In 2021/22, 488,936 defendants were finalised in Australian courts (Australian Bureau of Statistics, 2023). While the vast majority of defendants are adjudicated, a sizeable proportion are not. In 2021/22 for example, 11.9% of Magistrates Court and 14.4% of Higher Courts defendants were not adjudicated. Non-adjudication arises from circumstances such as the prosecution withdrawing the charge or the charge being transmitted to another court. Of adjudicated offenders, the majority plead or are proven guilty. In 2021/22, 79% of adjudicated defendants with a guilty outcome had pleaded guilty.
Where significant variation arises between courts is in the penalty. The vast majority of Magistrates Court and Children’s Court defendants receive a non-custodial penalty. In the Magistrates Court this is usually a monetary fine. However, consistent with higher courts determining the most serious offences, the majority of defendants finalised in those courts receive a custodial sentence. Of all defendants finalised in 2021/22, only 10% of defendants were sentenced to a custody sentence within a correctional centre.
Similar to police data, there are a number of nuances to consider when interpreting court data. First, court data typically reports the number of finalised defendants. Remembering that a relatively small proportion of offenders commit a large proportion of offending, those offenders will have multiple court finalisations with each adding to the count of finalised defendants. Therefore, the actual number of unique defendants finalised by courts will be less than the data indicate. Court finalisation data is also typically reported for the principal offence for each finalisation rather than all finalisations. It is important to remember that court finalisation data relates to all prosecutions, not just those brought by traditional law enforcement bodies. Prosecutions brought by regulatory agencies, local governments and others with responsibility for enforcing criminal and quasi-criminal matters are all captured in court finalisation data. The Australian Bureau of Statistics publishes its Criminal Courts, Australia series annually to provide national and jurisdictional specific court data.
Courts may also collect and publish non-criminal court data that helps to understand the dark figure of crime. In jurisdictions where domestic violence is treated as a civil matter, where finalisation is by a protection order rather than a penalty, some courts publish data on the number of orders made.
Corrections Data
Where a court finalisation occurs by way of an imprisonment order or community-based corrections order such as probation or community service, details of the defendant and penalty appear in corrections data. The population of offenders in custody or under corrections supervision is constantly changing. On an almost daily basis, new defendants are sentenced and those who have completed their sentence are released from custody or complete their court-imposed orders. The total number of people who have been incarcerated during a year can therefore be much greater than the prison population at any given point in time. This is particularly true when a high proportion of prisoners are serving a short sentence.
In Australia two sets of national corrections data are published. To provide an annual snapshot of the corrections population, prisoner census data as of 30 June each year is published by the Australian Bureau of Statistics in its Prisoners in Australia series. However, to understand the fluctuations that occur within a 12-month period, many jurisdictions, including Australia and New Zealand, publish quarterly corrections statistics. The Australian Bureau of Statistics publication Corrective Service, Australia illuminates the fluctuation of prisoners and people under community-based corrections order by providing the number of receptions and releases in the quarter.
Corrections data collections typically provide criminology researchers two important data metrics: the rate of imprisonment and proportion of prisoners who return to custody. As discussed earlier, increases in population often lead to an increase in police recorded offences. This results in increases in recorded offences, more people being adjudicated by courts, and an increase in the corrections population. To meaningfully compare corrections populations over time and between different jurisdictions the rate of prisoners per 100,000 adult population is often calculated. Similar to the formula for calculating the rate of offences, the rate of imprisonment is calculated by dividing the average daily prisoner population by the adult population and multiplying by 100,000.
Rehabilitation is one of the core functions of corrections in western liberal democracies. To achieve that goal, correctional agencies invest in a wide range of programs and activities designed to address offender’s criminogenic needs. Performance against that goal is commonly measured by the proportion of prisoners who have a prior prison experience. Prisoners in Australia, 2023 data shows that 61% of Australian prisoners in custody on 30 June 2023 had a previously been in prison.
Crime and Justice Research Agencies
In addition to criminal justice agencies publishing their administrative data and the Australian Bureau of Statistics consolidating those data to produce a national picture, a number of governments have established dedicated crime and justice research agencies. In Australia the first federal government crime research entity was the Australian Institute of Criminology, established in 1973. Since that time state based crime and justice research entities have been established in jurisdictions including:
- New South Wales with its Bureau of Crime Statistics and Research (BOCSAR)
- Victoria with its Crime Statistics Agency
Other jurisdictions have established dedicated crime research functions as business units of agencies separate from the criminal justice agencies.
Having dedicated crime and justice research functions outside of individual criminal justice agencies has a number of benefits, including the ability to take a system-wide perspective, along with the capability and capacity to explore specific crime issues and trends. Take research on homicides as an example. Each State and Territory’s police service collects data on recorded homicides and publishes basic information such as the number of recorded homicides, along with date and location information. The Australian Bureau of Statistics consolidates that information at the national level and provides additional details such as consistent location categories. However, the Australian Institute of Criminology through its National Homicide Monitoring Program accesses agencies’ data holdings to provide additional contextual information at the national level on factors including weapon use, offender-victim relationship, alcohol and drug use in the offence, mental health and criminal histories of offenders.
Limitations of Quantitative Data
All data and research have limitations. As this chapter highlights, crime is measured quantitatively and categorised by reference to offence definitions and the ANZSOC offence classification scheme. This process masks qualitative differences that may occur between offences within the same category. To illustrate this point, consider these two unlawful entry scenarios. In the first scenario the offender breaks into a house during daylight hours by opening an unlocked door while the occupants are absent at work. In the second scenario the offender forces entry to a house at night while the occupants are home and asleep. In both scenarios the offender has committed an unlawful entry, which would be counted and considered as equivalent offences in the data. However, in these scenarios the level of impact that the offending has upon the victim may be substantially different. In response to challenges such as this, researchers are increasingly exploring the use of crime harm indexes as a means of measuring crime (van Ruitenburg & Ruiter, 2023).
CONCLUSION
Crime measurement and the interpretation of crime statistics is complex. Fluctuations in crime statistics, particularly sharp increases, can be a source of significant community concern. However, as this chapter has highlighted, fluctuations can result from many sources, which do not necessarily result from an actual increase in offending. Indeed, teasing apart the source of the variation to identify the underlying reason – whether it is an artefact of changed policing practices, the data collection and reporting process, victim reporting, or sometimes a genuine increase in offending – can be challenging. However, when hearing of increases in crime the savvy consumer of crime statistics is more likely to respond with “that’s interesting,” followed by an inquisitive examination of the data, rather than immediate concern. While this chapter has focused on understanding the nuances of crime data which give the appearance of their being increases or decreases in crime, it must be remembered that the actual level of crime in society often does change over time. Other chapters in this text will explore some of the criminological theories and factors that can produce actual changes in crime.
Check Your Knowledge
Discussion Questions
- How might social and historical factors affect crime trends in the next five years?
- How can it be there is a reported 35% increase in violent crime, yet the number of crime victims has not changed?
- Name three common errors that people and the media make when talking about increases in crime?
REFERENCES
Australian Bureau of Statistics. (2023). Criminal Courts, Australia, 2021 – 2022. https://www.abs.gov.au/statistics/people/crime-and-justice/criminal-courts-australia/latest-release
Australia Bureau of Statistics. (2023). Recorded Crime – Victims, 2022. https://www.abs.gov.au/statistics/people/crime-and-justice/recorded-crime-victims/latest-release
Australian Institute of Health and Welfare (2020). Sexual assault in Australia. https://www.aihw.gov.au/reports/family-domestic-and-sexual-violence/sexual-assault-in-australia/contents/summary
Bartlett, D., Ransley, J., Forrester, L., & Middendorp, K. (2020). Corporate crime in Australia: The extent of the problem. Trends & issues in crime and criminal justice no. 613. Australian Institute of Criminology. https://doi.org/10.52922/ti04817
Cunneen, C. (2019). Criminalisation and Policing in Indigenous Communities. In L. Behrendt, C. Cunneen, T. Libesman and N. Watson (Eds.) Aboriginal and Torres Strait Islander Legal Relations (2nd Ed) (pp. 89 – 107). Oxford.
Dejong, K., Olyaei, A., & Lo, J. O. (2019). Alcohol use in pregnancy. Clinical obstetrics and gynecology, 62(1), 142 – 155. doi: 10.1097/GRF.0000000000000414
Findlay, M., Odgers, S., & Yeo, S. (2010). Australian Criminal Justice (4th ed.). Oxford University Press.
Queensland Government Statistician’s Office. (2023). Crime report, Queensland, 2021–22. Queensland Treasury.
Queensland Police Service. (2010). Annual Statistical Review 2009-2010.
Ransley, J., & Prenzler, T. (2020). Defining Crime. In H. Hayes and T. Prenzler (Eds.), An Introduction to Crime and Criminology (5e) (pp. 17 – 34). Pearson Australia.
van Ruitenburg, T., & Ruiter, S. (2023) The adoption of a crime harm index: A scoping literature review, Police Practice and Research, 24(4), 423-445, DOI: 10.1080/15614263.2022.2125873
Weatherburn, D. (2011). Uses and abuses of crime statistics. Crime and Justice Bulletin: Contemporary Issues in crime and justice no. 153. NSW Bureau of Crime Statistics and Research. https://www.bocsar.nsw.gov.au/Publications/CJB/cjb153.pdf
Xie, M., & Baumer, E.P. (2019). Crime Victims’ Decisions to Call the Police: Past Research and New Directions. Annual Review of Criminology, 2, 217-240. https://doi.org/10.1146/annurev-criminol-011518-024748
- This means that if an alleged perpetrator was going to be charged with an unlawful entry offence, then they would not also be counted as having a willful damage offence. ↵
surveys that ask individuals about their personal experiences with victimisation
