3 Victims and Offenders
Jeffrey Ackerman and Marianne Haaland
Learning Objectives
- Be able to understand the trends in offender characteristics and the potential relationship between these characteristics and criminal behavior.
- Be able to understand the trends in victim characteristics and the potential relationship between these characteristics and criminal behavior.
- Critically assess the concept of the “victim-offender overlap” and be able to begin to hypothesise reasons for this experience.
Before You Begin
- What was the last crime film you saw? Think about the characteristics of the offender. Did they seem like someone you wanted to hang out with?
- What about the victim? Would you be their friend?
- How do these media depicted images of offenders and victims affect your thinking about how to prevent crime? Rehabilitate individuals who commit crime?
INTRODUCTION
When you think about the word “criminal,” what image do you see? Many university students studying criminology and criminal justice have visions of people who look like the law-breakers depicted in popular television shows or movies. Many fictional criminals in the entertainment industry are middle-aged (35 to 60 years of age), attractive and smart. They are often sophisticated, drive expensive cars and wear expensive clothes. They often have elaborate plans to steal great fortunes in bank robberies, armored car heists or complex financial transgressions. Or we see the polar opposite: people with a disheveled appearance, wearing gritty clothes, who come from a troubled background. These fictional criminals may be engaged in organised crime, drug dealing or other street-level crimes. If we go back in time a few decades, these fictional criminals were mostly men. More recently, however, the entertainment industry has depicted women in these criminal mastermind roles[1]. And in most cases, fictional female criminals are depicted as very attractive, impeccably dressed villains who use their charm and allure as part of their criminal persona.
Along with showing devastatingly attractive police and criminals, television shows and movies depict elaborate “cat-and-mouse” games where detectives and criminals try to outsmart each other during intricate investigations and complex legal battles. Victims, detectives and witnesses are depicted as “good” in most ways, while offenders are depicted as “bad” or “evil.” The sharp good/bad distinctions between television criminals and their victims tends to remain stable over time. In other words, once a fictional young person decides to become an offender, they continue to offend as they get older, regardless of what changes in their lives. For example, movies sometimes start with a criminal being released from prison only to rapidly return to their life of crime[2]. These various fictional depictions imply that solutions to crime primarily involve hiring smarter detectives and longer prison sentences for offenders.
When most people think about a “criminal” they don’t envision a criminal looking like themselves – perhaps a young adult (17 to 24 years old) who could come from a wide variety of backgrounds. Most people also don’t envision someone who has committed an offense or two when young, but goes on to lead crime free life as they enter adulthood.
The accuracy of these different versions of a typical criminal has important policy implications for the criminal justice system. For example, should a government spend more tax money detaining young offenders for long periods of time, should it fund more prevention initiatives for young children, or should it concentrate upon the rehabilitation or incapacitation of known offenders? How does it decide?
In this chapter, we discuss the reality of the characteristics that appear among individuals who commit crime. Criminologists sometimes call these “predictors” of crime or “risk-factors” of crime (or the opposite – “protective-factors”)[3]. As an example of what a criminologist means by a predictor or risk-factor of crime, imagine selecting 100 people at random and dividing them into two groups based upon who has committed a crime and who has not. Also imagine that 15 people committed crimes while 85 did not. Which characteristics (like biological sex and age) would we find more frequently among the offender group and which would we find more frequently among the non-offender group? It is likely that males would be about 80% of the offender group, while females only 20%. Young adults would likely make up around 60% of the offender group while people over the age of 40 might comprise only 10% of the offenders.
In these cases we might say that being male and a young adult are risk-factors, while being over 40 years of age and female are protective-factors. Both types of differences might be called “predictors” or “correlates” by an academic criminologist, who might also proclaim that there was a “correlation,” “association,” or “relationship” between these factors and crime.
We will look at the major risk and protective factors now. As we do, keep in mind that no one is destined to commit crime just because she or he possess one or more risk factors. In fact, the majority of individuals who have all of the risk factors we will discuss will never commit a serious crime, just as 85 people out of the 100 in the last example did not offend.
Offender Characteristics
Biological Sex
One of the strongest and most consistent of patterns we see when examining links between individual characteristics and crime is that males commit far more crimes than do females. Most textbooks suggest that these sex differences in offending are globally true for all major crime classifications during all historical periods of time (Moffitt et al., 2001).
Sex differences in offenders’ choice of victims also exist, however, which can somewhat complicate this general rule. Infanticide, the act of a parent killing their own very young child, for example, is committed by more mothers than fathers, although the legal system still classifies the underlying offense as murder, a serious crime where males make up over 80% of all offenders. For this reason, the accuracy of claims about males always committing more crime than females across all crime classifications may depend on how we define, classify and even measure different crime categories.
Criminologists have often spoken about male/female differences in offending using terms like the “female share” or “female percentage” of crime (Jeffries & Newbold, 2016; Steffensmeier & Allan, 1996). Criminologists have also used terms like the “gender gap” rather that the “sex gap” in offending during times when there was less recognition of the differences between biological sex and gender.
Table 3.1 shows the total number of offenses in Australia and the percentage of females who have committed the offenses[4]. Notice that the smallest female percentage (the largest sex gap) occurs with sexual assault, where females have committed only 3.7% of these offenses in the 2008-2009 time frame and 7.2% of these offenses in 2002-2023. In contrast, males and females committed offenses related to theft more equally. For theft, the female share was 43.8% in the 2008-2009 period and 41.6% in 2022-2023.
Table 3.1 Recorded Offenders, Australia
| 2008-2009 | 2022-2023 | |||||
| Total | Female | Total | Female | |||
| Number | Number | % | Number | Number | % | |
| Homicide and related offences | 816 | 106 | 13.0% | 627 | 112 | 17.9% |
| Acts intended to cause injury | 72069 | 15226 | 21.1% | 91007 | 23136 | 25.4% |
| Sexual assault and related offences | 6340 | 234 | 3.7% | 9531 | 683 | 7.2% |
| Robbery, extortion and related offences | 3911 | 542 | 13.9% | 4016 | 844 | 21.0% |
| Unlawful entry with intent | 15887 | 2084 | 13.1% | 11338 | 2219 | 19.6% |
| Theft and related offenses | 58941 | 25810 | 43.8% | 35201 | 14656 | 41.6% |
| Fraud, deception and related offences | 10138 | 3323 | 32.8% | 8869 | 3093 | 34.9% |
| Illict drugs offences | 56310 | 11051 | 19.6% | 52315 | 13315 | 25.5% |
| Prohitibited and regulated weapons and explosives | 8962 | 583 | 9.5% | 12757 | 1910 | 15% |
| Property damage and environmental pollution | 21953 | 3557 | 16.2% | 14367 | 3115 | 21.7% |
| Public order offences | 65962 | 13405 | 20.3% | 36841 | 8617 | 23.4% |
| Total | 321289 | 76191 | 23.7% | 276869 | 71690 | 25.9% |
Data Source: Australian Bureau of Statistics. (2024). Recorded Crime - Offenders
If you examine the female share of the offenses in Table 3.1 closely, and compare over the time periods shown, you will notice that the female share in many of the crime categories has increased. The female share of robbery offenses, for example, has increased from 13.9% in 2008-2009 to 21.0% in 2022-2023, while the female share of offenses involving prohibited weapons (and explosives) has increased from 9.5% to 15% during those same time intervals. These gender trends are not unique to Australia (Beatton et al., 2018). Criminologist have observed similar trends in other countries and have debated about the reasons for these patterns since the mid-1970s when Freda Adler (1975) and Rita Simon (1975) wrote about changing crime-sex patterns they saw in the United States[5]. Both authors concluded that changing gender-role expectations as well as the women’s movement were responsible for the apparent increases in female offense rates.
While many criminologists have accepted the rising female share of crime as fact, some criminologists in the United States have remained skeptical about whether this change accurately reflects changes in female offending behaviour or whether the types of patterns we see in Table 3.1 result from changes in the ways criminal justice agencies investigate, arrest, charge or convict different offenders (Steffensmeier et al., 2023; Steffensmeier et al., 2005; Steffensmeier et al., 2006). The skeptics suggest, for example, that police officers may have been more lenient with women and young girls in the past and did not arrest or charge them to the same degree as men and young boys, even if the males and females committed equivalent crimes (Krohn et al., 1983). In other words, in the past, police officers may have been acting in a more chivalrous fashion toward women (Chesney-Lind, 1978; Tjaden & Tjaden, 1981; Visher, 1983).Some have argued that a similar pattern of chivalry may be true for judges. For example, even if the police arrested and charged men and women to the exact same degree, judges who believe that females are not as deserving of punishment as males may not find females guilty of offenses as often as they do males, or may not sentence women to prison as often (Daly & Tonry, 1997).
Although several criminologists have suggested that judges may sentence women more leniently than men for reasons related to chivalry, other criminologists argue that judges may order less severe sentences for women to protect their family members, such as young children, rather than the female offender herself (Paternoster & Bachman, 2001). Interestingly, many of the skeptical criminologists who do not believe that the female share of offending is actually rising believe that there is also little evidence to support lenient treatment of women by most judges (Steffensmeier et al., 1993; Steffensmeier et al., 1998; Visher, 1983).
The differential treatment of women may also apply to the people who are victims of crime. If crime victims do not view female criminality as serious and as deserving of punishment as they view male criminality, they may be less likely to notify the police if a female offender is caught, or they may request the police not to charge a female offender even if the police are notified (Hindelang, 1979). For example, a victim of a relatively minor crime that has occurred on school grounds may request that a school principal rather than the police administer appropriate offender discipline.
An important point to note about Table 3.1 is that it relies upon measuring crime (determining how much crime has been committed) using records of known offenders – one type of “administrative” or “official” data – a topic covered in Chapter 2. The reason why this point is important relates to whether the female share of crime is actually increasing (as most criminologists believe), or whether the increases may be due to a greater emphasis on notifying the police about female offenders and/or the police charging a greater number of the female offenders reported to them (Steffensmeier et al., 2005). Another reason why this point is important is because it illustrates a primary reason why it can be difficult to definitively solve ongoing debates in criminology and criminal justice. Some evidence and data suggest one answer to an important question, while other evidence and data suggest a different answer. The fact that administrative data does not contain the “dark-figure” of crime – in other words, crime not reported to the police or other similar agency – makes finding the answers to certain questions about crime more challenging.
If trends in female crime do reflect actual changes in the behavior of women and younger girls, why have these changes occurred and why do the male/female differences exist in the first place? Is it biological differences? What exactly is different in the biology of males and females? If male/female differences in crime have their basis in something biological (e.g., males have much more testosterone than do females) and differences in biology have not changed over time, then it would seem that male/female differences in crime cannot be due solely to biology. If instead, the sex differences are caused by the way that young girls and boys have been raised by their parents, taught in our schools, or treated by our communities, what exactly has changed and what might these changing patterns mean in terms of the ways that parents should raise children? These are some of the important research questions a criminologist might seek to answer on topics related to sex and crime. They are also questions a criminal justice professional might need to consider if they become responsible for ensuring that adequate resources are available to manage potential future increases in the number female offenders.
Age
When examining the relationship between age and crime we see another very strong and consistent pattern. Figure 3.1 shows the proportion of arrests made by police in different age group categories. As in our discussions about sex and gender, we would certainly see similar patterns if we examined data from another county because quite similar patterns are observed globally. This figure shows that young people between the ages of 15 to 24 commit the most crime. This is true for all crime categories shown, although the peak age is slightly different for different offense types. For example, the age range where people commit the most drug and public order offenses is 19-20 while for the other offenses shown, it is in the 15–17 year-old range.
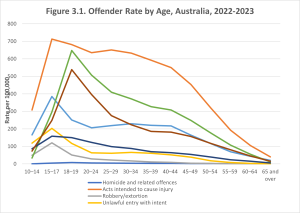
The pattern(s) we see in Figure 3.1 have become known in criminology as the age-crime curve (Hirschi & Gottfredson, 1983; Wolfgang et al., 1987). While researchers understand some of the underlying reasons for these patterns, there is not yet complete agreement about all of possible reasons these age patterns exist. We can be certain, however, that the increases around 10 years of age occur for two primary reasons. First, young people around that age are growing bigger and stronger and can stray further away from their parents. Around 10 years old is when they start to become more independent and interact more with people outside the home. This makes crime more possible for them. Second, we simply do not consider the types of behaviours that very young children (e.g., under age 10) engage in as being “criminal” in nature. If you’ve ever spent time with an infant or toddler, you know that they often pull hair, hit, and even take another child’s toy without permission. When this happens, we don’t call the police and the police don’t charge children with criminal offenses. In fact, we know that the peak of the aggressive behavior is most likely around 2-3 years old, something that parents call the “terrible-twos” (Green, 2014). Most countries, including Australia, require a child to be at least 10 years old before even the juvenile justice system might consider their aggressive behavior a youth offense (Commission, 2021) and there have been suggestions to raise the minimum age even higher (Crofts, 2023)[6].
Unlike data for 10-year-olds, the crime upticks during the 15- to 24-year-old range are not just a matter of definition. This increase in deviant behavior is consistent over time. There are many potential reasons for this, which we explore in the following chpaters in this book. Some explanations are that as adolescents get older, they become more interested in spending time with their friends and less time with their parents (Sampson & Laub, 1993). Many have become almost as big as full-grown adults and will be able to drive cars, which can take them further away from their homes and the supervision of adults (Ackerman & Rossmo, 2015). Teenagers and young adults often start to care more about what their friends think than what their parents think (Berndt, 1979; Harris, 1995; Warr, 2002). Many conform to social pressures to commit acts of minor youth crime or even more serious criminal actions (Warr, 1993). All of these things likely contribute to the increase in criminal behavior during the teen years.
By the time that people become 35 years old, their offending tends to slow down greatly (Hirschi & Gottfredson, 1983). Most will have jobs by this time. They wake up for work earlier in the morning. Engaging in a crime may not only get them in legal trouble, but may also jeopardise their employment. Many will marry and have children to care for, and subsequently will not be able to spend as much time with friends late at night when there are more offending opportunities.
The generalised age-crime patterns shown in Figure 3.1 do not apply to all offenders. Instead, what we see in Figure 3.1 are the patterns that occur when we examine a large group of individuals and create a rate of the number of offenders per 100,000 people in different age brackets (what some call an aggregate pattern). Terrie Moffitt and her colleagues were among the first to suggest that while most offenders follow the general age-crime curve closely (a group that she called “adolescent-limited offenders”), a small group of persistent offenders do not follow this pattern, and instead continue offending into later stages of life (1993). She classified this group, “life-course-persistent offenders.” You will learn more about this theory in Chapter 13.
Socioeconomic Status
Official/administrative data about the socioeconomic status of offenders in Australia is generally less available than information like biological sex or age. We can get a somewhat reasonable understanding of the relationship between socioeconomic status and crime in Australia by examining offenders’ employment status (Baumer, 2002; Quee et al., 2023). Information about employment status may come from different sources like police arrest information or from information collected by a state department of corrections.
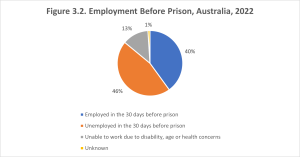
Figure 3.2 indicates that among Australian prisoners, 46% were unemployed just before they entered prison and another 13% were unable to work for disability, age or health reasons. We also know that prisoners have below average education and literacy – factors that are strongly associated with socioeconomic status and income. What may be unclear, however, is what exactly can we conclude from these patterns? Does a lack of education and the often associated poverty come first and make people more crime prone, or does something else come before both?
As an example of a common precursor to both socioeconomic status and crime, criminologists often speak about low self-control, something you will hear more about in Chapter 9, which essentially means an inability to delay a reward in ways that avoid violating criminal laws and other social norms (Mischel et al., 1989). For example, most of us desire more money to spend, but individuals with high self-control will normally wait until they earn it, while those with low self-control may act impulsively and steal the money instead. The development of self-control typically occurs very early in life (Gottfredson & Hirschi, 1990), before individuals start to commit criminal offenses and before they start to learn important job skills that can help them make a higher salary and increase their socioeconomic status. For these reasons, perhaps low self-control causes crime to become more likely while also making it more likely that people who have low self-control will have low socioeconomic status.
Another important thing to consider when examining the patterns between socioeconomic status and crime is that the offenses easiest to detect, investigate and prosecute are those sometimes called “street” crimes: offenses like robbery, burglary and theft. While almost anyone has the skills and opportunity to commit a street offense, only certain people have the opportunity to commit what has become known as “white collar crime.” Recall from earlier chapters that “white collar” crimes are those committed by individuals who hold certain jobs or who otherwise have high social status and the associated opportunities to commit financially lucrative offenses such as securities fraud, embezzlement, bribery and money laundering (Sutherland, 1949). These types of offenses are typically much more difficult to detect and harder for law enforcement personnel to bring the offender to justice. Although the public often perceives white-collar crime as less harmful than street crime (Cullen et al., 1982; Rossi et al., 1974), white collar offenses often result in very substantial losses for large groups of individuals, investors, businesses, and governments (Reiman, 2001). White collar environmental crimes that involve the illegal disposal of hazardous waste can result in the destruction of entire communities, making them unsafe places to live (Murdock et al., 1999). These serious offenses can also result in serious physical harm in the form of increased risks of cancer and other serious health conditions for people living in effected areas.
The main point is that individuals can only commit crimes for which they have opportunities (Cohen & Felson, 1979). Although almost everyone has the opportunity to break into someone’s home, why would a corporate executive who wants to steal money bother with such a petty crime when they have access to steal thousands, if not millions, of dollars thanks to their job? A classic book by Jeffrey Reiman sums up the complications regarding the patterns between socioeconomic status and crime with the catchy title, “The rich get richer and the poor get prison” (1998). In other words, the relationship between socioeconomic status and crime we see when looking at administrative data may not reflect an important portion of the “dark-figure” in crime mentioned in the last chapter – that while the “street” crimes committed by the poor and middle-class are often detected and prosecuted, the “suite” crimes of the rich, often go undetected. Furthermore, even when white collar crimes are detected, they are often more difficult to investigate and prosecute, and therefore the offenders often remain unpunished and unrecorded (Braithwaite, 1981).
Race / Ethnicity
The term “race” has often been used to categorise people based upon physical attributes such as skin colour, facial features, or hair type. Historically, this term has been used in a largely inaccurate way by implying that there are far more genetic differences among people than there actually are. The term “ethnicity” is often used as an alternative to describe matters more closely tied to cultural identity, shared history and traditions. When we speak about race or ethnicity in Australia, we often contrast First Nations peoples with Australia’s non-Indigenous population. When race is discussed in other western countries like the United States, it is often in regard to the two largest minority groups in that country, Black Americans and Hispanic/Latino Americans.
The association between race/ethnicity and crime is even more complex and contentious than the association between socio-economic status and crime because race and/or ethnicity is strongly intertwined with socioeconomic status in Australia, as it is in many other countries. More specifically, minority groups in most western countries usually have a lower average family income and associated socioeconomic status as do non-minority groups (Sampson & Wilson, 1995), often due to reasons related to institutionalised racism and intergenerational trauma.
For this reason, it can be difficult to differentiate the effects of socioeconomic status from other matters associated with ethnicity when examining the patterns between these characteristics and crime. What is clear, is that Australia’s First Nations peoples represent approximately 2% of the population, but a much higher proportion of those arrested and jailed. Although some of the over-representation in the criminal justice system may be attributed to lower socioeconomic status, some authors also suggest that historical colonisation, dispossession and disadvantage (Baker, 2001), along with a declining cultural heritage and social isolation (LaPrairie, 1997) has contributed to these problems. We discuss this more in Chapter 14.
Similar arguments have been made about the cultural adaptations that Black Americans have been forced to make due to the historical and continuing race-based residential inequality in that country (Sampson & Wilson, 1995). For example, ethnic background can affects the choices of where someone lives in ways related to crime. Where someone lives may be constrained by the segregation of lower socioeconomic status groups to “poorer” areas of a town or city. This has occurred very purposefully in some countries using discriminatory practices such as those commonly practiced in the United States during the 1930s to the 1960s. The discrimination involved a systematic denial of different services including loans, insurance, and financial assistance in certain neighborhoods that were typically inhabited by minority populations, especially African Americans and other people of colour. These various practices became known as “red-lining,” a name taken from the use of a red line drawn on maps around select neighborhoods where the practices took place (Winling & Michney, 2021). The reasons why this is related to crime may become a bit more clear in the next section about place and urbanisation.
Place / Urbanisation
Criminal events do not occur with the same frequency in different areas (Braithwaite & Biles, 1980). Instead, there are certain crime-prone cities, suburbs, streets, buildings and even individual businesses (Weatherburn, 2001). Some criminologists call these crime-prone places “hot-spots” (Sherman et al., 1989) and call the patterns describing how much crime occurs in these different places (or space) the “spatial distribution” of crime (Rossmo et al., 2012). Interestingly, the reasons underlying why certain areas become hot-spots is more complicated than simply having more crime-prone people who live or visit these areas.
The origins of this line of enquiry have roots in the sociological study of immigration in the city of Chicago in the United States. During the early 1900s, University of Chicago sociologists Clifford Shaw and Henry McKay examined what occurred in Chicago when new immigrants looking for employment opportunities that were not available in their country of origin started off their lives in their new country by living near Chicago’s central business district next to the noise and pollution of the factories (Shaw & McKay, 1942). The new immigrants lived in the least desirable areas of the city because that is all they could afford. It may be no surprise to learn that the crime rate of this area was relatively high. Perhaps also unsurprising is that the people who lived in this high crime area were blamed for the crime problems. Because the new immigrants came from foreign countries where the cultures and traditions were often quite different from the existing Chicago residents, many people blamed the cultural or ethnic backgrounds of the new immigrants for the high crime of the neighborhoods in which the immigrants lived. You will read more about this in Chapter 6.
Interestingly, however, Shaw and McKay discovered that as the new immigrants gained wealth due to their new jobs, and were able to move further away from the central business district, the crime rates in these high crime areas did not drop when immigrants from a different country started to move in. At the same time, the crime rates of the neighborhoods to which the older immigrants moved did not increase. Shaw and McKay concluded that there were factors associated with the neighborhoods themselves rather than the people who lived in the neighborhoods that were at least partially responsible for the areas being crime-prone. Eventually, the study of why some places become hot-spots for crime as well as the overall spatial distribution of crime has come to be called, “environmental criminology” (Brantingham & Brantingham, 1981). We discuss environmental criminology in more detail in Chapter 7.

Image generated using Midjourney using the prompt: A photorealistic illustration of a digital map with various inventory items pinpointed on it, alongside a magnifying glass zooming into a specific asset. In the photorealistic style with white background, black ink, using mostly red and blue shades. no text font, stylise 5 –chaos 2 –weird 1
Among the many spatial characteristics that criminologist have found to be associated with crime are residential mobility (how often people from home to home) and the lack of home ownership (Bursik, 1988; Sampson et al., 1997). Unsurprisingly, these two characteristics are common among lower socioeconomic status families, who are often members of a racial or ethnic minority group. For this reason, the link between race/ethnicity and crime as well as the link between socioeconomic class and crime are complicated by facts associated with differences in areas in which different groups may live (Sampson & Wilson, 1995).
Victim Characteristics
At the beginning of the chapter, we asked you to think of the word, “criminal” and imagine someone fitting that description. Now do the same with the word, “victim.” If you are like most people, the person you envision will look much different from the criminal you imagined earlier. The person you are thinking of may fit the typical victim stereotype: weak, inexperienced and an easy target (Ruback & Thompson, 2001; von Hentig, 1948). This person may be very young, elderly, and female.
Most people assume that offenders and victims are very distinct groups of people, where the victims have done nothing wrong. They may have simply been in the wrong place at the wrong time when the offender happened to be there (Fagan et al., 1987). Stereotypes, as well as the entertainment industry, frequently suggest that offenders select their victims in a random way (Best, 1999). One exception seems to be the entertainment industry’s depiction of murder victims, where victims are often portrayed as being selected for a very specific reason. Television and movie plots often concentrate upon an elaborate scheme to plan the crime and ensure a high risk getaway so that the offender(s) is not caught and punished.
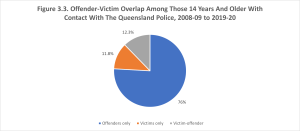
In reality, crime victims often share many of the same characteristics as offenders (Lauritsen et al., 1991), especially for violent offenses (Block, 1981). Victims of violence tend to be young and male. In other words, the same risk and protectives factors for offending also apply to victimisation. Not only are victim and offender characteristics similar, but at times there can even be what criminologists call a “victim-offender overlap.” This term refers to the fact that an offender can often experience victimisation at different points in their lives (Berg & Schreck, 2022). Figure 3.3 shows that while 76% of all individuals 14 years and older who have had contact with the Queensland police were offenders, over 12% of the contacts involved individuals who were victims as well as offenders.
Although 12% of police contacts being both victims and offenders is modest, this number is dwarfed by higher estimates of the victim-offender overlap found by criminologists from other countries in different types of populations. One United States study, for example, found that among female prisoners in New York, 75% reported being victimised in some way by an adult intimate partner prior to their incarceration, while 77% reported physical or sexual assault by a nonintimate. In addition, 49% reported being a robbery victim, 49% reported being threatened with physical harm or threatened with a weapon, and 28% reported being attacked with a knife or being shot at. When all forms of violence were considered together, 94% of the prisoners reported some type of serious prior victimisation (Browne et al., 1999).
Regardless of the exact degree to which an overlap exists between victims and offenders, several studies in Australia, the UK and the United States have consistently found substantial victim-offender overlaps in different types of populations, such as Australian youth who have been reported as missing (Randone & Thomas, 2002), people with disabilities (Anstis & Thomas, 2022), homicide victims (Wolfgang, 1958), the general adult male population (Singer, 1981) and the general adult male and female populaton of the UK (Gottfredson, 1984).
Several explanations have been offered in these studies in attempt to identify underlying reasons for why individuals who are offenders are also likely to be victims. One possibility is that victimisation risk is largely about exposure to offenders, which occurs because of an individual’s lifestyle, residence, and routine activities (Felson, 1998). Because people associate with, and otherwise primarily contact people similar to themselves, if those other people are offenders, the individuals are at a greater risk of victimisation (Hindelang et al., 1978; Ruback & Thompson, 2001). Put more succinctly, offenders hang out with other offenders and they subsequently victimise each other. Offenders are also more likely to use alcohol or illegal drugs, which lowers their ability to protect themselves and their belongings (Felson et al., 2007). Offenders are also more likely to live in socially disorganised places that have high rates of crime (Ruback & Thompson, 2001; Sampson & Lauritsen, 1994).
A further reason for the overlap is that offenders can be attractive targets. They may have something of value worth taking. Drug dealers, for example, have both drugs and cash and are unlikely to involve the police (Wright & Decker, 1997). Victims and offenders can sometimes switch roles in the sense that the distress of victimisation may lead victims to respond with anger and their own subsequent criminal behavior (Bernard, 1990). Both offenders and their victims may come from a similar group of people who encourage retaliation for perceived wrongs. In other words, both victims and offenders may adhere to a “subculture of violence” where violence between individuals escalates during repeated interactions with others (Corzine et al., 1999; Nisbett & Cohen, 1996). Finally, when victims value courage, honour and retribution, and when social status is achieved through the adoption of a tough demeanor (Anderson, 1994), victims may be more likely to respond to an offender with force as we see in bar fights, where it becomes difficult to determine who is the offender and who is the victim.
CONCLUSION
The characteristics of offenders, and by extension, victims, is one of the first places that criminologists look to help explain why individuals commit crime. But as you have already seen, there are a lot of potential explanations. What is important to know is that the actual patterns of crime are much different than many people realise. Beyond that, these patterns of characteristics will vary by location, offense type and even century. As we saw in Chapter 2, definitions of crime itself can vary. When it does, the characteristics that we come to equate with crime will also change. That is certainly the case when it comes to comparisons of “street crime” and white collar and corporate crimes. In the upcoming chapters, we will examine these different theoretical explanations of crime and criminality.
Check Your Knowledge
Discussion Questions
- How does the way that we collect data about crime and individuals who commit crime affect what we know about the characteristics of offenders?
- What is the ‘victim-offender overlap’ and how big is it? How did you come to that conclusion?
- Out of all of the characteristics of offenders and victims, which one seems the most problematic to you? Why?
REFERENCES
Ackerman, J., & Rossmo, D. K. (2015). How far to travel? A multilevel analysis of the residence-to-crime distance. Journal of Quantitative Criminology, 31(2), 237-262. https://doi.org/10.1007/s10940-014-9232-7
Adler, F. (1975). Sisters in crime: The rise of the new female criminal. McGraw-Hill.
Anderson, E. (1994). The code of the streets. Atlantic Monthly, 273, 80-94.
Anstis, S., & Thomas, S. D. M. (2022). Exploring the victim offender overlap among people with an intellectual disability. Journal of Applied Research on Intelletual Disabilities, 35, 789-799.
Baker, J. (2001). The scope for reducing Indigenous imprisonment rates. NSW Bureau of Crime Statistics and Research.
Baumer, E. P. (2002). Neighborhood disadvantage and police notification by victims of violence. Criminology, 40, 579-616.
Beatton, T., Kidd, M. P., & Machin, S. (2018). Gender crime convergence over twenty years: evidence from Australia. European Economic Review, 109, 275-288. https://doi.org/10.1016/j.euroecorev.2018.01.001
Berg, M. T., & Schreck, C. J. (2022). The meaning of the victim-offender overlap for criminological theory and crime prevention policy. Annual Review of Criminology, 5, 277-297.
Bernard, T. J. (1990). Angry aggression among the “truly disadvantaged”. Criminology, 28, 73-96.
Berndt, T. J. (1979). Developmental changes in conformity to peers and parents.Developmental Psychology, 15, 608-616.
Best, J. (1999). Random violence: How we talk about new crimes and new victims. University of California Press.
Block, R. (1981). Victim-offender dynamics in violent crime. The Journal of Criminal Law and Criminology, 72(2), 743-761.
Braithwaite, J. (1981). The myth of social class and criminality reconsidered.American Sociological Review, 46, 36-57.
Braithwaite, J., & Biles, D. (1980). Crime victimisation rates in Australian cities. Australian and New Zealand Journal of Sociology, 16(1), 79-84.
Brantingham, P. J., & Brantingham, P. L. (Eds.). (1981). Environmental Criminology. Sage.
Browne, A., Miller, B., & Maguin, E. (1999). Prevalence and severity of lifetime physical and sexual victimization among incarcerated women. International Journal of Law and Psychiatry, 22(3-4), 301-322.
Bursik, R. J., Jr. (1988). Social disorganization and theories of crime and delinquency: Problems and prospects. Criminology, 26, 519-552.
Chesney-Lind, M. (1978). Chivalry reexamined: Women and the criminal justice system. In L. H. Bowker (Ed.), Women, Crime, and the Criminal Justice System (pp. 197-223). D.C. Heath.
Cohen, L. E., & Felson, M. (1979). Social change and crime rate trends: A routine activity approach. American Sociological Review, 44, 588-608.
Commission, A. H. R. (2021). The Minimum Age of Criminal Responsibility.
Corzine, J., Huff-Corzine, L., & Whitt, H. P. (1999). cultural and subcultural theories of homicide. In M. D. Smith & M. A. Zahn (Eds.), Homicide: A sourcebook of social research (pp. 42-57). Sage.
Crofts, T. (2023). Act Now: Raise the Minimum Age of Criminal Responsibility. Current Issues in Criminal Justice, 35(1), 118-138. https://doi.org/10.1080/10345329.2022.2139892
Cullen, F. T., Link, B. G., & Polanzi, C. W. (1982). The seriousness of crime revisited: Have attitudes toward white-collar crime changed? Criminology, 20, 83-102.
Daly, K., & Tonry, M. H. (1997). Gender, race, and sentencing. In Crime and justice: A review of research (Vol. 22, pp. 201-252).
Fagan, J., Piper, E. S., & Cheng, Y.-T. (1987). Contributions of victimization to delinquency in inner cities. Journal of Criminal Law and Criminology, 78, 586-609.
Felson, M. (1998). Crime and Everyday Life (2nd ed.). Pine Forge Press.
Felson, R. B., Burchfield, K. B., & Teasdale, B. (2007). The impact of alcohol on different types of violent incidents. Criminal Justice and Behavior, 34(8), 1057-1068.
Gottfredson, M. R. (1984). Victims of crime: Dimensions of risk.
Gottfredson, M. R., & Hirschi, T. (1990). A General Theory of Crime. Stanford University Press.
Green, C. (2014). Toddler taming: The classic guide to your child’s behavior from 1 to 4. Ebury Publishing.
Harris, J. R. (1995). Where is the child’s environment? A group socialization theory of development. Psychological Review, 102, 458-489.
Hindelang, M. J. (1979). Sex differences in criminal activity. Social Problems, 27(2), 143-156.
Hindelang, M. J., Gottfredson, M. R., & Garofalo, J. (1978). Victims of personal crime: An empirical foundation for a theory of personal victimization. Ballinger.
Hirschi, T., & Gottfredson, M. R. (1983). Age and the explanation of crime. American Journal of Sociology, 89, 552-584.
Jeffries, S., & Newbold, G. (2016). Analysing trends in the imprisonment of women in Australia and New Zealand. Psychiatry, Psychology, and Law, 23(2), 184-206.
Krohn, M. D., Curry, J. P., & Nelson-Kilger, S. (1983). Is chivalry dead? Criminology, 21, 417-437.
LaPrairie, C. (1997). Reconstructing theory: Explaining Aboriginal over representation in the criminal justice system in Canada. Australian and New Zealand Journal of Criminology, 30(1), 39-54. https://doi.org/10.1177/000486589703000104
Lauritsen, J. L., Sampson, R. J., & Laub, J. H. (1991). The link between offending and victimization among adolescents. Criminology, 29(2), 265-292.
Mischel, W., Shoda, Y., & Rodriguez, M. L. (1989). Delay of gratification in children. Science, 244, 933-938.
Moffitt, T. E. (1993). Adolescence-limited and life-course-persistent antisocial behavior: A developmental taxonomy. Psychological Review, 100, 674-701.
Moffitt, T. E., Caspi, A., Rutter, M., & Silva, P. A. (2001). Sex differences in antisocial behavior. Cambridge University Press.
Nisbett, R. E., & Cohen, D. (1996). Culture of Honor: The Psychology of Violence in the South. Westview Press.
Paternoster, R., & Bachman, R. (2001). Explaining Criminals and Crime. Roxbury.
Quee, M., James, T., Maher, C., & Andriolo, I. (2023). Australian Institute of Health and Welfare: The health of people in Australia’s prisons 2022.
Randone, J., & Thomas, S. D. M. (2002). The victim-offender overlaps among Australian youth missing persons. Policing, 16(4), 707-718.
Reiman, J. H. (1998). The rich get richer and the poor get prison: Ideology, class and criminal justice. In (5th ed., pp. [various selections]). Allyn and Bacon.
Reiman, J. H. (2001). Is street crime more harmful than white-collar crime? – [No]. In Finsterbusch (Ed.), Taking sides (pp. 260-276). McGraw-Hill.
Rossi, P. H., Waite, E., Bose, C. E., & Berk, R. E. (1974). The seriousness of crime: Normative structure and individual differences. American Sociological Review, 39, 224-237.
Rossmo, D. K., Lu, Y., & Fang, T. (2012). Spatial-temporal crime paths. In M. A. Andresen & J. B. Kinney (Eds.), Patterns, prevention, and geometry of crime (pp. 16-42). Routledge.
Ruback, R. B., & Thompson, M. P. (2001). Social and psychological consequences of violent victimization. Sage Publications.
Sampson, R. J., & Laub, J. H. (1993). Crime in the making: Pathways and turning points through life. Harvard University Press.
Sampson, R. J., & Lauritsen, J. L. (1994). Violent victimization and offending: Individual, situational, and community-level risk factors. In A. J. Reiss, Jr. & J. A. Roth (Eds.), Understanding and preventing violence: Social influences (Vol. 3, pp. 1-114). National Academy Press.
Sampson, R. J., Raudenbush, S. W., & Earls, F. J. (1997). Neighborhoods and violent crime: A multilevel study of collective efficacy. Science, 277, 918-924.
Sampson, R. J., & Wilson, W. J. (1995). Toward a theory of race, crime, and urban inequality. In J. Hagan & R. D. Peterson (Eds.), Crime and inequality (pp. 37-54). Stanford University Press.
Shaw, C. R., & McKay, H. D. (1942). Juvenile delinquency and urban areas: A study of rates of delinquents in relation to differential characteristics of local communities in American cities. The University of Chicago press.
Sherman, L. W., Gartin, P. R., & Buerger, M. E. (1989). Hot spots of predatory crime: Routine activities and the criminology of place. Criminology, 27, 27-55.
Simon, R. J. (1975). Women and Crime. Lexington Books.
Singer, S. (1981). Homogeneous victim-offender populations: A review and some implications. Journal of Criminal Law and Criminology, 72(2), 779-788.
Steffensmeier, D. J., & Allan, E. A. (1996). Gender and crime: Toward a gendered theory of female offending. Annual Review of Sociology, 22, 459-487.
Steffensmeier, D. J., Kramer, J., & Streifel, C. (1993). Gender and imprisonment decisions. Criminology, 31, 411-446.
Steffensmeier, D. J., Schwartz, J., Slepicka, J., & Zhong, H. (2023). Twenty-first century trends in girls’ violence and gender gap: Triangulated findings from official and unofficial longitudinal sources. Journal of Interpersonal Violence, 38(17-18), 9818-9844. https://doi.org/10.1177/08862605231169733
Steffensmeier, D. J., Schwartz, J., Zhong, S., & Ackerman, J. (2005). An assessment of recent trends in girls’ violence using diverse longitudinal sources: Is the gender gap closing? Criminology, 43, 355-405. https://doi.org/10.1111/j.0011-1348.2005.00011.x
Steffensmeier, D. J., Ulmer, J. T., & Kramer, J. (1998). The interaction of race, gender, and age in criminal sentencing: The punishment cost of being young, black, and male. Criminology, 36, 763-793.
Steffensmeier, D. J., Zhong, H., Ackerman, J., Schwartz, J., & Agha, S. (2006). Gender gap trends for violent crimes, 1980-2003: A UCR – NCVS comparison. Feminist Criminology, 1, 72-98. https://doi.org/10.1177/1557085105283953
Sutherland, E. H. (1949). White collar crime. Dryden.
Tjaden, P., & Tjaden, C. D. (1981). Differential treatment of the female felon: Myth or reality? In M. Q. Warren (Ed.), Comparing female and male offenders (pp. 73-88). Sage.
Visher, C. A. (1983). Gender, police arrest decisions, and notions of chivalry. Criminology, 21, 5-28.
von Hentig, H. (1948). The criminal and his victim. Yale University Press.
Warr, M. (1993). Age, peers, and delinquency. Criminology, 31, 17-40.
Warr, M. (2002). Companions in crime. Cambridge University Press.
Weatherburn, D. (2001). What causes crime? (Contemporary Issues in Crime and Justice, Issue 54). NSW Bureau of Crime Statistics and Research.
Winling, L. C., & Michney, T. M. (2021). The roots of redlining: Academic, governmental, and professional networks in the making of the new deal lending
regime. Journal of American History, 108(1), 42-69. https://doi.org/10.1093/jahist/jaab066
Wolfgang, M. E. (1958). Patterns in Criminal Homicide. Patterson Smith.
Wolfgang, M. E., Thornberry, T. P., & Figlio, R. M. (1987). From boy to man, from delinquency to crime. University of Chicago Press.
Wright, R. T., & Decker, S. H. (1997). Armed robbers in action: Stickups and street culture. Northeastern University Press.
- The new Netflix series Griselda starring Sophia Vergara is good example of such a show. ↵
- A classic reference to this storyline is Ocean’s 11, starring George Clooney, Bratt Pitt, and Julia Roberts. ↵
- Sometimes these risk- and protective-factors are called crime “correlates,” a more technical term you may hear in a statistics or research methods class. A parallel term is “correlation,” which can also be called a “pattern,” “link,” “association” or “relationship.” We will start with offender characteristics and then discuss the characteristics of victims. ↵
- This is for all offenses where there is a known offender. In many cases, the police may not know who has committed the crime. ↵
- Professor Freda Adler is one of the most well known feminist scholars in criminology. She is very well regarded for her theorietical contributions over the years. If you want to learn more about her and her work, check out this interview with Profesor Jay Albanese for the Oral History project of the American Society of Criminology. ↵
- For more information about what age groups are considered children or youth, check out this interesting article on age by the United Nations. ↵
