9 Performance evaluation
Cross-reference to ISO31000; ISO45001; Annex SL clause 9; clause 9 in management system standards; and SafePlus requirements (section 2.2.5).
Definitions of italicised terms are in the Glossary.
Check for key readings, webinars, interviews, and videos for other resources.
Relevant law
- Health and Safety at Work Act 2015
- Health and Safety at Work (Worker Engagement, Participation, and Representation) Regulations 2016
- Health and Safety at Work (General Risk and Workplace Management) Regulations 2016
- Health and Safety at Work (Major Hazard Facilities) Regulations 2016
Key questions
What is or will be the impact of artificial intelligence on the business?
If risk is the “effect of uncertainty on objectives”:
- what are the high-level and operational objectives of the organisation, activity, system, or item?
- what are the uncertainties about achieving the objectives?
- how do or will those uncertainties affect achievement of the operational objectives?
- how should monitoring and review of the PCBU and management system be carried out to ensure any uncertainty about achievement of those objectives is acceptable?
Useful management techniques
The following techniques may help find information that can be used to design monitoring and review in a PCBU.
- Engagement, communication, and consultation (section 21.3.9)
- Fishbone or Ishikawa analysis (section 21.3.12)
- PESTLE analysis (section 21.3.27)
- Risk sensing (section 21.3.35)
- Scenario analysis (section 21.3.37)
- SWOT analysis (section 21.3.39)
9.1 Monitoring and review
Monitoring is what we do (or should do) to find out if there has been some change from the performance level required or expected. We do it by continual checking, supervising, critically observing or other methods. It is one of the key responsibilities of managers (Ward et al., 2008).
In risk and safety management we can monitor the OHSMS (as part of the risk management framework), the risk management process, risks, projects, or controls.
Reviewing is what we do to find out if something remains suitable, adequate, or effective in achieving objectives. It is also a key responsibility of managers but may be done less often than monitoring. Reviews tend to be carried out at specified times.
Monitoring
The context of an organisation or activity may change quickly or slowly, sometimes resulting in missed opportunities, unpleasant surprises, or catastrophic threats to survival. Thus, monitoring and reviewing the external and internal contexts of an organisation is critical.
Establishing the context is also the stage when criteria are developed. Subsequent application of the criteria to the evaluation of risks may show these are inadequate or that one or more were not developed in the context stage.
Gradual changes in the context
Major shifts in the context of organisation are often easy to identify post-event. However, changes of a particular set of circumstances may be more difficult to identify while they are happening and are sometimes referred to as the “boiled frog syndrome”, “diffuse disasters”, or “creeping crises”.
Sudden changes in the context
The COVID-19 pandemic caught many businesses by surprise, despite earlier pandemics (eg, AIDS, SARS, Ebola, influenza) and business reports.
Effects of catastrophes on shareholder value
In an analysis of the effects of crises on shareholder value (Knight, R. & Pretty, 2002) some businesses (“recoverers”) recovered from a loss in shareholder value better than others (“non-recoverers”). Non-recoverers suffered a net negative effect on shareholder value of about 15% up to one year after a catastrophe but recoverers gained about 15% in value. Knight & Pretty found four differences between the two groups:
- non-recoverers initially lost over 10% market capitalisation
- in the first 2-3 months the estimated financial loss was significant for non-recoverers
- non-recoverers suffered multiple fatalities and this affected recovery in the first 2-3 months
- management responsibility for the safety lapses shaped the longer-term shareholder value response.
By contrast, whether the losses were fully covered by insurance did not seem to have much influence.
A revision of this work (Knight, R., 2020) showed that “since 2008, if the crisis caused loss of human life the damage to shareholder value was much more significant. On average, events involving fatalities lost 13.5% against 1.7% where no lives were lost.” This effect is shown in Figure 27. The study covered large businesses but the Pike River disaster met three criteria: the disaster was man-made; the company was listed on the stock exchange; the crisis attracted significant public and media attention.
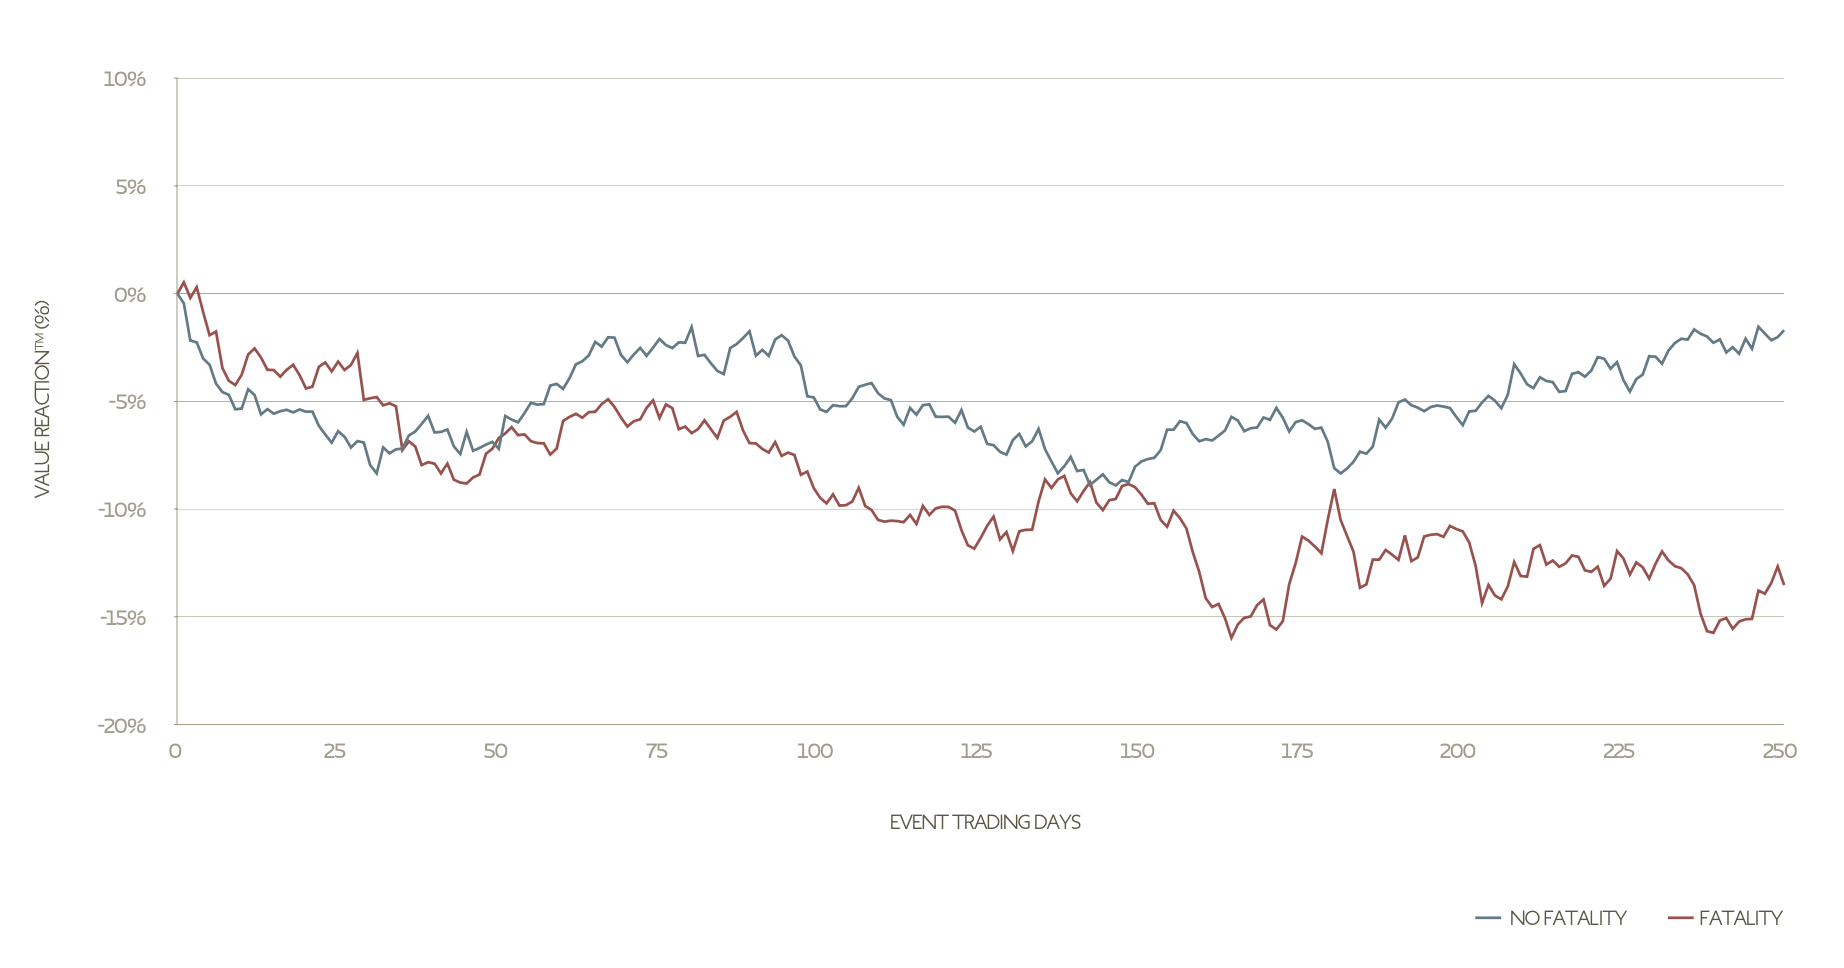
Source: Adapted with permission from Figure 4, Knight, R (2020)
Pike River disaster
For OHS professionals, high numbers of fatalities and high financial loss are of special concern. The case of the Pike River disaster provides a local example (Macfie, 2021).
- The company had an increasing mismatch between project completion dates and budget, and the production figures, production delays and requests for more money.
- Share trading was suspended soon after the first explosion.
- The first explosion indicated multiple fatalities.
- Subsequent explosions and the fire halted recovery and resumption of mining.
- Management and the board avoided taking responsibility for the disaster.
Review
There should be specific times or stages when something is reviewed. This might be a review of:
- completion of the latest stage in a project
- controls (eg, annually)
- a specific control (eg, before issuing a permit-to-work).
Rigby (2017, pp. 24-25) summarised work on complexity reduction in businesses as a way of improving efficiency and profitability. Subsequent work on safety clutter showed that the “accumulation of safety procedures, documents, roles, and activities that are performed in the name of safety, but do not contribute to the safety of operational work” (Rae et al., 2018). There should be regular reviews of such clutter to eliminate or consolidate them into well-designed safe systems of work.
9.2 Monitoring and review – accountabilities
9.2.1 Levels of uncertainty and acceptance
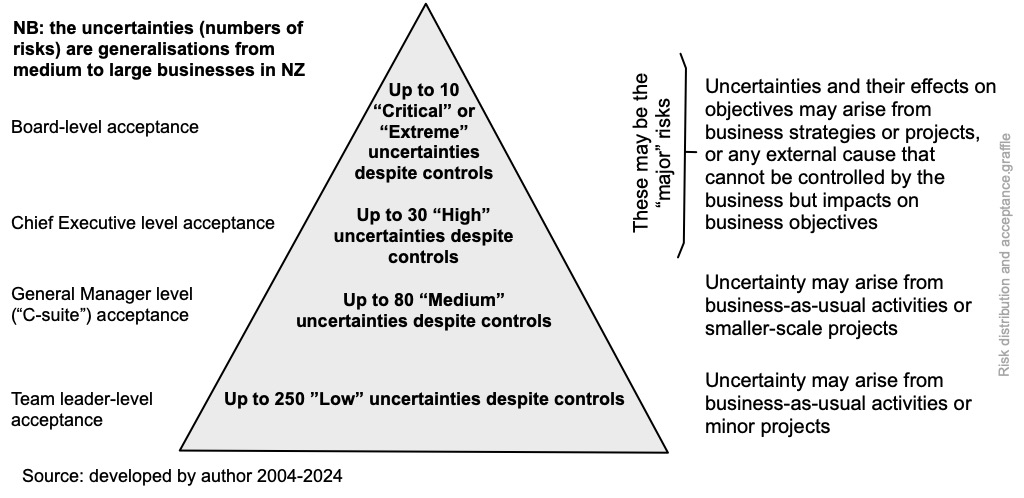
In general, experience suggests there may be up to 10 critical or extreme risks the board or equivalent should monitor. The Chief Executive may need to monitor a further 30 risks and general managers a total of about 80 risks. At team leader level, an organisation may have 250-300 risks. If each risk has several controls, it is clearly not possible for auditors to monitor the effectiveness of each control. Figure 28 is based on personal experience with a range of organisations but is not necessarily correct for your organisation!
At each level the relevant risk owner (“the person with the accountability and authority to manage a risk”) retains day-to-day management control of the risk but must report up if there is a change in the level of risk.
The controls must be also evaluated to determine their effectiveness. In some organisation, predetermined and recorded controls, including duties, responsibilities and lines of communication are set out in an internal control manual. This may be bureaucratic but makes it easier to know who is accountable for what.
There should be a clear separation of duties and (as necessary) rotation of duties to give improved flexibility and (in financial management) reduced opportunities for fraud. Similarly, holidays must be taken by key staff who pay out money.
Board and the audit committee
The board should establish risk management expectations and monitor changes in the external context for risk opportunities and threats and receive and respond to internal audit reports.
Individual directors
The Institute of Directors and Financial Markets Authority (IoD & FMA, 2018) guidance on the role of company directors should be essential reading for the director of any PCBU.
Risk management committee
A risk management committee of senior managers, supported by risk services staff, should periodically (3-6 monthly, depending on the risk climate) review the context, risk sources, emerging risks, opportunities, and management of current major risks. Reporting should be to the board or audit and risk committee.
Senior managers
Senior managers should be monitoring changes in the context of the organisation and uncertainty that could impact on key strategies or objectives. They should also keep under review how the objectives are being achieved and whether there may be better or more cost-effective methods. Reporting should be to the board or audit and risk committee on key areas of uncertainty, as these changes relate to strategic objectives.
Line managers
Line managers should be monitoring changes in the local context of the organisation and any risks that could impact on local objectives. Reporting by line managers should be to their senior managers. Care must be taken that senior managers are not deluged with detail that distracts them from making executive decisions.
The responsibilities of management should include regular checking of control effectiveness generally and as part of risk identification and analysis. This allows the current or controlled level of risk to be determined. Management should identify adequate documentation for a given control and answer the following questions.
- What are the current controls for a particular risk?
- Do those controls keep the risk at a level that is tolerable?
- Are the controls effective and working as intended?
- Can they be demonstrated to be effective?
Risk management services
A senior person (possibly supported by a group) should monitor risks, controls, and risk indicators. Reporting should be to executive management when unexpected changes are occurring that could impact on objectives and to the board on the major risks, how well these are currently being managed and the likely future level of risk after any treatments have been implemented.
Internal audit
Internal audit should keep key controls under review to ensure risks are managed within the agreed risk appetite or tolerability and objectives are achieved. Reporting by internal audit should be independent and to the board or the audit committee. Internal audit may also review the overall effectiveness of the risk management framework and application of the risk management process.
Monitoring by others
There is increasing monitoring by non-governmental organisation of suppliers and organisation in the supply chain. For example, labour standards in factories manufacturing goods for companies in the USA and Europe may be subject to contractual obligations and periodic audit.
It has also been argued that demonstrating due diligence might persuade a regulator that every attempt had been made to comply with legislation.
Reporting to interested parties – external communications
Open and transparent communications via websites, electronic newsletters, annual reports, etc can address the concerns of interested parties. Regulatory agencies generally will prefer to be told about problems, including potential breaches of compliance obligations, before they become major issues resulting in Ministers being questioned in Parliament.
9.3 Management review – integrated monitoring, review and reporting
The Financial Markets Authority (2018) guidance on corporate governance is voluntary for all “entities” other than companies listed on the New Zealand Stock Exchange (NZX); these must comply with the listing requirements and identical guidance on corporate governance.
What and when to monitor for OHS purposes?
For OHS purposes, monitoring might include condition monitoring (Czachur et al., 1997), monitoring workplace conditions (Brookes & Evans, 2019; Coldwell & Keen, 2010; Cook, 2013; FM Global, 2000), and monitoring OHS indicators. Top management should review the management system:
- at planned intervals, perhaps annually, preceding the strategic review
- following a significant event within the organisation or in a similar organisation
- following a major change in the organisation.
Reporting to top management
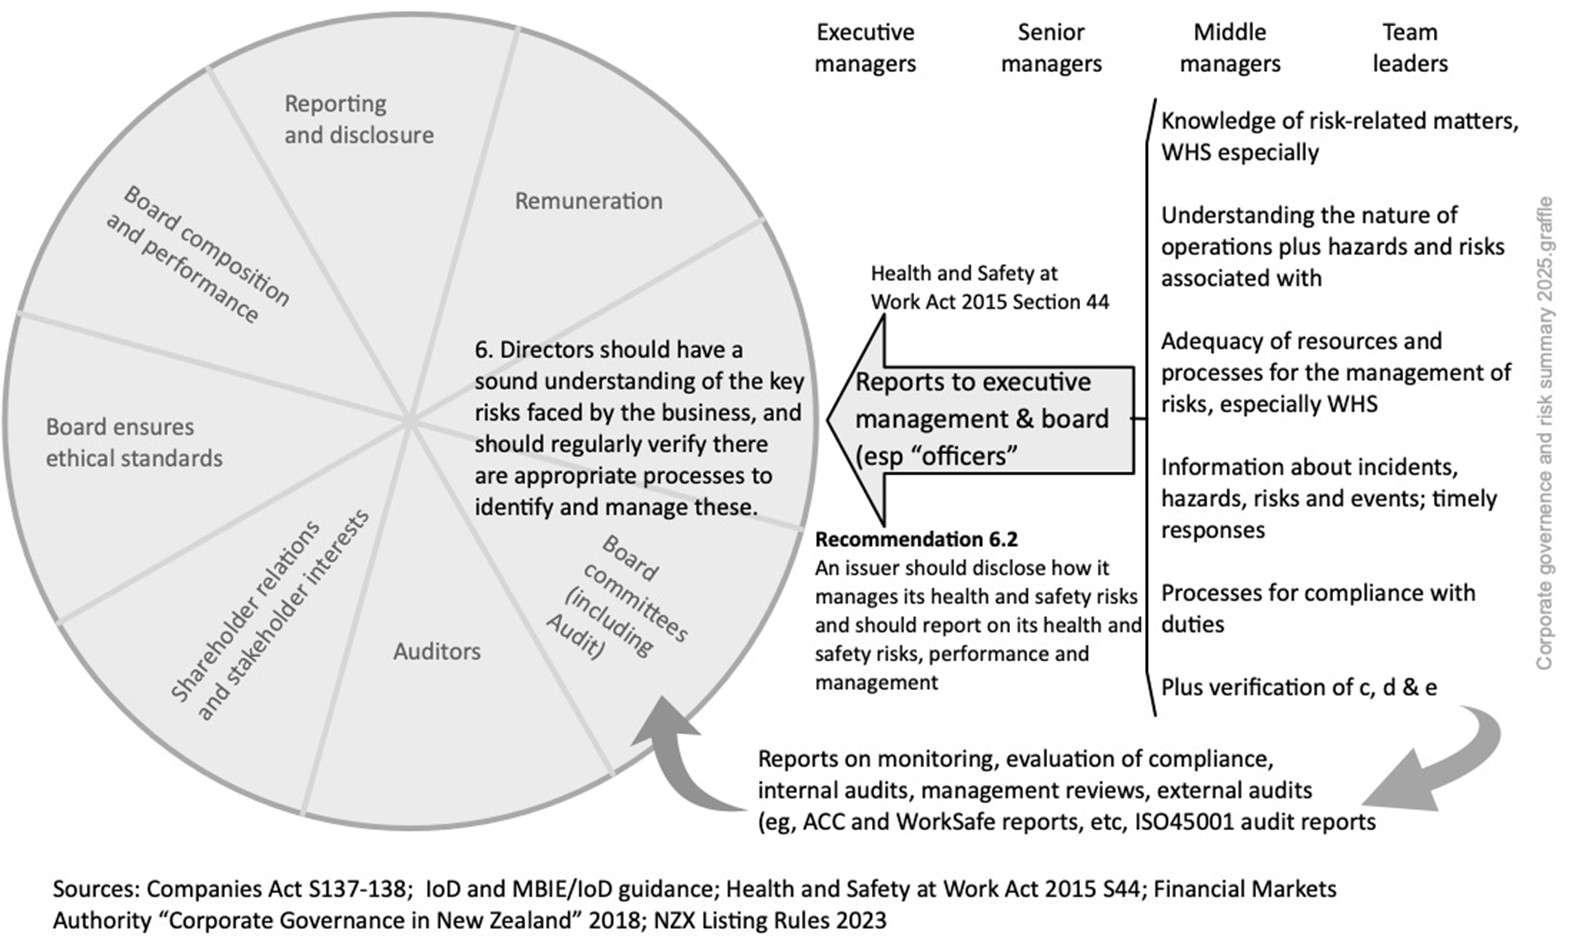
Principle 6 of the FMA (2018) and New Zealand Stock Exchange (2017) guidance both say the board or equivalent should have “a sound understanding of the key risks faced by the business and should regularly verify there are appropriate processes to identify and manage these”. The guidance then adds:
6.1 Boards should ensure there are rigorous risk management processes and internal controls in place.
6.2 Boards should receive and review regular reports about the risk management framework and internal control processes, including any developments about material risks.
6.3 Board reports should include a copy of the entity’s risk register and should highlight the main risks to the entity’s performance and the steps being taken to manage them.
6.4 Boards should report on risk identification, risk management and relevant internal controls to investors and stakeholders, at least once a year.
The board can only comply with legal requirements if it receives reports from management and (for independent assurance) from the external and internal auditors. Management reports might be structured using the safety-related requirements set out in the Health and Safety at Work Act 2015, section 44, as well as the Companies Act, sections 137-138 (diligence and use of reports). Such executive management reports will be based on input from lower levels of management. There might be an annual cycle of management reports designed to keep the board informed about risks arising from business-as-usual, project or strategic activities and the ability to respond to external shocks. Audit reports will generally be submitted to the audit committee of the board. Members of that committee should be independent directors with no financial interest in the business.
The frequency and content of governance reports to top management will reflect the size and complexity of the organisation but they should be “owned” by the board. There is also an expanding list of management system standards. Each makes requirements for management reporting and review.
See O’Neill & Wolfe (2014) for due diligence in Australia and liability of accountants.
The following diagram summarises how risk reporting, monitoring and review might work in practice. Note that text to the right of the bracket is adapted from section 44, HSWA.
9.3.1 Due diligence reporting under HSWA section 44(4)
The following table suggests how officers and “top management” (the “person or group of people who directs and controls an organisation at the highest level” – ie, directors, the executive management team or equivalent) can be kept sufficiently informed about such risks.
Table 8. Commonly mentioned options for compliance with section 44(4), HSWA
| Whether the option aids compliance with Section 44(4) a-f NZ HSWA | ||||||
|---|---|---|---|---|---|---|
| Option | (a) | (b) | (c) | (d) | (e) | (f) |
| Training and education of officers in relevant legislation (the Act, regulations, etc) | X | |||||
| Attendance of officers at conferences and seminars covering matters relevant to the PCBU | X | |||||
| Maintenance of officer training records, either by the officer, or by the PCBU, or both | X | |||||
| Reporting on significant WH&S-related achievements of workers | X | |||||
| Regular reports on PCBU operations, activities, hazards, and risks | X | X | ||||
| Reports and presentations from major contractors to the PCBU | X | X | ||||
| Consideration of other PCBUs in the supply chain and their safety management system | X | X | ||||
| Detailed reports on risk assessments of “major risks” | X | X | X | X | X | |
| Officer tours of sites | X | X | X | X | ||
| Progress with the health and safety plan and related topics | X | |||||
| Reports from managers on progress with their health and safety objectives | X | |||||
| Business cases show resources for health and safety and how they will be maintained | X | |||||
| New significant hazards reported for the reporting period with commentary on each | X | |||||
| Data on worker training, first aid courses (new and refresher), etc for the month | X | |||||
| Indicators, with a strong emphasis on leading and then lagging indicators | X | |||||
| Trends and patterns in: • serious harm incidents for the period with commentary on each • number of injured workers on a gradual, return-to-work (RTW) plan following work incidents • number of injured workers a gradual, RTW plan following non-work incidents • number of RTW plans completed, with workers back at work full time • sickness absence costs and statistics • employee assistance programme data • significant event reports • costs of incidents or events • customer feedback reports or complaints |
X | |||||
| Current ACC experience rating | X | |||||
| Total ACC claims affecting PCBU rating | X | |||||
| Serious harm incidents for the period with commentary on each | X | |||||
| Analysis of “as is” and where we should be “so far as is reasonably practicable” | X | |||||
| Review of policies and reports on activities | X | |||||
| Reasons for non-compliance HSWA | X | |||||
| Changes in legislation and implications for the organisation | X | |||||
| ACC workplace safety management practices status and corrective actions, current experience rating, total claims affecting our rating | X | |||||
| Other audits relevant to WH&S | X | |||||
| Corrective actions from audits, managers reports, etc that have been completed | X | |||||
9.3.2 Reporting using the consequence likelihood matrix
Description
A consequence/likelihood matrix is a qualitative or semi-quantitative risk analysis “tool for ranking and displaying risks by defining ranges for consequence and likelihood”. It is one way of combining qualitative or semi-quantitative estimates of the consequences of a risk and the likelihood of the specified consequence occurring. This tells something about the level of risk – that is, the “magnitude of a risk expressed in terms of the combination of consequences and their likelihood” (ISO31073). However, risk matrices are often poorly designed or improperly used or both creating uncertainty about the results (Peace, 2017b) and must only be used for reporting, not analysis (IEC/ISO31010, 2019, pp. 113-116).
Nature and degree of uncertainty
Many people make assumptions about their matrix, often unstated, including that the matrix:
- was designed for the risk profile of their organisation
- (and related criteria) have been reviewed and revised to take account of any changes in context and risk appetite since original development
- has consequence and likelihood scales giving sufficient detail (“granularity”) to distinguish between risks with apparently similar levels of risk.
These may be very large assumptions that contain considerable uncertainty and make risk analyses using the matrix unreliable. The matrix is for reporting, not analysis, and other techniques should be used.
By its very nature, it is not possible for any matrix to portray a wide range of consequences, and differences between two points on a range may give deceptive ratings. For example:
- a financial consequence scale may have a range point of $1 million so a consequence with an estimated value of $995,000 will lie just below this point, while a consequence with an estimated value of $1,005,000 will lie just above the point; the difference of $10,000 between the values is 1% of the range point
- the difference between a minor workplace injury and a fatality may be millimetres or milliseconds.
Such uncertainties should be made clear in a description of the nature of the risk, and by selecting two (or even three) consequence or likelihood points to give a range of risk levels.
However, the consequence/likelihood matrix can be used for single failure modes or scenarios but, for multiple failure modes, individual risks should be aggregated and compared with risk acceptance criteria.
Applications of the matrix
Risks with multiple consequences can be plotted on a chart to show risk levels for each combination of consequence and likelihood. A matrix can aid “risk ranking” to set priorities, to help with evaluation of risks, or to decide on priorities for further risk analysis or for risk treatment.
The matrix combines a stated consequence on a pre-determined range of consequences with the likelihood of the stated consequence on a pre-determined range of likelihoods. It is often used for negative consequences only but can be designed to show both positive and negative consequences.
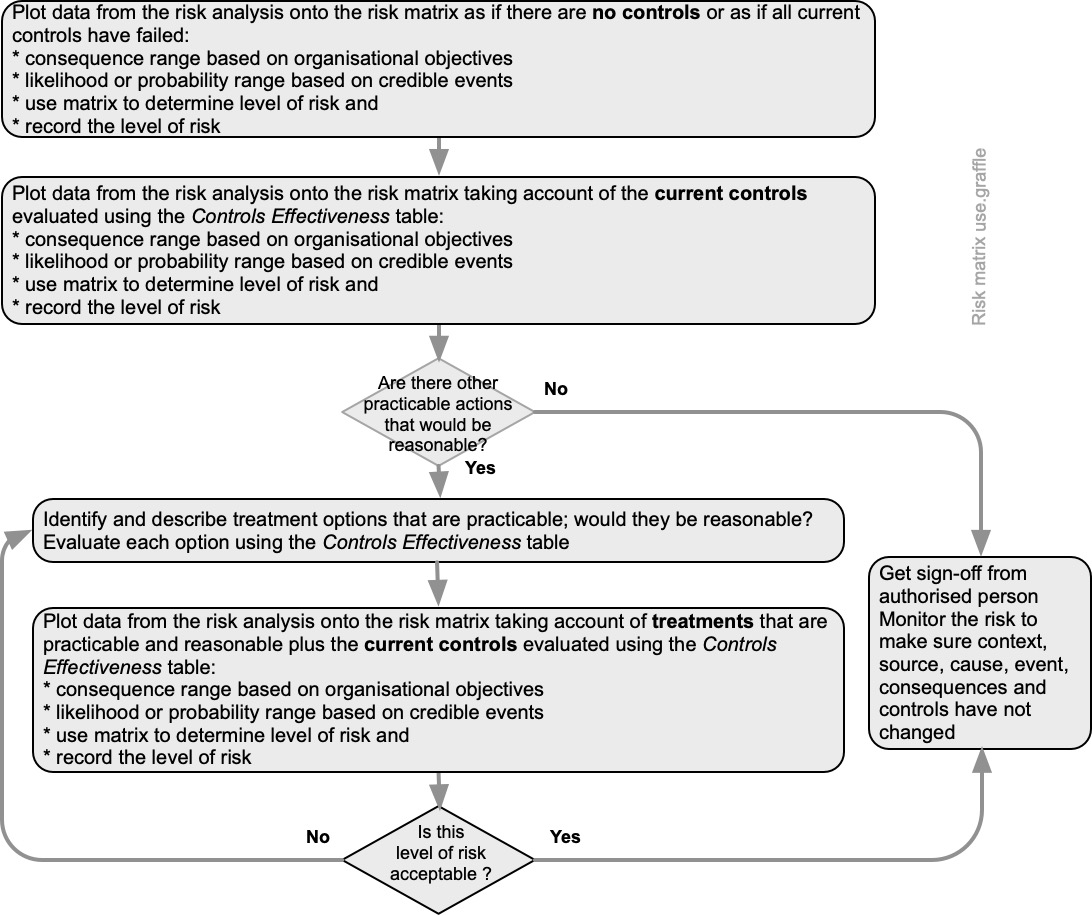
Input
See the process map Figure 30 setting out use of a matrix. The approach enables reporting three level of risk:
- absolute or raw risk (no controls in place or complete failure of all controls)
- current or controlled level of risk (the suite of controls at their current effectiveness)
- treated or target level of risk (the level of risk if selected treatments are fully implemented and are effective).
This approach has the advantage of showing the effectiveness of individual controls (or suites of controls).
The gap between absolute and controlled levels of risk is an indication of the importance of the controls and can aid decisions about monitoring and auditing those controls.
The risks can be tabulated and ranked to show hierarchies of interest (eg, descending level of controlled risk) and where more detailed risk analysis may be needed.
The gaps between absolute and controlled risk and between controlled risk and treated risk may also help show if there are practicable actions that, on further consideration, would be reasonable to implement. They also help understand the risk appetite of the PCBU (the “amount and type of risk that an organisation is willing to pursue or retain”).
9.3.3 Checklists and their design
- What are the objectives of the organisation, activity, system, or item?
- What is the nature and level of uncertainty that could affect achievement of those objectives?
Description
A checklist is a simple management tool for monitoring conditions or to aid response to out-of-normal conditions (Boorman, 2001; Gawande, 2010; IEC/ISO31010, 2019; Toft & Mascie-Taylor, 2005). Checklists can be used to provide a physical or electronic record to:
- confirm performance of activities at an appropriate pause before either some further action or change of state can proceed (known as DO-CONFIRM)
- ensure specific actions are taken in the right order (known as READ-DO)
- confirm the existence or condition of specified assets (READ-DO-CONFIRM)
- aid independent assessment of performance of an activity (READ-DO-CONFIRM).
Resources and capability
A knowledgeable person or team defines the scope, and a checklist design is mapped against an activity, system or process by a person or team with relevant experience or knowledge. Design and validation may be split between people or teams, or validation may be done by trialling with end-users.
DO-CONFIRM checklists (eg, contract initiation) allow users to carry out tasks from memory and experience, stop at a planned pause point and use the checklist to aid confirmation that what was supposed to be done has been done. Comments or notes should be kept to a minimum. An example of how a checklist might be used as a management control for contracts follows. You will need to adapt it for your specific circumstances.
|
After negotiating the terms and conditions for this contract and before releasing this contract for approval by your manager, confirm the following |
|||
|---|---|---|---|
|
This question must be answered |
Yes | No |
Comments or notes |
| Is the contract price within your delegated financial authorities? | |||
| If not, has the manager with appropriate delegated financial authorities approved the price? | |||
| If so, is their sign-off attached to the draft contract and this checklist? | |||
| Have any changes been made to clauses XXX to YYY? | |||
| If yes, were those changes approved by Legal? | |||
| If so, is their sign-off attached to the draft contract and this checklist? | |||
| (etc, etc to a suggested maximum of one page) |
READ-DO checklists usually require users to carry out tasks as they check them off (eg, start-up procedure, aid response to an alarm or emergency). For such purposes, READ-DO checklists should be relatively short, perhaps 5-9 items, capable of completion in 60-90 seconds and with yes/no or ✓ or ✗ responses. An example of how a checklist might be used to aid responses to an emergency or disruption follows. You will need to adapt it for your specific circumstances.
|
Following total power failure, READ the following and DO as instructed |
Done? |
|---|---|
| Tell all staff to save current work and shut down their computer | |
| Shut down all printers and other peripheral equipment | |
| Shut down all electrical equipment and set all light switches to “off” EXCEPT one set of lights at the main entrance | |
| Evacuate all staff to a place of safety | |
| Last person out locks main entry door | |
| (etc, etc to a maximum of nine items) |
READ-DO-CONFIRM checklist responses may be yes/no, scored on a scale (eg, 1 to 5) or a count of sightings (eg, using a “five bar gate” IIII to enable subsequent, simple analysis) and can be used to help record observations (section 21.3.18). If used to validate performance, a DO-CONFIRM checklist may include comments or notes. An example of how a checklist might be used to aid daily housekeeping inspections follows. You will need to adapt it for your specific circumstances.
|
Items to check daily |
Count non conformances |
Comments or notes |
| Wheeled rubbish containers in designated places? | ||
| Fire extinguishers or hoses in designated places? | High rate of missing appliances | |
| Permits-to-work meet company rules? | ||| = 3/4 checked | One failed in main production area |
| Contractors wearing high visibility vests? | One in truck not wearing vest | |
| (etc, etc to a suggested maximum of one page) |
The following draft checklist is for inspection of tanks. It is incomplete and should not be used on real-world tanks without further work, including consultation. For further ideas see FM Global (2020).
| Tank number |
Date of inspection |
||
| Contents (specify) |
% full at time of inspection |
% | |
| Tank component |
Adverse conditions to look for |
Findings |
|
| Bund wall | Drain open, impact damage to wall, cracks | ||
| Area inside bund wall | Vegetation growing, build-up of water or rubbish | ||
| Tank plinths | Cracks, settlement, leaning | ||
| Tank | Leaks at joints, corrosion, missing insulation | ||
| Attached piping | Leaks at joints, corrosion, impact damage, bending due to imposed loads | ||
| Piping supports | Any disconnected | ||
| Vent pipes | Blockage or corrosion | ||
| Level indicator | Indicated level wrong relative to records | ||
| Level control system | Date last tested and results | ||
| Alarm system | Date last tested and results; wiring condition, wires disconnected, siren damaged or tampered with, strobe light not working | ||
| Earthing | Connections to tank or pipes broken; | ||
Outputs
A well-designed checklist can be used by individuals or teams as part of their management and monitoring functions to provide feedback on the status of controls or a record of progress with treatment implementation actions. They are relatively simple to design for known risks, controls, or treatments but of little or no value for emerging or new risks.
9.3.4 Incident, nonconformity, and corrective action
If a nonconformity occurs an organisation should investigate the event and any controls that were less than adequate, take corrective action, and deal with knock-on consequences. Such work should aim to improve achievement of the business objectives.
If an incident or nonconformity (ie, non-fulfilment of a requirement) occurs there should be processes to:
- react to and report the incident or nonconformity
- control and correct the incident or nonconformity
- investigate the incident or nonconformity
- take any necessary follow-up action.
Emergency plans (including for first aid) should be reviewed as part of such a response. See section 7.4.
9.3.5 Investigations and root cause analysis techniques
Table 9 is adapted from IEC62740 (2015) and provides a list and brief description of some commonly used root cause analysis techniques.
Table 9. Brief description of selected root cause analysis techniques
|
Technique |
Description |
| Acci Maps | Acci Maps is primarily a technique for displaying the results of a causal analysis. It requires an organisational model to separate factors into layers and to elicit factors in the layers; applies a version of the counter factual test (see WBA) to determine the causal relations amongst the factors |
| Causal analysis for systems theoretic accident model and process (STAMP) (CAST) | CAST is a technique that examines the entire socio-technical process involved in a focus event. CAST documents the dynamic process leading to the focus event including the socio-technical control structure as well as the constraints that were violated at each level of the control structure |
| Causes tree method (CTM) | CTM is a systematic technique for analysing and graphically depicting the events and conditions that contributed to a focus event. CTM Is similar to the ‘why’ method in concept, but builds a more complex tree and explicitly considers technical, organisational, human, and environmental causes |
| Events and causal factors (ECF) charting | ECF analysis identifies the time sequence of a series of tasks and/or actions and the surrounding conditions leading to a focus event. These are displayed in a cause-effect diagram |
| Fault tree and success tree analysis (section 21.3.11 in this book) | Fault tree is a graphic display of information to aid the user in conducting a deductive analysis to determine critical paths to failure, which are displayed graphically in a logic tree diagram. Success trees analyse how success might be achieved |
| Fishbone or Ishikawa diagram (section 21.3.12) | The Fishbone or Ishikawa diagram is a technique that helps identify, analyse, and present the possible causes of a focus event. The technique illustrates the relationship between the focus event and all the factors that may influence it |
| Management oversight and risk tree (MORT)
Section 21.3.24 in this book |
The MORT chart is a pre-populated fault tree with events, usually faults or oversights, expressed in generic terms. The MORT tree contains two main branches and many subbranches giving a high level of detail. One main branch identifies about 130 specific control factors while the other main branch identifies over 100 management system factors. The chart also contains a further 30 information system factors common to both main branches of the tree |
| Safety through organisational learning (SOL) | SOL is a checklist-driven analysis tool, oriented towards focus events in nuclear power stations. Results are in the visual form of a time-actor diagram, derived from the MES/STEP method |
| Tripod Beta | Tripod Beta is a tree diagram representation of the causal network, focusing on human factors and looking for failures in the organisation that can cause human errors |
| Why method | The ‘why’ method guides the analysis through the causal chain by asking the question why several times |
| Why-because analysis (WBA) | WBA establishes the network of causal factors responsible for a focus event using a two-factor comparison, the counter factual test. The network of factors is displayed in a “why-because” graph |
9.3.6 Continual improvement and as low as is reasonably practicable
Continual or continuous?
Continual means “constantly or frequently occurring” and is often used to mean happening frequently, with intervals between (Oxford University Press Ltd, 2022). Continuous means “without interruption, forming a series with no exceptions or reversals”.
See clause 10.3 and annex A.10.3 in ISO45001 for further guidance.
As low as is reasonably practicable
The as low as is reasonably practicable requirements of the Act mean that if an improvement is both practicable and reasonable it must be implemented in a reasonable period and without unnecessary delay.
Monitoring the external and internal context of a PCBU will show the need to revise the OHSMS. Monitoring is covered in section 9.1 of this book. Several of the useful management techniques listed on page 85 help identify changes that might lead to continual improvement.
Actions
It is not necessary to wait for a management review or the outcomes of an investigation into an incident to improve management of an organisation. This might be done by:
- enhancing performance
- improving the organisational culture that supports the overall management system
- promoting worker participation in such improvements
- communicating the results of such work to the workers, other stakeholders and (in relevant instances) regulatory agencies
- updating documented information as evidence of continual improvement.
9.4 Identifying what’s missing in the management system
The purpose of a management system is to help a PCBU achieve its objectives or goals. For work health and safety identify a specific goal that is Specific, Measurable, Achievable, Realistic, and Timely – SMART. Mapping what is already in a management system and identifying what is missing will help develop an action plan for improvement. This can be done using Fishbone or Ishikawa analysis (section 21.3.12).
9.5 Chapter summary
This chapter suggests how a PCBU could structure monitoring and review activities to help reduce uncertainty about the achievement of its objectives. The design and use of simple checklists can help ensure that a sequence of controls is carried out correctly.
Incident investigation is a major topic in itself and may be the subject of another paper.
9.6 References used in this chapter
Boorman, D. (2001). Today’s electronic checklists reduce likelihood of crew errors and help prevent mishaps. ICAO Journal, 1, 17-36. http://www.icao.int/publications/
Brookes, J., & Evans, G. (2019). Monitoring metal working fluid mist using particle counters: summary of a technical workshop [Research Report RR1149]. Health and Safety Executive, Buxton. https://www.hse.gov.uk/research/publish.htm
Coldwell, M., & Keen, C. (2010). A small survey of exposure to stainless steel welding fume [Research Report RR0770]. Health and Safety Executive, Buxton. https://www.hse.gov.uk/research/publish.htm
Cook, J. (2013). Assessment of exposure to carcinogens and asthmagens in the contract import, processing and repackaging industries [Research Report RR0983]. Health and Safety Executive, Buxton. https://www.hse.gov.uk/research/publish.htm
Czachur, K., Bright, C., & Beic-Khorasani, R. (1997). Condition monitoring to enhance safety [Contract Research Report CRR120]. Health and Safety Executive, Buxton. https://www.hse.gov.uk/research/publish.htm
FM Global. (2000). Monitoring and Diagnosis of Vibration in Rotating Machinery [Property Loss Prevention Data Sheet 17-4]. Author, Johnston, RI. http://www.fmglobal.com
FM Global. (2020). Flammable liquid storage tanks [Property Loss Prevention Data Sheet 7-88]. Author, Johnston, RI. http://www.fmglobal.com
FMA. (2018). Corporate Governance in New Zealand. Principles and Guidelines: A Handbook for Directors, Executives and Advisors. Financial Markets Authority, Wellington. http://www.fma.govt.nz/
Gawande, A. (2010). The checklist manifesto: How to get things right. Profile Books Ltd.
IEC62740: 2015 Root cause analysis (RCA), International Electrotechnical Commission, Geneva. https://www.standards.govt.nz/
IEC/ISO31010: 2019 Risk management – Risk assessment techniques, International Electrotechnical Commission,, Geneva.
IoD, & FMA. (2018). The essentials of being a director [Guidance Note]. Financial Markets Authority, Wellington. https://fma.govt.nz/
Knight, R. (2020). Corporate Reputation in Crisis: The Impact on Shareholder Value. Oxford Metrica, Oxford. https://www.oxfordmetrica.com/en/web/reputation-and-risk.aspx
Knight, R., & Pretty, D. (2002). The Impact of Catastrophes on Shareholder Value [Report 2002/001]. Oxford. http://www.readysolutionsinc.com/assets/oxford-rpt-cat-sh-value.pdf
Macfie, R. (2021). Tragedy at Pike River mine: how and why 29 men died (2nd ed.). Awa Press.
NZX. (2017). Corporate Governance Code [Standard]. New Zealand Stock Exchange, Wellington. https://nzx.com/files/static/cms-documents//NZX_Corporate_Governance_Code_2017.pdf
O’Neill, S., & Wolfe, K. (2014). Officers’ due diligence: Is work health and safety an accounting problem? J Health & Safety Research & Practice, 6(1), 15-21. https://www.aihs.org.au/news-and-publications/publications
Concise Oxford English Dictionary, Oxford University Press Ltd. (2022).
Peace, C. (2017b). The risk matrix: uncertain results? Policy and Practice in Health and Safety, 15(2), 131-144. https://doi.org/10.1080/14773996.2017.1348571
Peace, C., Mabin, V., & Cordery, C. (2017). Due diligence: a panacea for health and safety risk governance? Policy and Practice in Health and Safety, 15(1), 19-37. https://doi.org/10.1080/14773996.2016.1275497
Rae, A., Provan, D., Weber, D. E., et al. (2018). Safety clutter: the accumulation and persistence of ‘safety’ work that does not contribute to operational safety. Policy and Practice in Health and Safety, 16(2), 194-211. https://doi.org/10.1080/14773996.2018.1491147
Rigby, D. K. (2017). Management Tools 2017: An executive’s guide [Report]. Bain & Co, https://www.bain.com/insights/topics/management-tools-and-trends/
Toft, B., & Mascie-Taylor, H. (2005). Involuntary automaticity: a work-system induced risk to safe health care. Health Services Management Research, 18, 211-216.
Ward, J., Haslam, C., & Haslam, R. (2008). The impact of health and safety management on organisations and their staff [Research Report]. IOSH Publishing Ltd, Leicester. http://www.iosh.co.uk/impmanagement
