1 Management systems and systems thinking in OHS
1.1 Chapter overview
Cross reference to ISO45001; ISO31000; Annex SL clauses 6.1 and 8.1; and SafePlus (section 2.2.5).
Definitions of italicised terms are in the Glossary.
Check for key readings, webinars, interviews, and videos for other resources.
Key readings
You should read section 11.2.2 of this book on uncertainty to understand why organisations need to manage uncertainty by applying systems.
Some of this chapter is adapted from Robbins et al. (2018), available as an ebook. Waterman et al. (1980) and Makin & Winder (2008) are key to understanding interdependency characteristics of systems.
See also OHSBok chapters on Occupational health and safety management systems (Karanikas & Pryor, 2021), Systems (Borys et al., 2012) and The Organisation (Hopkins et al., 2020).
Does occupational health and safety help improve the health of organisations? See Lim et al. (2018)
Relevant New Zealand law
- Health and Safety at Work Act 2015
- Health and Safety at Work (Worker Engagement, Participation, and Representation) Regulations 2016
- Health and Safety at Work (General Risk and Workplace Management) Regulations 2016
- Health and Safety at Work (Major Hazard Facilities) Regulations 2016, especially Regulation 39
Key questions
What is or will be the impact of artificial intelligence on the business?
If risk is the “effect of uncertainty on objectives”:
- what are the objectives of the organisation, PCBU, activity, system, or item?
- what are the uncertainties about achieving the objectives?
- how do or will those uncertainties affect achievement of those objectives?
- how can those objectives be achieved by a systematic, management approach?
1.2 Models and management
Models are built with elements from various sources, including theories and empirical evidence. They can mediate between theory and practice, or help develop theory, or aid investigation of a phenomenon to discover evidence (Morrison & Morgan, 1999). That is, models are both a means to, and source of, knowledge.
However, “all models are wrong but some models are useful” (Box & Luceño, 1997, p. 6) but (p. 9) “… since all models are wrong, it is very important to know what to worry about; or, to put it in another way, what models are likely to produce procedures that work in practice (where exact assumptions are never true)”.
The same thinking can be applied to models of management systems. Some are a reasonable representation of a system, but their weaknesses need to be understood. This chapter discusses a range of management models, some applicable to occupational health and safety. When reading and using the content please remember that the models are useful to help our understanding but are not perfect representations of organisations and management systems.
1.3 Evolution of management and OHSMS thinking
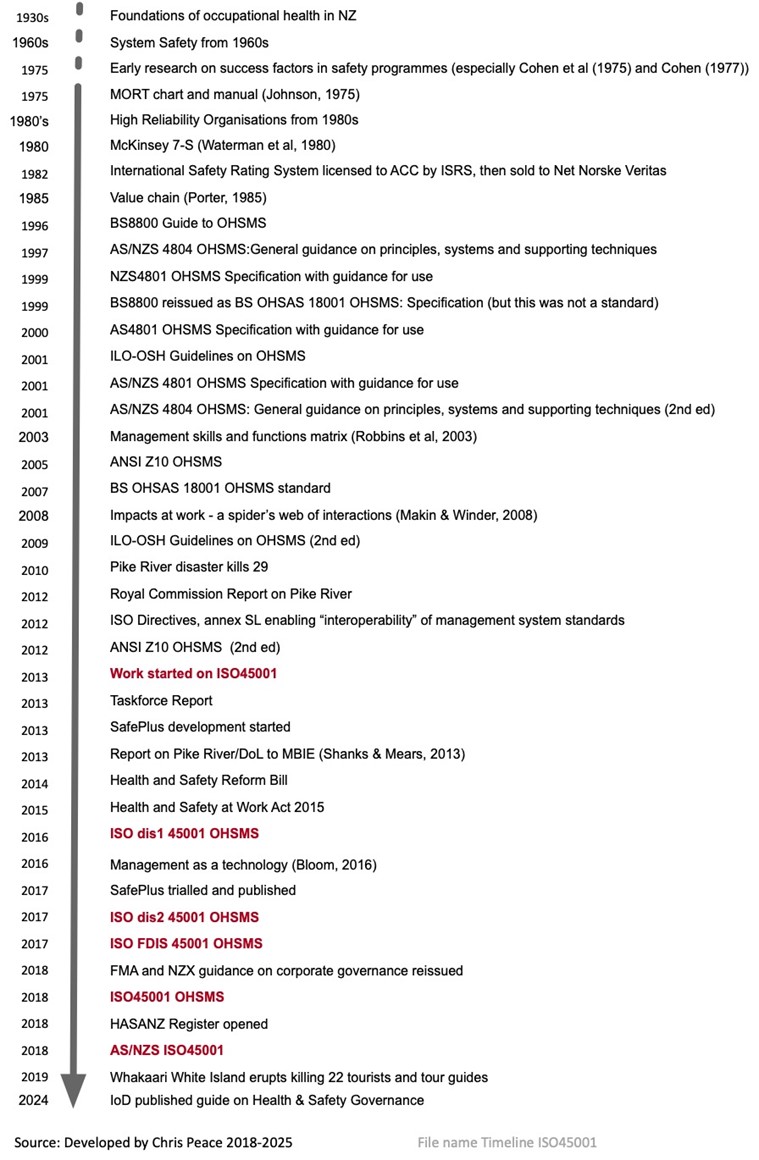
We need to understand the development of occupational health and safety management system (OHSMS) thinking as part of management thinking if we are to advise top management about system implementation in a business or undertaking, including whether such management systems work. Figure 3, adapted from Dekker (2019) and Peace et al. (2019), summarises some key dates for aspects of OHSMS thinking in New Zealand, Australia, and elsewhere.
Changing views of organisations
Over time, our view of organisations has changed, as summarised in Table 1. Compare the contemporary views of organisations as dynamic systems (Robbins et al., 2003) with Cohen’s (1977, p. 177) seven factors that are evidence of successful OHS (section 2.2 of this book). Dekker (2014) has a similar old view/new view approach to “human error” (and explains why that term should be thought of as redundant).
Table 1. The changing organisation
| Traditional organisation | Contemporary organisation |
|---|---|
| Stable | Dynamic |
| Inflexible | Flexible |
| Job-focused | Skills-focused |
| Work is defined by job positions | Work is defined in terms of tasks to be done |
| Permanent jobs | Temporary jobs (the “gig” economy) |
| Relatively homogenous workforce | Diverse workforce |
| Individual-oriented | Team-oriented |
| Command-oriented | Involvement-oriented |
| Managers always make decisions | Employees participate in decision making |
| Hierarchical relationships | Lateral and networked relationships |
| Rule-oriented | Customer-oriented |
| Workdays defined as 9 to 5 | Workdays have no time boundaries |
| Work at organisational facility during specific hours | Work anywhere, anytime |
Management as a technology
A longitudinal study by Bloom et al. (2016) considered whether management could be thought of as a technology. They developed a model that predicted:
(i) a positive effect of management on firm performance; (ii) a positive relationship between product market competition and average management quality (part of which stems from the larger covariance between management with firm size as competition strengthens); and (iii) a rise (fall) in the level (dispersion) of management with firm age.
They also found “that differences in management practices account for about 30% of cross-country total factor productivity differences”. New Zealand was middle ranking in their results, but this may have been because relatively few large firms (PCBUs) were included in their study.
If management is thought of as a technology, what needs to be done to maintain its optimal performance and adapt if or when the context changes? What skills do managers need at different levels if they are to have a positive effect on the performance of a business or undertaking?
1.3.1 Managing systems
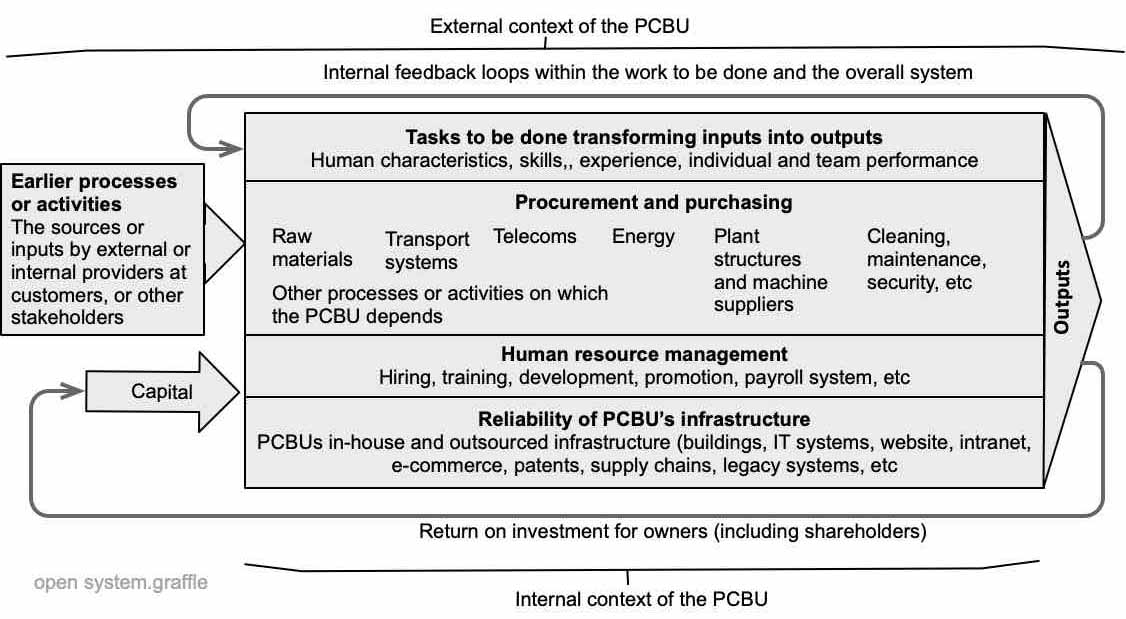
A manager is employed to manage a system, defined as sets of interrelated and interdependent parts arranged in a manner that produces a unified whole. Systems can be open or closed (Robbins et al., 2003, pp. 16-18) but businesses and undertakings are always open in that they interact dynamically with their environment, as summarised in Figure 4. Those dynamic interactions create uncertainty.
The inputs come from outside the organisation and, after transformation, are outputs (goods or services of value to customers). Sales provide revenue that can be used to pay wages and taxes. A business may also need to pay dividends to its owners. If an organisation fails to satisfy its stakeholders, it must adapt or cease to exist.
A business or undertaking has interdependent parts, each with goals and objectives that must be fulfilled if it is to achieve its high-level goals. The role of a manager is to coordinate the inputs and enable their transformation to achieve the required outputs.
In this model, managers can be visualised as coordinating and integrating work at three levels:
- A first line manager or team leader will have a narrow set of responsibilities, limited to one area, and possibly providing services to other teams.
- A middle- or second-line manager has a wider set of responsibilities, coordinating the work of two or more first line teams.
- A top manager might be accountable for a wide range of organisational areas, possibly spanning the whole business or undertaking.
At each level an effective manager must be aware of the “interdependency characteristic of systems” as they relate to their own and other organisations. For example, the marketing team must anticipate changes in customer tastes and work with the product development team to develop goods or services that can be delivered by the production team.
At each level a manager must also know how to manage the uncertainties they are accountable for. This model is often known as three lines of defence (section 6.2.5). In larger organisations there may be specialists who provide services across the business or undertaking. Such specialists include occupational health and safety practitioners or professionals, risk managers, compliance managers, and internal auditors who operate in the third level.
An effective manager will need managerial skills that include (Drucker, 2008) effective decision making; making successful people-decisions; communicating within and outside the organisation; properly using controls and measurements (including leading and lagging indicators (GHSL, 2019)); skill in budgeting and planning; and skill in using modern tools and concepts of information technology.
More recently, (Robbins et al., 2018) suggested that important managerial skills include managing human capital, change; decision-making processes, strategy and innovation, logistics and technology. Managers must also inspire commitment; structure work and achieving objectives; facilitating the psychological and social contexts of work; and purposefully network with others.
These can also be mapped against the Plan Do Study Act model (Moen, 2010).
1.4 Interdependency in management systems
The interdependency (sometimes symbiotic) characteristics of management systems has been noted by several authors (eg, Johnson, 1975; Karanikas et al., 2020; Makin, A. M. & Winder, 2008; Waterman et al., 1980). Note that Karanikas et al. argued that a distinction between systematic management and system thinking needs to be emphasised.
1.4.1 McKinsey 7-S model
Work in the 1980s (Waterman et al., 1980) led to development of the McKinsey 7-S model that was used to help identify high level factors found in successful businesses in the USA (Peters & Waterman, 1982). The following version of the diagram shows the original model (seven interlinked circles, each with words starting with “S”). The sets of questions related to each S and yellow boxes suggesting how clauses in ISO45001 relate to each S were developed by Peace (2019, p. 120). The 7-S model can be used to help diagnose what needs to be changed and how that might affect other aspects of a management system. For example, the 7-S model can be used to help develop successful strategy by including necessary changes in the other six components (Kumar & Geetika, 2019). The interdependency characteristic of systems is clear in this 7-S model, with each factor influencing the others.
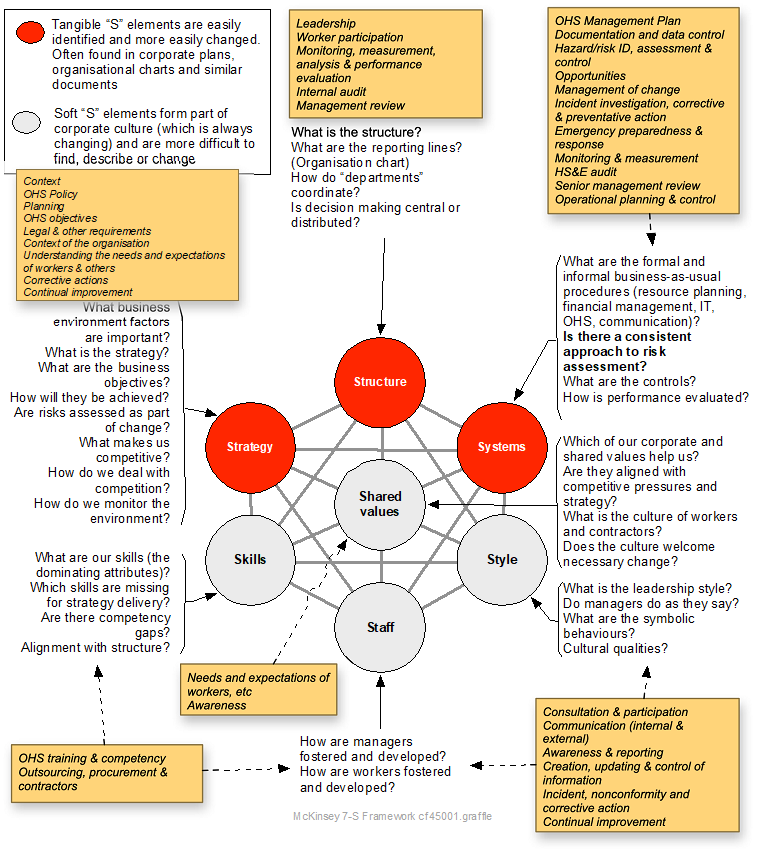
Source: Adapted from Peace (2019, p. 120) and Waterman et al. (1980)
1.4.2 Makin & Winder model
Makin & Winder (2009) developed the impacts at work model specifically for OHS that shows how the interdependency characteristic of systems produce impacts at work. The model has eight nodes, each linked to every other node, showing that a change or disfunction in one will affect the other nodes. This model can also be used to help diagnose what needs to be changed and how that might affect other aspects of a management system. The interdependency characteristic of systems is also evident in the spider’s web model. However, it does not include corporate governance or oversight by top management.
1.4.3 High reliability organisations
The high reliability organisation (HRO) concept developed in the 1980s (Lekka, 2011), in part as a response to Normal Accident Theory (Perrow, 1999) which posited that complex, tightly coupled systems could fail catastrophically causing considerable harm. Normal Accident Theory did not account for some organisations that have exemplary performance and remain error free for very long periods of time and can therefore claim to be HROs (Roberts, K., 1989).
As originally described, a HRO will be typified by (Cantu et al., 2020):
Preoccupation with Failure: Be alert to failures, especially as indicated by weak signals. Prepare for and prevent failure where feasible and respond and recover from failures when they do occur.
Reluctance to Simplify: Do not overlook subtle aspects of complex problems and avoid classifications of conditions into convenient categories.
Commitment to Resilience: Problem events may be unavoidable but an organization can identify, plan for, and execute recovery and service‐restoral measures to ensure continued delivery of products or services.
Sensitivity to Operations: HROs realize that potential problems can lie in a little‐recognized location in a process or system. They acknowledge that failures usually are the result of more than one source or cause.
Deference to Expertise: Ensure that those with the specific problem‐solving knowledge, skills and abilities are engaged in providing solutions and avoid restrictions caused by hierarchy and chain‐of‐command constraints.
1.4.4 System safety
System safety developed from dissatisfaction with the traditional trial-and-error approach to designing complex (and expensive) systems that later failed in service. In the 1960s in the USA various military and NASA standards were initiated to help avoid such failures. In the 1970s the management oversight and risk tree (MORT) approach was developed, followed by other approaches in the 1980s.
There is no generally accepted definition of system safety but Stephans & Stephenson (2004, p. 11) suggested it is:
“The discipline that uses systematic engineering and management techniques to aid in making systems safe throughout their life cycles”.
In relation to dependability, “system” is defined in ISO9001 to be a “set of interrelated or interconnecting elements”. A system will have a defined purpose, stated conditions of operation/use, and defined boundaries.
Stephans & Stephenson (2004, p. 12) defined “system” as including people, procedures, and plant and hardware performing specific tasks in a given environment. They argued that safety:
- is a line management responsibility
- is productive
- requires upstream effort)
- depends on the safety precedence sequence (design for minimum hazard; provide safety and warning devices; control with procedures and training; accept remaining residual hazards). Note the similarity to the hierarchy of control in section 6.2.2 and the Health and Safety at Work (General Risk and Workplace Management) Regulations 2016.
Nertney had earlier developed the “Nertney Wheel” further showing the interdependency characteristic (Figure 6). See section 7.1.4 for guidance on using the technique.
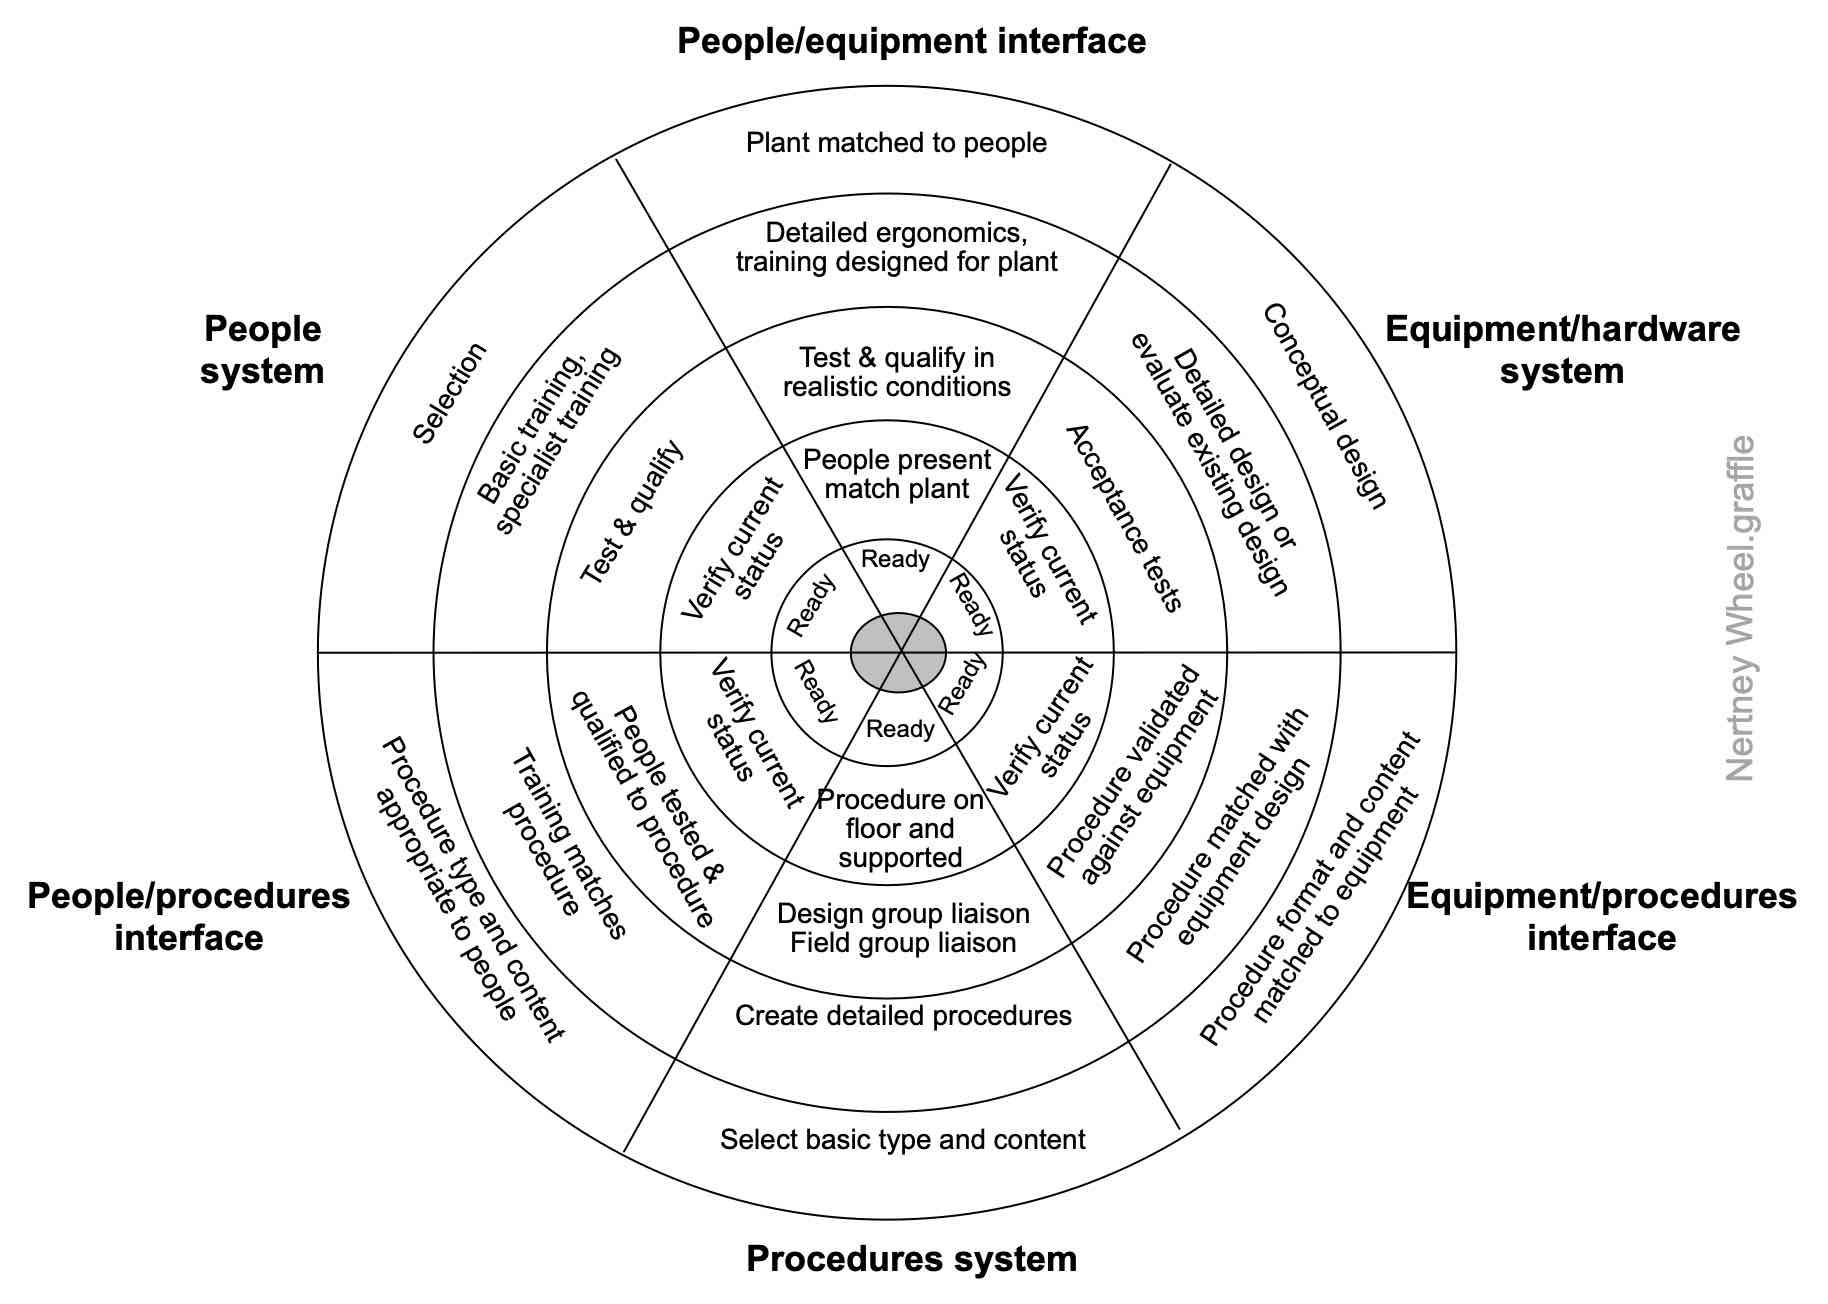
Source: Adapted with permission from Frei et al. (2014)
Some system safety tools and techniques also help identify hazards. Many are described in section 21.3 of this book, An A to Z of techniques.
1.4.5 Management oversight and risk tree (MORT)
The Management oversight and risk tree chart and manual (Johnson, 1975; NRI, 2002, 2009a) was originally designed in the 1970s to aid incident investigation in the US nuclear power industry. It also shows the interdependency characteristic and can be used to proactively diagnose problems or expand thinking about health and safety management.
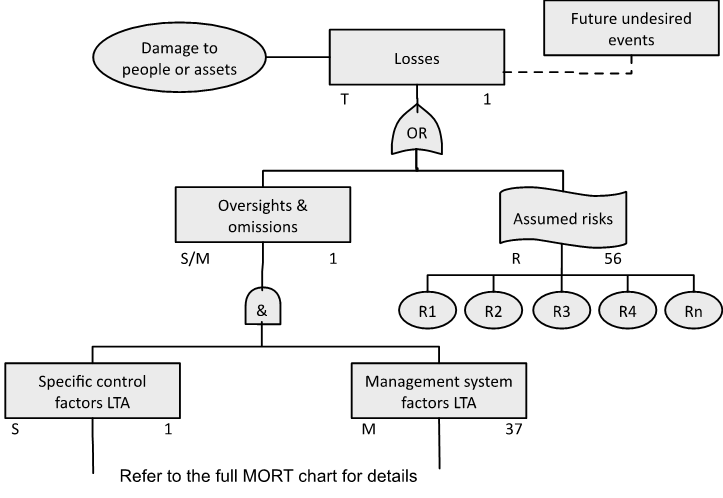
Source: Adapted with permission from NRI (2009a). For use with the Management Oversight and Risk Tree analytical logic diagram.
The chart is a fully developed, generic fault tree analysis of “losses” arising from specific failures and management failures. The full chart is very large (it is best printed on an A1 sheet) with only the top section of the chart shown in Figure 7. It is also suggested in section 10.1.1 as an audit technique.
Download and review a copy of the MORT chart and handbook to see how many of the subtrees are linked to different parts of the main tree. For example, subtree SD1 (technical information systems) is connected to the main tree in four places.
1.4.6 Integrated management systems
Considerable attention has recently been paid to the integration of management systems. Based on a literature review (Yang et al., 2022), the National Safety Council (2023) published a report on the “New Value of Safety” that suggested how a range of management specialities could be incorporated in a single framework. Peace (2024a) showed how ISO/IEC Annex SL (2020) could be used as the framework on which integrated management systems could be developed by a PCBU.
1.5 Chapter summary
The overall management system of a PCBU should include the occupational health and safety management system (OHSMS). Therefore, it is important that the OHSMS integrates seamlessly in the overall management system.
This chapter has placed some basic management system concepts in a timeline showing the development of management system thinking. Several models are shown that can be used to help investigate and diagnose the effectiveness of management in a PCBU.
1.6 References used in this chapter
Bloom, N., Raffaella, S., & Van Reenen, J. (2016). Management as a technology? [Working Paper 22327]. National Bureau of Economic Research, http://www.nber.org/papers/w22327
Borys, D., Cowley, S., Tepe, S., et al. (2012). Systems. In Core Body of Knowledge for the Generalist OHS Professional. Australian Institute of Health and Safety. https://www.ohsbok.org.au/
Box, G., & Luceño, A. (1997). Statistical Control By Monitoring and Feedback Adjustment. Wiley.
Cantu, J., Tolk, J., Fritts, S., et al. (2020). High Reliability Organization (HRO) systematic literature review: Discovery of culture as a foundational hallmark. Journal of Contingencies and Crisis Management, 28, 399-410. https://doi.org/10.1111/1468-5973.12293
Cohen, A. (1977). Factors in successful occupational-safety programs. Journal of Safety Research, 9(4), 168-178.
Dekker, S. (2014). The Field Guide to Understanding ‘Human Error’ (3rd ed.). Ashgate Publishing Ltd.
Dekker, S. (2019). Foundations of safety science: A century of understanding accidents and disasters. CRC Press.
Frei, R., Garforth, A., Kingston, J., et al. (2014). Using Operational Readiness to improve the Management of Risk [Working Paper WP2 Vol 1 Concepts]. Noordwijk Risk Initiative Foundation, Delft. www.nri.eu.com
Hopkins, A., Toohey, J., Else, D., et al. (2020). The organisation. In Core Body of Knowledge for Generalist OHS Professionals. Australian Institute of Health and Safety. https://www.ohsbok.org.au/
ISO/IEC Annex SL. (2020). Proposals for management system standards. In Directives, Part 1: Consolidated ISO Supplement – Procedures specific to ISO (11th ed.). International Standards Organization. https://www.iso.org/directives-and-policies.html
Johnson, W. G. (1975). MORT: The management oversight and risk tree. Journal of Safety Research, 7(1), 4-15.
Karanikas, N., Popovich, A., Steele, S., et al. (2020). Symbiotic types of systems thinking with systematic management in occupational health & safety. Safety Science, 128, 104752. https://doi.org/10.1016/j.ssci.2020.104752
Karanikas, N., & Pryor, P. (2021). OHS management systems. In Core Body of Knowledge for the Generalist OHS Professional. Australian Institute of Health and Safety. https://www.ohsbok.org.au/chapter-12-2-ohs-management-systems/#1548328004983-899b528e-01e4
Katz, R. L. (1974). Skills of an Effective Administrator. Harvard Business Review, 52(5), 90.
Kumar, S., & Geetika. (2019). The McKinsey 7S Model helps in Strategy implementation: A Theoretical Foundation. Tecnia Journal of Management Studies, 14(1). https://ssrn.com/abstract=3993590
Lekka, C. (2011). High reliability organisations: A review of the literature [Research Report RR0899]. Health and Safety Executive, Buxton. https://www.hse.gov.uk/research/publish.htm
Lim, R., Rousseau, J.-B., & Weddie, B. (2018). The symbiotic relationship between organizational health and safety. McKinsey Quarterly. www.mckinsey.com
Makin, A.-M., & Winder, C. (2009). Managing hazards in the workplace using organisational safety management systems: a safe place, safe person, safe systems approach. Journal of Risk Research, 12(3/4), 329-343. https://doi.org/10.1080/13669870802658998
Makin, A. M., & Winder, C. (2008). A new conceptual framework to improve the application of occupational health and safety management systems. Safety Science, 46(6), 935-948. https://doi.org/10.1016/j.ssci.2007.11.011w
Morrison, M., & Morgan, M. (1999). Models as mediating instruments. In M. Morgan & M. Morrison (Eds.), Models as mediators: perspectives on natural and social science (pp. 10-37). Cambridge University Press.
National Safety Council. (2023). The New Value of Safety and Health in a Changing World [Executive Summary]. Author, https://www.nsc.org/workplace/resources/new-value-of-safety?
NRI. (2002). MORT – Management Oversight and Risk Tree [Technical Guide NRI-2]. Noordwijk Risk Initiative Foundation, Delft. www.nri.eu.com
NRI. (2009a). MORT – Management Oversight and Risk Tree [Report NRI2-2009-EN]. Noordwijk Risk Initiative Foundation, Delft. www.nri.eu.com
Peace, C. (2019). The effectiveness of risk assessments in informing decision makers [PhD thesis, Victoria University of Wellington]. New Zealand. https://doi.org/10.26686/wgtn.17142020.v1
Peace, C. (2024a). Integrating management systems in the energy sector: the case of the electricity industry in New Zealand. NZ Journal of Health and Safety Practice, 1(1). https://doi.org/10.26686/nzjhsp.v1i1.8680
Peace, C., Lamm, F., Dearsly, G., et al. (2019). The evolution of the OHS profession in New Zealand. Safety Science, 120, 254-262. https://doi.org/10.1016/j.ssci.2019.07.005
Perrow, C. (1999). Normal Accidents: living with high-risk technologies. Princeton University Press.
Peters, T., & Waterman, R. (1982). In Search of Excellence: lessons from America’s best-run companies. Harper & Row.
Robbins, S., Bergman, R., Stagg, I., et al. (2003). Management (3rd ed.). Pearson Education Ltd.
Robbins, S., Bergman, R., Stagg, I., et al. (2018). Management (8th ed.). Pearson Australia.
Roberts, K. (1989). New challenges in organizational research: high reliability organizations. Industrial crisis quarterly, 3(2), 111-125. https://doi.org/10.1177/108602668900300202
Stephans, R., & Stephenson, J. (2004). System Safety for the 21st Century (2nd ed.). John Wiley & Sons.
Waterman, R., Peters, T., & Phillips, J. (1980). Structure is not Organization. Business Horizons, 23(3), 14-25.
Yang, M., Chen, C., Yuan, S., et al. (2022). Value of Safety [Literature review]. Delft University of Technology,
image Long descriptions
Figure 3: Some Key Dates for Management and OHSMS Thinking – Long description
A structured chronological overview of major developments in occupational health and safety management systems (OHSMS), spanning from the 1930s to 2023. The timeline is attributed to Chris Peace and visually organised using colour-coded text, bold emphasis, and directional arrows to guide interpretation and highlight progression.
1930s–1970s: Foundational Thinking
- 1930s: Establishment of occupational health foundations in New Zealand.
- 1960s: Introduction of System Safety principles (MIL STD), marking the beginning of formal safety systems thinking.
- 1970s:
- Research into safety engineering success factors, notably by Cohen et al. (1975).
- Development of the MORT (Management Oversight and Risk Tree) chart and manual by Johnson (1973), a structured approach to accident analysis.
1980s–1990s: Frameworks and Early Standards
- 1980s:
- Emergence of High Reliability Organisations (HROs), emphasising consistent performance in high-risk environments.
- Introduction of McKinney’s ‘5 Ps’ framework (1988), a model for organisational safety culture.
- 1991: International Safety Rating System licensed to ACC by IRS, later adopted by the National Safety Council USA.
- 1994: Porter’s Value Chain Model applied to safety, linking organisational functions to risk management.
- 1995: Publication of BS8800, a guide to implementing OHSMS.
1999–2004: National and International Standardisation
- 1999:
- AS/NZS 4804: Guidelines on OHSMS principles and techniques.
- AS/NZS ISO14001: Specification with guidance for use.
- 2001:
- BS8800 reissued as BS OHSAS18001, initiating ISO review processes.
- ILO-OH Guidelines on Occupational Safety and Health Management Systems.
- 2002:
- AS/NZS 4801: Specification with guidance for use.
- AS/NZS 4804: Updated guidelines on OHSMS.
- 2004:
- Research on workplace impacts as sources of wellbeing and distress.
- NZS HB205: Harmonised standard for risk management principles.
2007–2018: Risk Management and Global Standards
- 2007: AS/NZS ISO31000: Risk Management Principles and Guidelines.
- 2011: ISO31000 formally adopted internationally.
- 2018: ISO45001 published, establishing a global standard for OHSMS.
Visual Cues for Accessibility
- Colour Coding: Red text highlights major standards (e.g., ISO45001, AS/NZS4801), aiding quick identification of pivotal developments.
- Bold Text: Used to emphasise key publications and turning points.
- Arrows: Indicate chronological progression and relationships between standards, helping users trace the evolution of concepts over time.
Figure 4. The organisation as an open system – Long description
This diagram illustrates how a Person Conducting a Business or Undertaking (PCBU) functions as an open system. It represents how internal and external factors interact to transform inputs into outputs, with feedback mechanisms that support ongoing improvement and systemic integrity.
External Context of the PCBU
Shown at the top of the diagram, representing external influences that affect how the PCBU operates.
Internal System Components
- Tasks to be done transforming inputs into outputs: Human characteristics, skills, experience, individual and team performance.
- Procurement and purchasing:
- Raw materials
- Transport systems
- Telecoms
- Energy
- Plant structures and machine suppliers
- Cleaning, maintenance, security, etc.
- Other dependencies the PCBU relies on
- Human resource management: Hiring, training, development, promotion, payroll systems.
- Reliability of PCBU’s infrastructure: Buildings, IT systems, website, intranet, e-commerce platforms, patents, supply chains, legacy systems.
Inputs to the System
- Earlier processes or activities: Inputs from external or internal providers, such as customers or stakeholders.
- Capital: Financial investment flowing into the system.
Outputs
Shown as a labelled arrow leaving the right side of the system, representing the results of internal processes.
Internal Feedback Loops
An arrow loops from the outputs back into the central system, reflecting performance feedback used to refine processes.
Return on Investment
Located at the bottom, this line links outputs to financial outcomes for owners and shareholders.
Internal Context of the PCBU
A label along the base, indicating the PCBU’s internal capacities, structures, and operational environment.
Figure 7: Top of the MORT Chart – Long desription
This diagram presents the upper section of the Management Oversight and Risk Tree (MORT) chart, which is used to analyse the causes of accidents and losses within an organisation. It shows two root causes of losses: oversights/omissions and assumed risks.
Main Structure
- Damage to people or assets: Leads to a box labelled Losses.
- Future undesired events: A dashed arrow links this box to the Losses box, indicating potential for recurrence.
Pathways to Losses
The Losses box splits into two branches using an OR gate:
- Oversights & omissions (labelled S/M)
- Connects to an AND gate that leads to:
- Specific control factors LTA (label S) — value: 1
- Management system factors LTA (label M) — value: 37
- Connects to an AND gate that leads to:
- Assumed risks (labelled R) — value: 56
- Branches into individual risks:
- R1, R2, R3, R4, …, Rn
- Branches into individual risks:
Note: Refer to the full MORT chart for details.
Interpretation
The chart suggests that loss events arise either from failures in oversight and control systems or from risks that were knowingly accepted. These categories are traced through specific (S), management (M), and risk (R) factor branches in the full MORT structure.
