21 An A to Z of techniques for professionals
This chapter sets out a range of techniques that practitioners and professionals may find useful. Some are suggested in earlier chapters but because they can be used in different stages of the management process, including setting up a management system, they have been grouped here. But the first entry is about writing skills, because your work can be the work of a great OHS professional but of no use if it is not well communicated.
21.1 Writing skills for OHS professionals
Writing about a problem, proposed or planned intervention or how something works helps clarify our thinking and narrow down the options and discover other ideas.
Editing your work
This guidance on writing skills was proof-read by the author, run through the MS Word Editor and then checked by a professional editor who suggested changes. Ask a family member, friend, or colleague to review your writing and then tell you what they understand by it; this will help you know where and how to improve your work.
Key points
- Break the assignment question into chunks and turn each into short headings that will act as signposts for a reader; this will help make sure you answer the question.
- Ask a friend, family member or colleague to read a late draft of your work; can they tell you what you were writing about, and did they find any faults?
- Does your assignment answer the question?
Who are your readers?
Writing university assignments means your readers will be academic members of staff but whatever you write, focus on who the readers will be. The guidance here will help for most of your writing.
General comments
Keep each sentence no longer than a couple of lines – more than that and a reader may get lost in your verbosity (ie, waffle).
Use headings to show a change of topic. Develop a consistent set of headings to indicate subsections and sub-subsections.
In the body of an assignment use a consistent 11-point font (eg, Arial, Calibri, Times New Roman).
Make sure that each page shows the page number.
Avoid identifying by name any case study organisations or people you have spoken to unless you have their written consent. If in doubt, ask the paper coordinator for guidance.
Plain English
Orwell (2002, originally published in 1946) proposed these six rules for good writing:
“i) Never use a metaphor, simile, or other figure of speech which you are used to seeing in print.
(ii) Never use a long word where a short one will do.
(iii) If it is possible to cut a word out, always cut it out.
(iv) Never use the passive where you can use the active.
(v) Never use a foreign phrase, a scientific word, or a jargon word if you can think of an everyday English equivalent.
(vi) Break any of these rules sooner than say anything outright barbarous”.
The first five amount to: use short, everyday words and the active voice, and cut out unneeded words. The sixth shows how difficult it is to write good plain English.
Using complex or technical words might only prove you know how to copy from a source or use a thesaurus (Oppenheimer, 2006), so please use plain English words. Using long words needlessly may show you do not understand what you are writing about whereas being able to interpret complex words or subjects shows you understand them in the context of your writing.
A reader should be able to read your writing quickly and decide whether to accept your arguments or (especially for non-academic writing) ask for more information. They will appreciate your efforts to use short (or at least common) words and write “punchy” sentences.

Beware inadvertently writing something like “If the baby does not thrive on raw milk boil it” or “There will be a meeting at desktop level on bicycles” (these are not made up!).
To use a long word here, don’t write anything ambiguous. The sign to the right was on a ski field car park.
Grammar and punctuation
If you are using MS Word, always use the Editor function to check your spelling, grammar, and punctuation. A well-written report that gives the required information in a way that is quickly understood by a reader can make you more influential. The opposite can also be true!
Template for an assignment of more than 500 words
The following is suitable for assignments with a word limit greater than 500 words plus references (eg, an academic essay, report, journal article). It is adapted from the Heading Level Template: Professional Paper (American Psychological Association, 2022), and Guide for Authors (Safety Science, 2022).
Cover sheet
Please include the title, your name, student ID number, any acknowledgements, and your email address.
Title page
The title of your assignment is at the top of the first page of text.
Abstract
For most assignments it will be sufficient to start your assignment by outlining very briefly what you have written. This will help the reader to quickly focus on what follows.
Keywords
Three or four key words will be helpful in a 2000-word or longer assignment.
Introduction
For a long assignment, briefly describe why you chose that topic.
State the objectives of the assignment, avoiding a detailed literature survey or summary of your results or conclusions.
Try to avoid footnotes. If they must be used your word processor should enable their consecutive numbering.
Material and/or methods
Provide sufficient information to allow someone else to follow up on your work. if you are basing your work on the earlier work of others always cite your sources.
If your work is based on a national or international standard, cite it and, if necessary, include any clause or page numbers of importance. If you used a particular management technique, name it and cite a source.
As a rough guide, longer assignments should be supported by at least 5-6 peer-reviewed academic sources or reliable grey literature (Peace, in print) plus any internal documents you rely on.
Tables
- Do not use short or small tables if the content could be included in the body of your assignment.
- Sometimes a table can help compare-and-contrast your findings.
- Caption and number each table using the word processor function.
Graphics
“One look is worth a thousand words”[1](Barnard, 1921). A well-drawn graphic may help with your word count, but it may be a distraction If it does not quickly make clear how a process is intended to work or has been found to work.
- Caption and number each graphic using the word processor function.
- GIF, BMP, PICT, or WPG graphics have low resolution and should not be used.
Results
Give a clear and concise description of what you found.
Discussion and conclusions
Briefly discuss the significance of your work. The main conclusions of importance should be discussed, perhaps in relation to a case study organisation, sector or generally. The discussion and conclusions could form part of the results.
Referencing
Use APA 7th for reference formatting intext citations and the bibliography and, where available, the DOI for articles.
Make sure the intext citations are in the right place; if you need to reference another person’s work the intext citations follow their words, not the sentence.
Downloading import files from the library and use of Endnote, Zotero, Mendeley or another bibliography application will make such formatting simpler.
To quote or not to quote?
When writing an assignment or research report you may find a reference that expresses a concept clearly and want to quote it. Beware of using too many quotations!
Use a few short quotations that add to your argument but (unless you are trying to explain the law) try to paraphrase a source into your own words. Learning how to quote an interviewee takes time but trying to limit to 10-15 words will be acceptable.
Turnitin scans all assignments, research reports, theses and dissertations, searching for similarities with other work, and provides reports. Work that contains 5-10% similarity is usually acceptable, but 40-50% is almost certainly unacceptable and will be rejected. Worse, it might be reported for plagiarism.
Special case – slideshows
The KISS principle applies to creating slideshows. Keep It Simple Silly. Use a few words on each slide that pick out your key points. If you include pictures or charts use them, otherwise delete them.
Special case – management reports
If you have never had to write a management report your first attempts may be embarrassing – worse, they might be rejected. Ask for the management report template used by your organisation and some examples of reports that have been well-received so you can see what management (including the board) usually wants to see. Such a style or layout will be acceptable for an assignment.
If you don’t have access to a template or examples, the following outline can be used.
- To: [management team]
- From [your job title]
- Subject [what you are writing about]
- Date [when you submitted the report]
- Set out or remind the management team about your terms of reference.
- Briefly describe how you carried out this work.
- List your key findings and any actions arising; alternatively present these in a table.
- You may need to suggest how urgent the action points are, but sometimes it may be enough to ask the management team to “note this report”.
Special case – consultancy reports
Generally, a consultancy report will contain:
- Executive summary
- Introduction
- Background and method
- Results or findings
- Recommendations based on your findings
- References
- Appendices
Reference style for management and consultancy reports
Some organisations dislike having the flow of a report interrupted by in-text citations. This can be partly overcome by using numbered citations. This is made easy if you are using Endnote or some other bibliographic software. There are very good reasons to always cite your sources. It shows that you have drawn on the work of others and respect their intellectual property and, if you make an honest mistake, it can help defend your reputation (professional indemnity insurers quite like this).
Structuring a longer assignment
The table below sets out a commonly used structure of longer academic assignments, including research reports, theses, and dissertations. Check with your lecturer if it is appropriate for you to use or adapt it for your assignments or use authoritative guidance (Evans, David et al., 2014; Ormrod, 2022; Saunders et al., 2019, pp. 730-739).
Table 36. Outline of a longer academic assignment
| Number of words written | How complete (%) | |
| Title | ||
| Abstract: Contains enough words describing your work that invite a reader to keep reading; in a 2,000-word assignment 50 words might be enough but in a 20,000-word research report you should aim for 250-300 words. This is usually the last part of the assignment that you write | ||
| Introduction: Why I was interested in investigating this. The problem and outline of how I responded | ||
| Literature review: The range of academic and reliable grey literature I read that influenced my thinking. Relevant key theories, concepts, and ideas | ||
| Methodology: My research question. What I did to find new information or a new way of thinking about existing information | ||
| Results: What I found | ||
| Discussion: What I think about what I read and what I found | ||
| Conclusions: Where this might go, further research, importance for others | ||
| References: By default use APA 7th | ||
| Total number of words | ||
| Word limit |
Special case – writing an article
You may be asked to write an article about some aspect of your work. Always check what the publisher or commissioning editor will expect. The New Zealand Journal of Health and Safety Practice welcomes good articles about health and safety practice and sometimes publishes work written by students. See an article about such writing by Peace (2024b).
Special case – expert witness reports
At some stage in your career, you may need to write an expert witness report, and then attend the Court to present your report and be cross-examined.
Take instructions from the lawyer who wishes to use your services. What layout and format of your report do they require or prefer?
Note that referencing in court documents uses footnoting as shown in the next paragraphs.
The High Court Rules[2]set out the Code of Conduct for expert witnesses, starting with the requirement that: “1. An expert witness has an overriding duty to assist the court impartially on relevant matters within the expert’s area of expertise” and “2. An expert witness is not an advocate for the party who engages the witness”. An article by Scognamiglio[3] shows how corrupt behaviour can breach the High Court Rules.
The Evidence Act[4] defines an expert as “a person who has specialised knowledge or skill based on training, study, or experience” and expert evidence as “the evidence of an expert based on the specialised knowledge or skill of that expert and includes evidence given in the form of an opinion”.
References
American Psychological Association. (2022). Heading Level Template: Professional Paper. Author, https://apastyle.apa.org/search?query=Heading+Level+Template%3A+Professional+Paper
Barnard, F. (1921). One look is worth a thousand words. Printer’s Ink. https://www.phrases.org.uk/meanings/a-picture-is-worth-a-thousand-words.html
Evans, D., Gruba, P., & Zobel, J. (2014). How to Write a Better Thesis (3rd ed.). Springer International Publishing. 10.1007/978-3-319-04286-2
Oppenheimer, D. M. (2006). Consequences of erudite vernacular utilized irrespective of necessity: problems with using long words needlessly. Applied Cognitive Psychology, 20(2), 139-156. https://doi.org/10.1002/acp.1178
Ormrod, R. P. (2022). How to Structure a Thesis, Report or Paper: A Guide for Students. Routledge.
Orwell, G. (2002). Politics and the English Language. Literary cavalcade, 54(5), 20.
Peace, C. (2024b). Writing academic articles of interest to practitioners. New Zealand Journal of Health and Safety Practice, 1(2). https://doi.org/10.26686/nzjhsp.v1i3.9616
Peace, C. (in print). Finding and using reliable “grey literature”. New Zealand Journal of Employment Relations.
Safety Science. (2022). Guide for Authors. Elsevier, https://www.elsevier.com/journals/safety-science/0925-7535/guide-for-authors
Saunders, M., Lewis, P., & Thornhill, A. (2019). Research Methods for Business Students (8th ed.). Pearson.
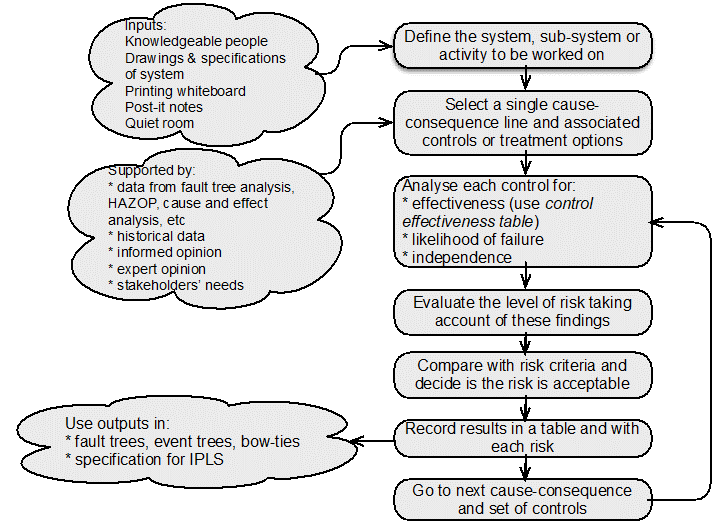
21.2 Useful management techniques
Assessment and management of uncertainty and its effects using a systematic and structured approach is more likely to give effective results than simple professional judgement or guessing. The following graphic suggests where in the ISO31000 risk management process different techniques might be used.
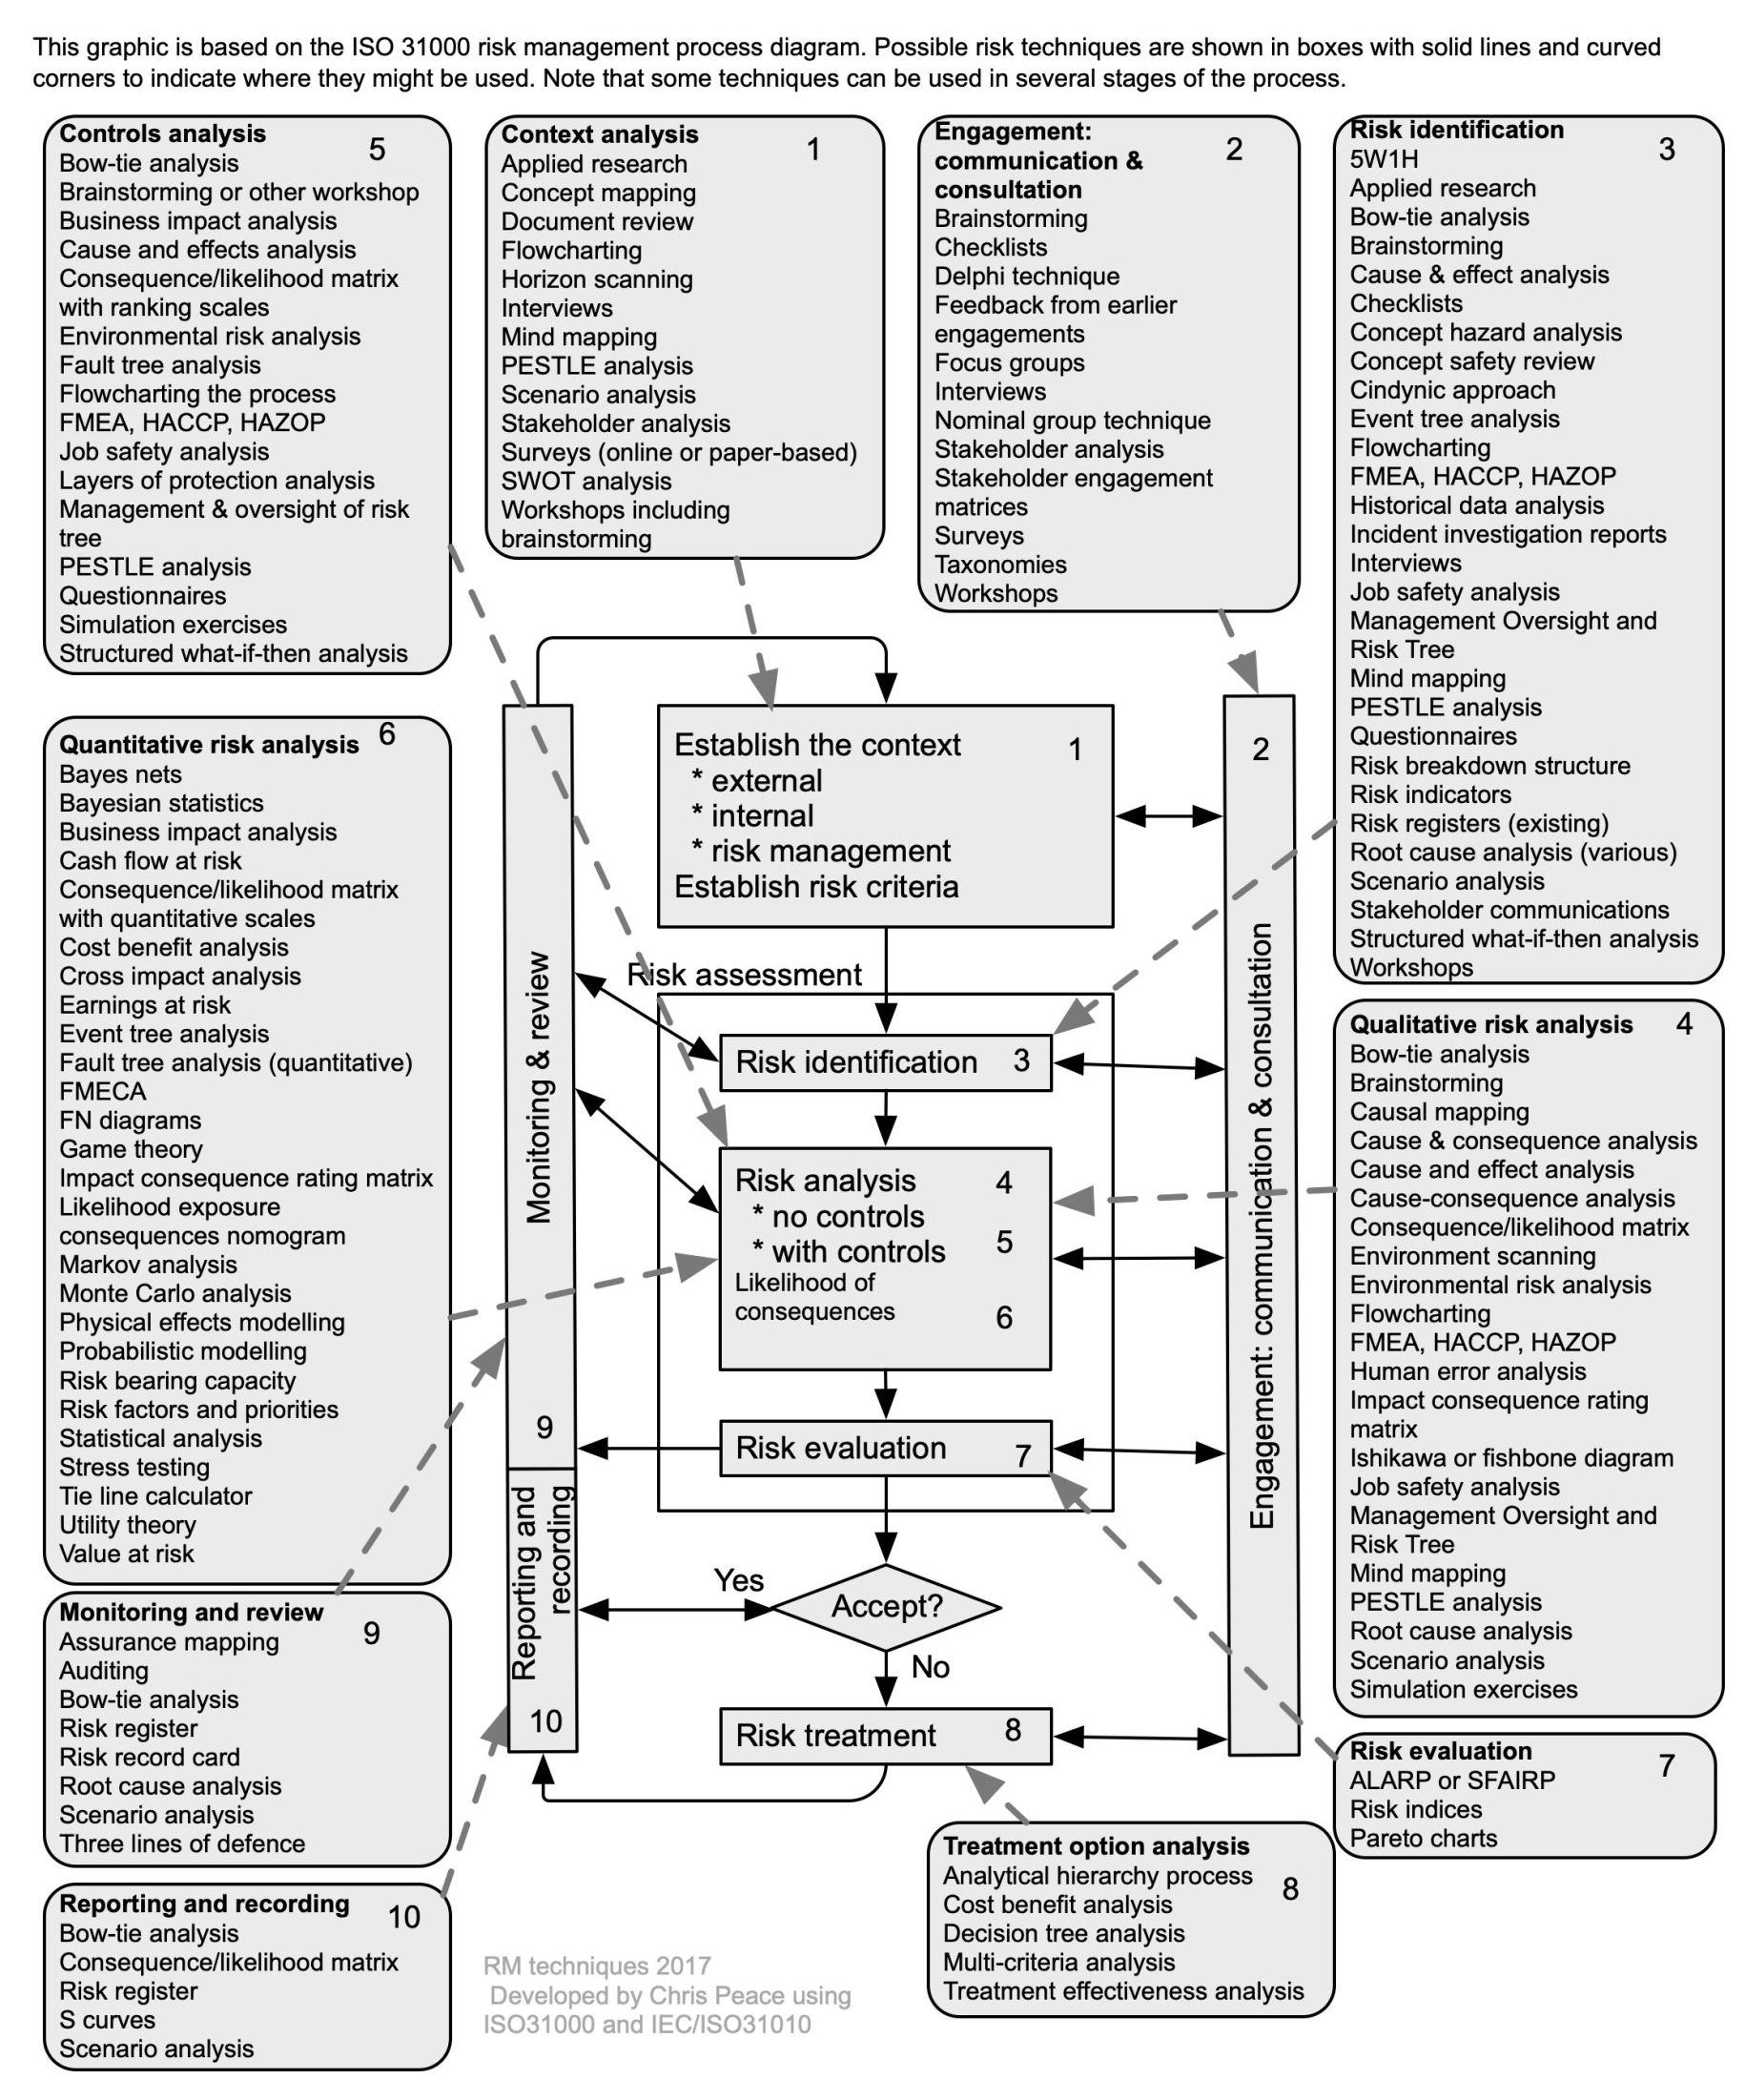
Source: Adapted from Peace (2017a)
21.3 Selected management techniques
A hardback textbook “Creative problem solving for managers” (Proctor, 2009) is very useful and a source for many of the following outlines. The book is also available online through the university library (Proctor, 2019).
Bain & Company, a management consultancy (https://www.bain.com/insights/topics/management-tools-and-trends/) publishes an occasional report “Management Tools” that briefly outlines a wide range of management tools, most of which are not outlined in this section.
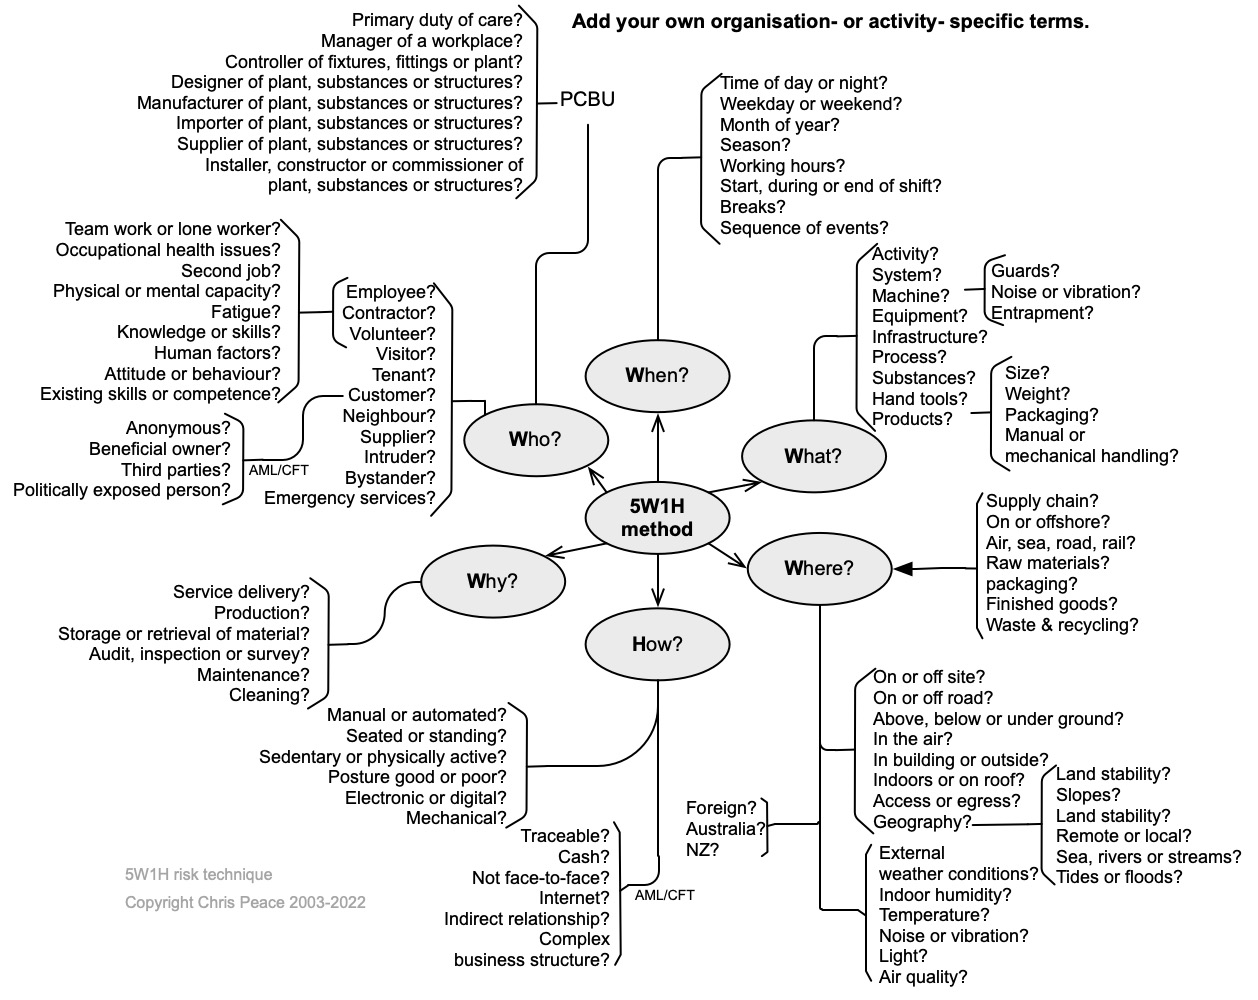
21.3.1 5W1H
- What are the objectives of the organisation, activity, system, or item
- What questions might need to be asked to learn more about the nature and level of uncertainty that could affect achievement of those objectives?
5W1H is an acronym for What, When, Where, Who, Why, and How. Simply asking questions using it will help identify risk sources, causes, events, and consequences giving rise to uncertainty (the unknowns) in a structured manner. Words can be linked: for example, Who and Where might give you “driver offsite”. The following mind map suggests how you might use 5W1H to start identifying risks. The same approach can be used when analysing risks or identifying treatment options.
21.3.2 Assurance mapping
- What are the objectives of the activity, system, subsystem, unit, or part?
- What is the nature and level of uncertainty that could affect achievement of those objectives?
- Cross reference to section 9.2, internal audit, in management system standards.
Assurance mapping helps identify control gaps and excessive levels of control, and supports assurance to stakeholders that risks are effectively managed (Anon, 2011; Turnbull, 2011). It can be used in conjunction with other techniques including bow tie analysis, consequence-likelihood matrix, controls effectiveness table, failure modes and effectiveness analysis, and layers of protection analysis.
In Table 37, Risk A is highly controlled. If the level of risk was low with no controls in place it might be questionable whether all five controls were needed. However, Risk D is only modified by Control 1 and that control has a 20% effectiveness rating. If the level of risk with no controls was “high” or “extreme” such a low level of control would be of concern and the risk treated by either improving Control 1 or identifying and implementing additional controls.
Questions should be asked about each risk control 1 is linked to. Alternatively, controls 2 and 5 both have ratings of 95% and it might be possible to reduce the level of control for some of these risks.
Table 37. Example of an assurance map
| Control | Effectiveness rating | Risk A | Risk B | Risk C | Risk D | Risk n |
| Control 1 | 20% | 1 | 1 | 1 | etc | |
| Control 2 | 95% | 1 | 1 | |||
| Control 3 | 45% | 1 | 1 | |||
| Control 4 | 75% | 1 | ||||
| Control 5 | 95% | 1 | 1 | |||
| Control n |
Warning!
Rather than rely on a single control it may be necessary to over-control a risk. Some controls may fail completely, or their “ineffectiveness” may allow a risk to eventuate (remember the Swiss Cheese model).
Uses and benefits of assurance mapping
The assurance map example in Table 37 is quite basic. It can be made more elaborate to include business areas, assurance providers and colour-coded heat maps of the control environment. Assurance mapping is used to:
- aid planning internal audits by internal auditors and inspection bodies and so avoid duplicated effort
- identify control gaps and excessive control effort
- provide evidence to external auditors who may provide an independent controls or governance report to the board.
Apart from traditional internal audits, organisation now conduct audits for a wide range of purposes including occupational safety and health, public safety, quality, environmental, and security management systems. These often overlap and use of assurance mapping helps allocate resources appropriately. It may also lead to training of relevant staff who are not auditors in audit methodology and practice.
21.3.3 Bowtie analysis
- What are the objectives of the organisation, activity, system, or item?
- What is the nature and level of uncertainty that could affect achievement of those objectives?
- Cross-reference to clause 6.1 and 8.1 in ISO45001 and some other standards.
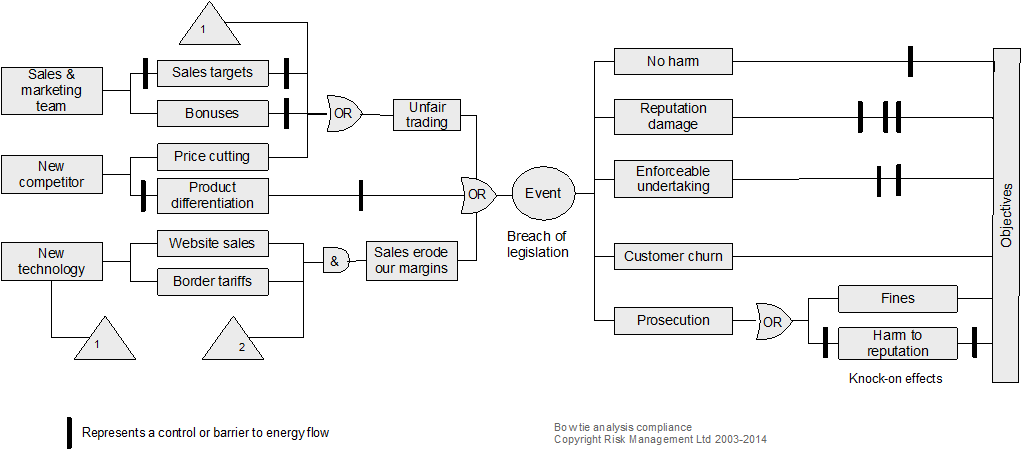
Description
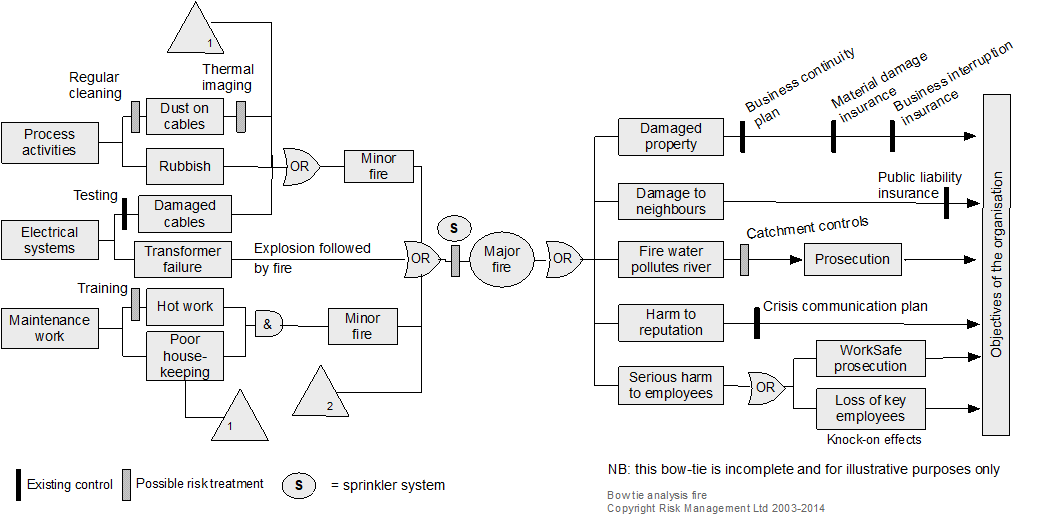
Bowtie diagrams show the relationship between risk sources, initiating events, events, controls, consequences and impacts on objectives, to convey information about controls for prevention, detection, halting or recovering from an event (IEC/ISO31010, 2019; Trbojevic, 2008). A bowtie shows how causes flow to an event and from the event to consequences and so helps show the nature of uncertainty and some of the effects on objectives.
Resources and capability
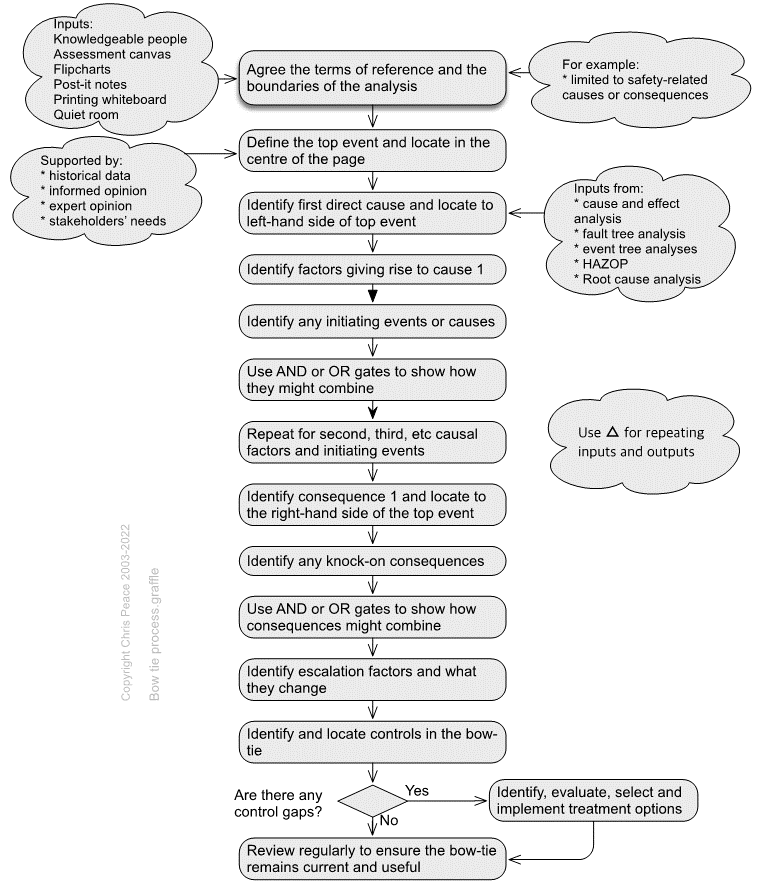
Two examples of bowties are shown below. They are read from left to right and, in each, the triangles with the number 1 in their bottom left corners represent outputs. When in their bottom right corners, they represent an input. In each bowtie, there are inputs numbered 2 that are from elsewhere. In a large bowtie analysis, there may be several or many such outputs and inputs on both the causal (left) side and consequence (right) side. Using inputs and outputs in this way can save much repetition and many confusing crossovers of connector lines.
21.3.4 Brainstorming
Description
Brainstorming is a group-based workshop technique for getting wider, bigger and better ideas; thinking “outside the square”; and engaging with all participants to generate a free flow of ideas (Proctor, 2019, pp. 128-144; Sutton & Hargadon, 1996).
Brainstorming is applicable to risk identification and developing risk treatment options. It can be made more structured by using PESTLE, SWOT or SWIFT analysis or process mapping. The effectiveness of a risk breakdown structure (section 21.3.33) can also be improved by brainstorming.
Resources and capability
The rules for brainstorming are to:
- let ideas flow freely and creatively
- think of new ways
- break old patterns
- build on the ideas of others
- keep discussion moving.
The process is to:
- introduce brainstorming and the rules
- use a whiteboard or flipchart to park ideas for subsequent discussion, elaboration, and evaluation
- take a break when ideas seem to have dried up
- resume if there are fresh ideas
- combine similar ideas
- discuss, elaborate on, and evaluate the ideas.
21.3.5 Consequence analysis
- What are the objectives of the organisation, activity, system, or item?
- What is the nature and level of uncertainty that could affect achievement of those objectives?
- Cross-reference to clauses 6.1 and 8.1 in ISO45001 and some other standards.
In the absence of fully researched probable consequences, the following estimates might be used.
Table 38. Indicative consequences
| Consequences → | Insignificant | Minor | Moderate | Major | Catastrophic |
|---|---|---|---|---|---|
| Safety of staff or third parties
Human lives and wellbeing (employees, contractors or third parties) |
Minor first aid or no medical treatment required | Reversible disability possibly requiring hospitalisation | Moderate irreversible disability (<30%) to one or more people | Single fatality and/or severe irreversible effects (>30%) to one or more people | Multiple fatalities, or significant irreversible effects to >50 people |
| Reputational impact
Community, government (national and local), NGOs, media, or stakeholder interest & confidence |
Negligible adverse local public or media attention or a few complaints | Minor adverse local public or media attention or a several complaints | Adverse public or media attention or many complaints | Continued public or media attention and numerous complaints or questions in Parliament | Adverse international media attention and many complaints or daily questions in Parliament |
| Financial impact
Dollar value in terms of assets, capital value, brand value, profitability, lost opportunity costs, increased costs & reduced income, fines & penalties, contractual penalties |
Less than $5,000 | Between $5,000 and $50,000 | Between $50,000 & $500,000 | Between $500,000 & $5 million | More than $5 million |
| Operational impact
Output achievement (quality, quantity, timeliness), programme or project management, workload management, policy compliance, information sharing, collaboration infrastructure support, strategy development |
No measurable operational impact on the organisation | Significant degradation of operations or service delivery
Local management intervention required, with locally available resources |
Serious degradation of operations or service delivery
Substantial management intervention required, may need some external assistance |
Major degradation of operations or service delivery
Significant senior management intervention required with mobilisation of resources including external assistance |
Widespread & total degradation of operations or service delivery
Significant long-term doubt about sustainability of the organisation Immediate senior executive intervention required |
| Legislative compliance and contracts | Negligible non-compliances or breaches of regulation | Minor legal issues, non-compliances, or breaches of regulation | Moderate breach
Moderate fine possible |
Major breach of regulation
Major litigation Major fine |
Significant prosecution and fines
Very serious litigation including class actions |
22.3.6 Controls effectiveness rating
Controls should be assessed for their effectiveness in maintaining or modifying a risk. Use the following table to help determine the effectiveness of current controls. The suggested control effectiveness rating is generic and must be revised for a specific organisation or framework.
Table 39. Risk control effectiveness
| Descriptor | Control or treatment effectiveness rating | Description of effectiveness of a risk control already in use OR a treatment that could be applied |
| Most satisfactory | ≤95% | Controls are well designed for the risk, address the root causes and management believes that they are always effective and reliable. Nothing more to be done except review and monitor the existing controls |
|---|---|---|
| Satisfactory | 75-90% | Most controls are designed correctly and are in place and effective. Some more work to be done to improve operating effectiveness, or management has doubts about operational effectiveness and reliability |
| Reservations | 45-75% | While the design of controls may be largely correct in that they address most of the root causes of the risk, they are not currently very effective
OR Some of the controls do not seem correctly designed in that they do not address root causes; those that are correctly designed are operating effectively |
| Poor | 25-45% | Significant control gaps. Either controls do not address root causes, or they do not operate at all effectively |
| Uncontrolled | ≤25% | Virtually no credible control. Management has no confidence that any degree of control is being achieved, due to poor control design and/or very limited operational effectiveness |
Note: Most operational controls will rarely be better than 95% effective and why the “On Time, In Full 95% of the time (OTIF 95) concept is so useful (see section 13.3 on objectives). If a key control is claimed to be above 95% it should be independently audited and then regularly monitored to ensure it remains at that level.
21.3.7 Control self-assessment (CSA)
Definition
CSA was defined by Graves & Marsh (2001) as “any activity where the people responsible for a business area, task or objective, using some demonstrable approach, analyse the status of control and risk to provide additional assurance related to the achievement of one or more business objectives”.
The common characteristics of a typical CSA consist of identification of (McCuaig, 1998; McDermott & Davies, 2008; Tritter et al., 1996):
- business objectives, which can be defined either in terms of business targets or process delivery goals
- risks that could threaten the achievement of those objectives and the activities and processes affected by the different risks identified
- controls in place intended to prevent the risks from eventuating
- responsibility for performing those controls.
The effectiveness of the controls in place and the level of residual risk remaining after control are then assessed.
Either the whole of a process or business activity should be subject to CSA, or a standard operating procedure that operates in two or more locations may be assessed.
Control self-assessment process
CSA is a specific form of workshop that may be spread over a whole day or longer and involve the whole of a team or representatives of a team (including their management).
A common approach to CSA is as follows.
Engagement with management
The CSA process and objectives are communicated to management, emphasising it is a specific form of audit.
Planning
The planning stage identifies who will form the team and where and when the workshop will be held.
Workshop
At the start of the workshop the audit team briefly describes how the workshop will be run. Employees are then encouraged to frankly discuss how well the team works, any obstacles to achievement of the business objectives or improvement of the process, and control strengths and weaknesses. They rate the current effectiveness of the business process on a scale of 1-7 and the effectiveness of each control.
Results reporting
The workshop findings are written up and circulated to workshop participants within seven days and feedback on the factual accuracy of the report encouraged.
The finalised report is then submitted to management for discussion in the next management team meeting and responses to the team.
There are essentially three key approaches to performing an CSA, namely workshop, questionnaire, or hybrid. However, there is no ‘right’ or ‘wrong’ way to implementing CSA. Each firm should select whichever approach, or combination of approaches, best suits its governance, culture, operating environment, size, complexity, structure, and geographical dispersion. The respective sections below set out the key advantages of each approach.
However, experience shows that any approach can be successfully implemented in any type or size of firm, if there is sufficient commitment to the concept of RCSA from the top down (executive and senior management level), as well as across the lower levels of the firm.
21.3.8 Cost benefit analysis
- What are the objectives of the organisation, activity, system, or item?
- What is the nature and level of uncertainty that could affect achievement of those objectives?
- Cross-reference to clauses 4.2, 6.1, 7.1 and 10 in management system standards.
A UK supermarket chain had suffered many small to moderate fires in shops. Then one large fire destroyed one of their six distribution centres, costing about NZ$100 million at current values; insurers refused renewal of cover. The supermarket company spent about NZ$10 million on fire isolation and suppression systems and insurers rebated about NZ$12.5 million within 12 months.
While this return on investment was unexpectedly large and, probably, rare the absence of insurance would have resulted in a significant drop in share price, probably leading to a takeover bid from a competitor.
Cost benefit analysis (CBA) seeks to present an analysis of the costs and benefits of potential courses of action using their financial value or monetary worth to a large group of people or society (New Zealand Treasury, 2015). It can be quantitative, semi-quantitative or qualitative. CBA calculates the value of a decision based on the net expected value in monetary terms less the net expected costs, also expressed monetarily.
CBA can be used as part of risk evaluation to help decide if the current level of a risk with both negative and positive consequences is tolerable or acceptable. In cases where a risk is not tolerable or is unacceptable and must be treated, CBA can be used to help choose between treatment options.
Example
A UK supermarket chain had suffered many small to moderate fires in shops. Then one large fire destroyed one of their six distribution centres, costing about NZ$100 million at current values; insurers refused renewal of cover. The supermarket company spent about NZ$10 million on fire isolation and suppression systems and insurers rebated about NZ$12.5 million within 12 months.
While this return on investment was unexpectedly large and, probably, rare the absence of insurance would have resulted in a significant drop in share price, probably leading to a takeover bid from a competitor.
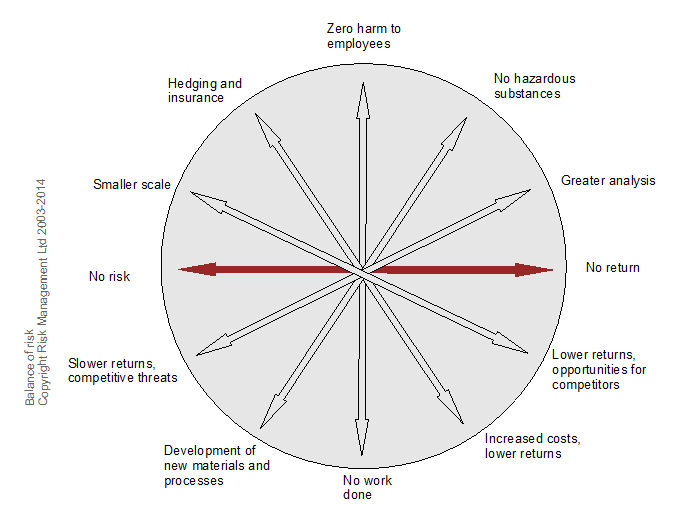
CBA often will show matching pairs of approaches to risk and their consequences. In Figure 65 for example:
- buying insurance results in smoothing losses in the long term but increased costs and lower returns in the short term
- zero harm to employees implies no work being done
- no risk results in no returns.
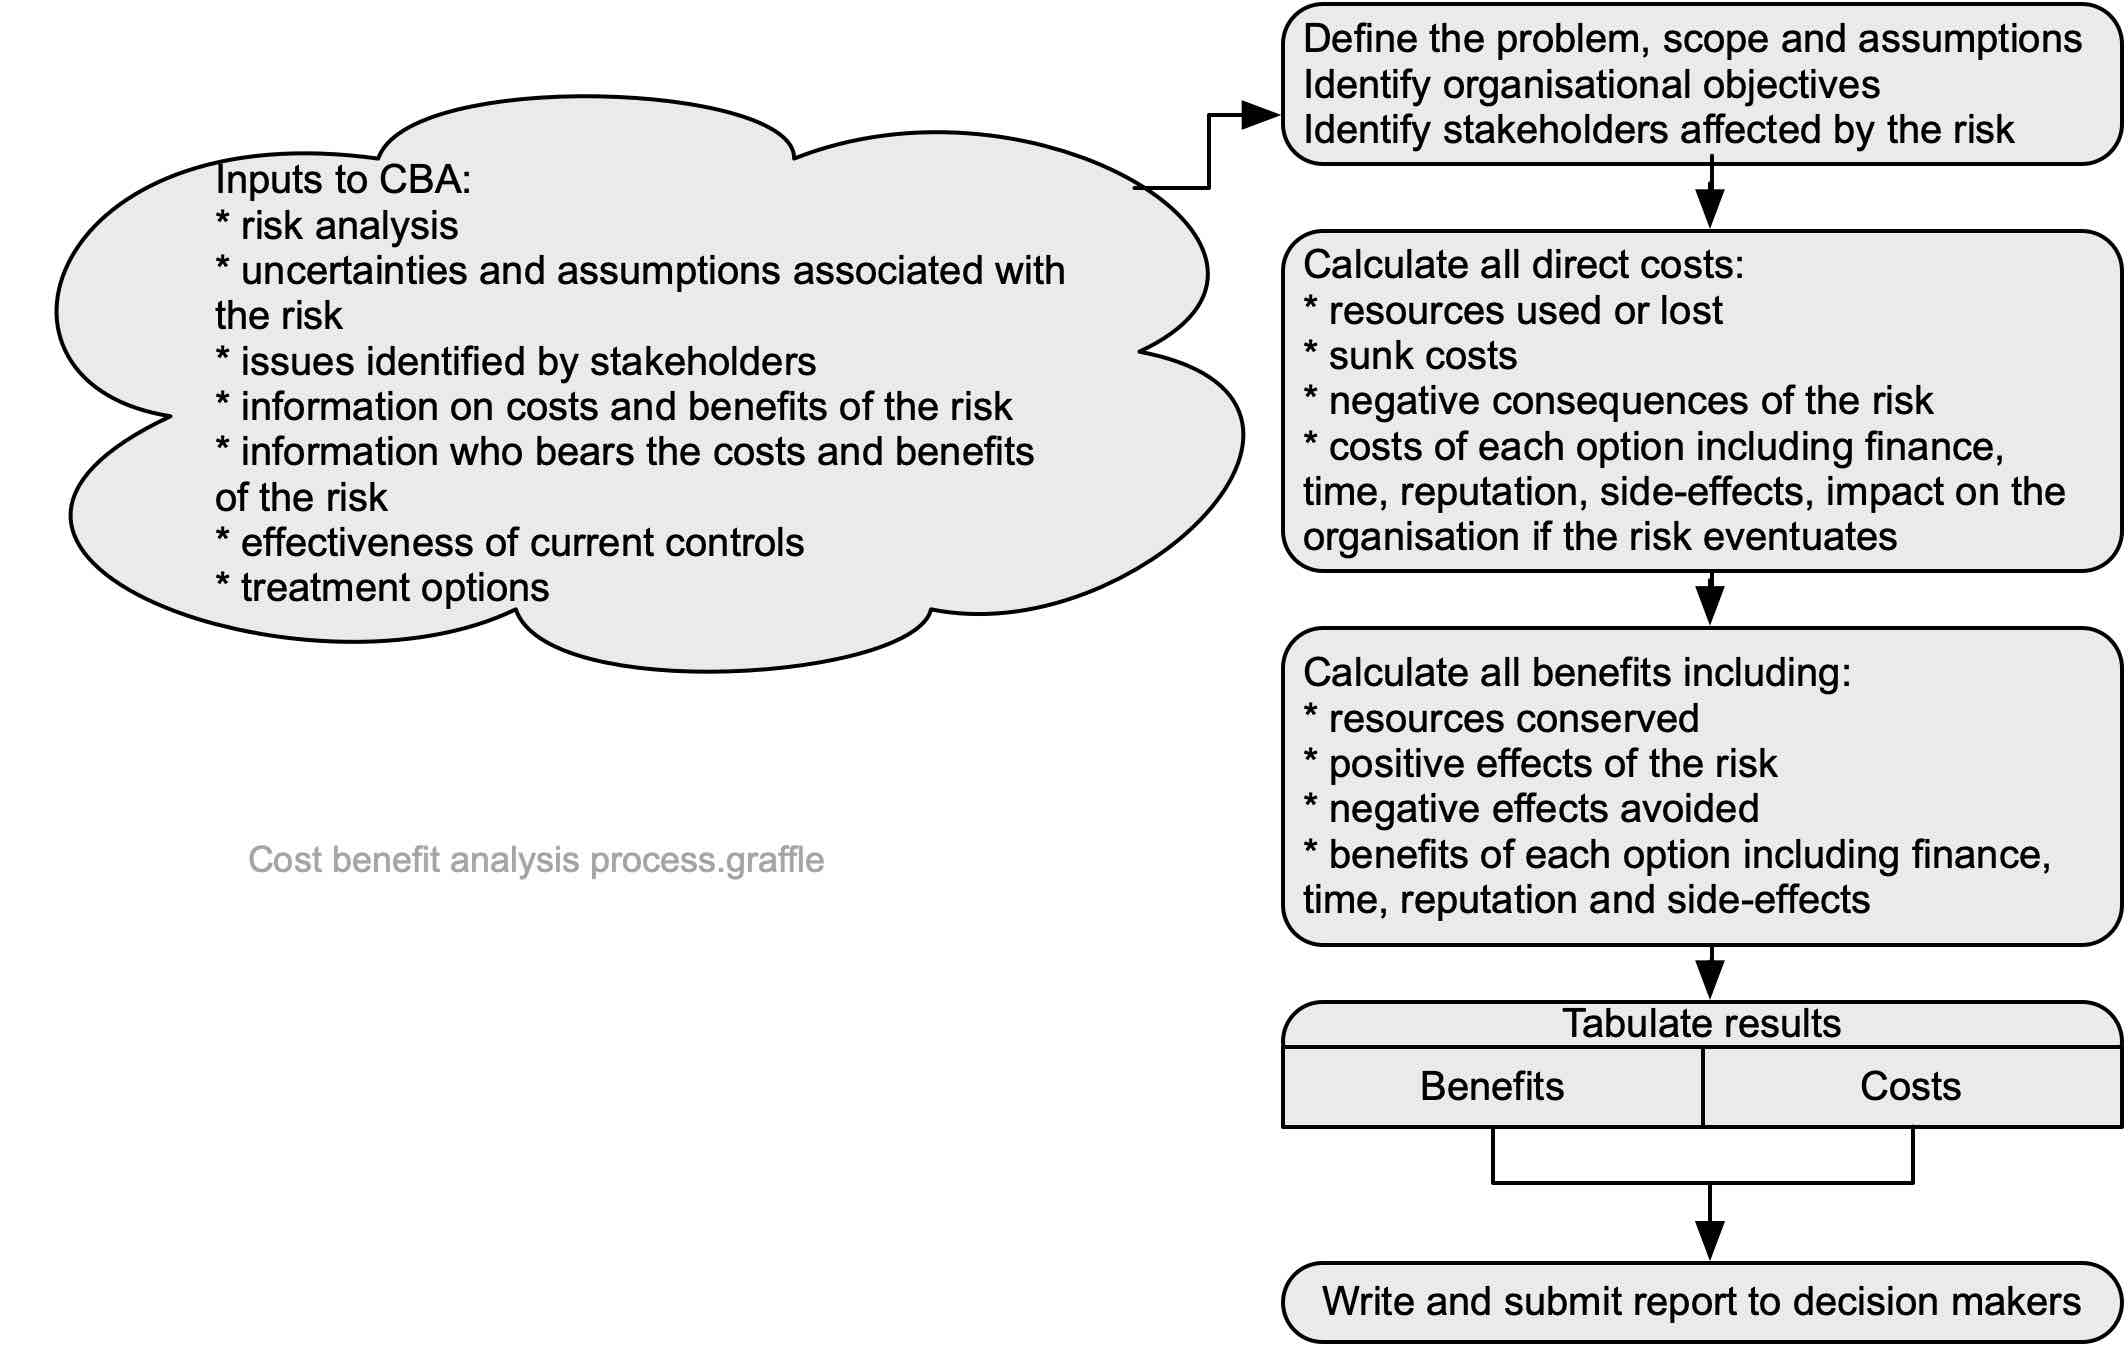
Simplified process for cost benefit analysis
The process set out in Figure 66 is very simplified but sets out most of the key issues for cost benefit analysis (CBA).
Nature and degree of uncertainty
CBA often uses discount rates to equate some future risk consequences (whether positive or negative) with current values. The difficulty with this approach is that rates may be directly or indirectly affected by intangible factors and change unexpectedly.
Often, a project may be promoted by a person or group using CBA input data that is highly uncertain but represented as correct, either historically or prospectively. However, the larger a project in costs or delivery times, associated risks, or risk treatments, the more likely it is to suffer from:
- cost overrun, or
- under-delivery of planned benefits, or
- time delays, or
- unexpected/unintended consequences, or
- all the above.
Alternative approaches
Multi-criteria analysis is preferred by some people because it clarifies the criteria for selecting options.
21.3.9 Engagement, communication, and consultation process
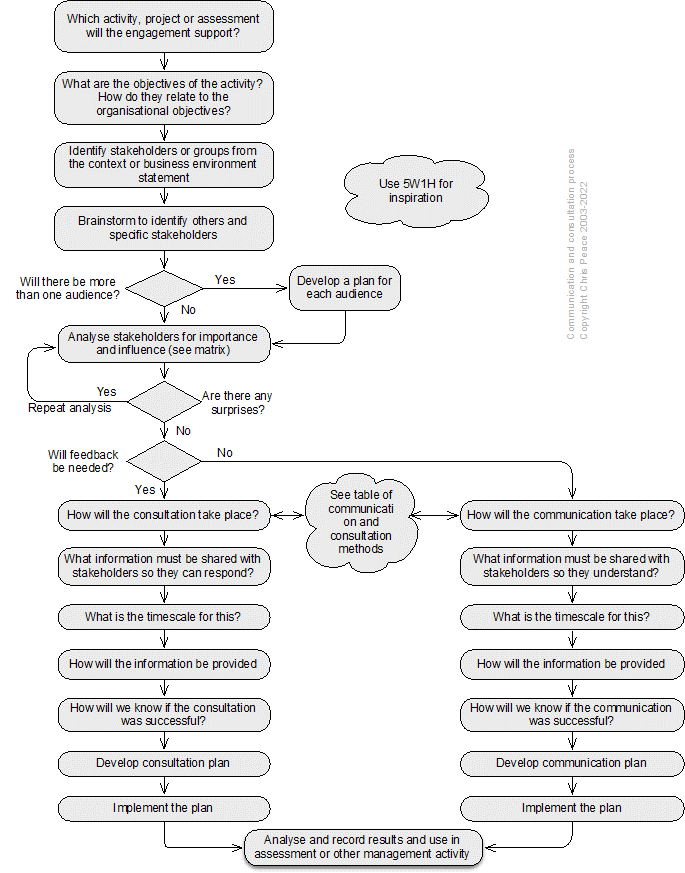
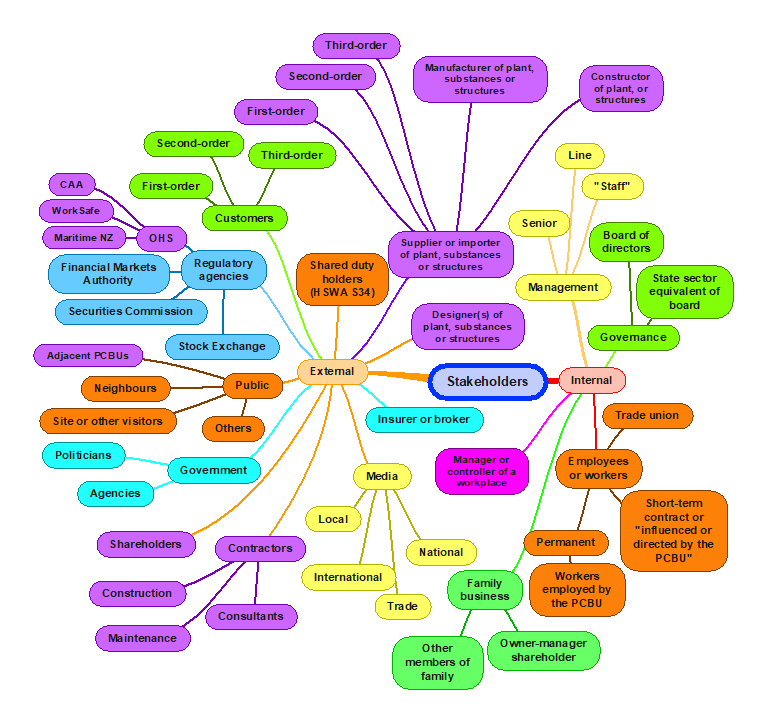
Effective communication with and consultation of stakeholders is critical for management of uncertainty and its effects on objectives. A generic stakeholder communication and consultation plan can be developed using the process set out below.
Generic stakeholders
The following mind map suggests some generic stakeholders. Those especially relevant to occupational health and safety are in purple. You should develop your own mind map or generic list that is specific to your organisation to help ensure none are overlooked and their needs understood (Hansson, 2018).
Stakeholder identification charts – organisation charts
Review organisation charts to identify internal stakeholders. Such charts may form part of documented information developed under clause 7.5 of a management system standard.
Records and further analysis
The following table can be expanded to cover as many stakeholders as necessary.
Table 40. Stakeholder analysis template
| Name of Stakeholder | Rating A, B, C or D | Outline communication and consultation plan |
Table 41. Stakeholder influence and importance analysis matrix
| Importance of stakeholder → | |||||
|---|---|---|---|---|---|
| Unknown | Little or no importance | Some importance | Significant importance | ||
| ↑
Influence of stakeholder
|
Significant influence | C. These are stakeholders with high influence, who can therefore affect outcomes, but whose interests are not necessarily aligned with overall organisation objectives. This implies these stakeholders may be a source of significant risk, and they will need careful monitoring and management
Meet stakeholders’ needs, keep satisfied |
A. These are stakeholders appearing to have a high degree of influence who are also of high importance for achievement of objectives. This implies the organisation will need to construct good working relationships with these stakeholders to ensure an effective coalition of support. Examples might be senior officials and politicians or trade union officials
Key players, manage closely |
||
| Somewhat influential | |||||
| Little or no influence |
D. The stakeholders in this box, with low influence on, or importance to, objectives may require limited monitoring or evaluation, but are of low priority Least important, monitor with minimum effort |
B. These are stakeholders of high importance to the success but with low influence. This implies that they will require special initiatives if their interests are to be protected. An example may be some smaller or marginalised groups (eg, indigenous people, youth, seniors) Show consideration, keep informed |
|||
| Unkown | |||||
Table 42. Selected engagement methods
| Communications methods | Consultation methods |
| One-on-one meetings to update people about changes or progress (usually required on a regular basis with key stakeholders)
Informal and formal meetings with stakeholders individually, or in groups, where prepared information is handed out Inviting stakeholders to sit on steering, advisory or working groups Presentations to staff/senior management teams/boards Written communications, for example in the form of newsletters, and updates or drafts of papers Emails (taking care to send only to relevant people), memoranda and letters Advertorials in newspapers and magazines Media releases Social media (eg, Twitter, Facebook, LinkedIn) that are of importance to stakeholders Signs and safety signs |
Committee (eg, OHS, risk management, project)
Interviews to gather information Focus groups and seminars – these might be a useful way of involving members of the public or a sector, representative organisation, and users Appointed or elected individual representatives or committee members Use of an online survey (but respondents must have access to a computer and the internet) Paper-based questionnaire Risk assessment workshops Workshops where external or internal stakeholders can contribute knowledge Recruiting team members from stakeholder organisation Joint working with stakeholder organisation on key issues Seminars for broader debate of issues or topics Posting key papers on websites (public and intranet) |
21.3.10 Failure modes and effects analysis
- What are the objectives of the activity, system, subsystem, unit, or part?
- What is the nature and level of uncertainty that could affect achievement of those objectives?
Failure modes and effects analysis (FMEA) helps identify how a system, sub-system, unit, component, process or activity can fail to achieve the design intent (IEC/ISO31010, 2019; Kirwan & Ainsworth, 1992). FMEA originated in the motor vehicle industry in the 1980s and now is used in a wide range of industries including aerospace, engineering, and health care.
FMEA can be expanded to include analysis and ranking of the criticality of a failure mode. It then is called failure modes and effects and criticality analysis (FMECA). It is applicable to risk identification and analysis of the consequences of a failure.
Nature and degree of uncertainty
Failure modes and effects analysis uses input data that may not be complete or relevant to the study in hand. It results in descriptions and actions with no priorities. Failure modes, effects and consequences analysis similarly uses input data that may not be complete or relevant and the ratings may be highly subjective. When applied to each component or stage in a process or activity, FMEA can help identify all failure modes and help identify corrective actions. It offers best improvements in dependability when carried out in the design stage.
When used on multiple systems the number of sub-systems, units or components can be considerable and require much work. It does not identify combinations of failure modes, but the results of FMEA can be used in fault tree analysis to help identify such combinations.
Use of quantitative input data may not relate to the generation of components under analysis. In FMECA the risk priority numbers, and consequence scales may be subjective and contentious.
Outputs can be used as qualitative or quantitative inputs to other risk techniques (eg, HAZOP, fault tree analysis, event tree analysis, bow tie analysis). The audience is normally technical staff (engineers, scientists, technicians) and managers.
Semi-graphical techniques variously called the “Risk Estimator”, “Visual Risk Calculator Worksheet” or “Tieline Risk Calculator” also use three scales that can be multiplied together to give a level of risk or risk estimate. None has been tested and may do no more than yield a rough estimate that “risk B needs attention before risk A”.
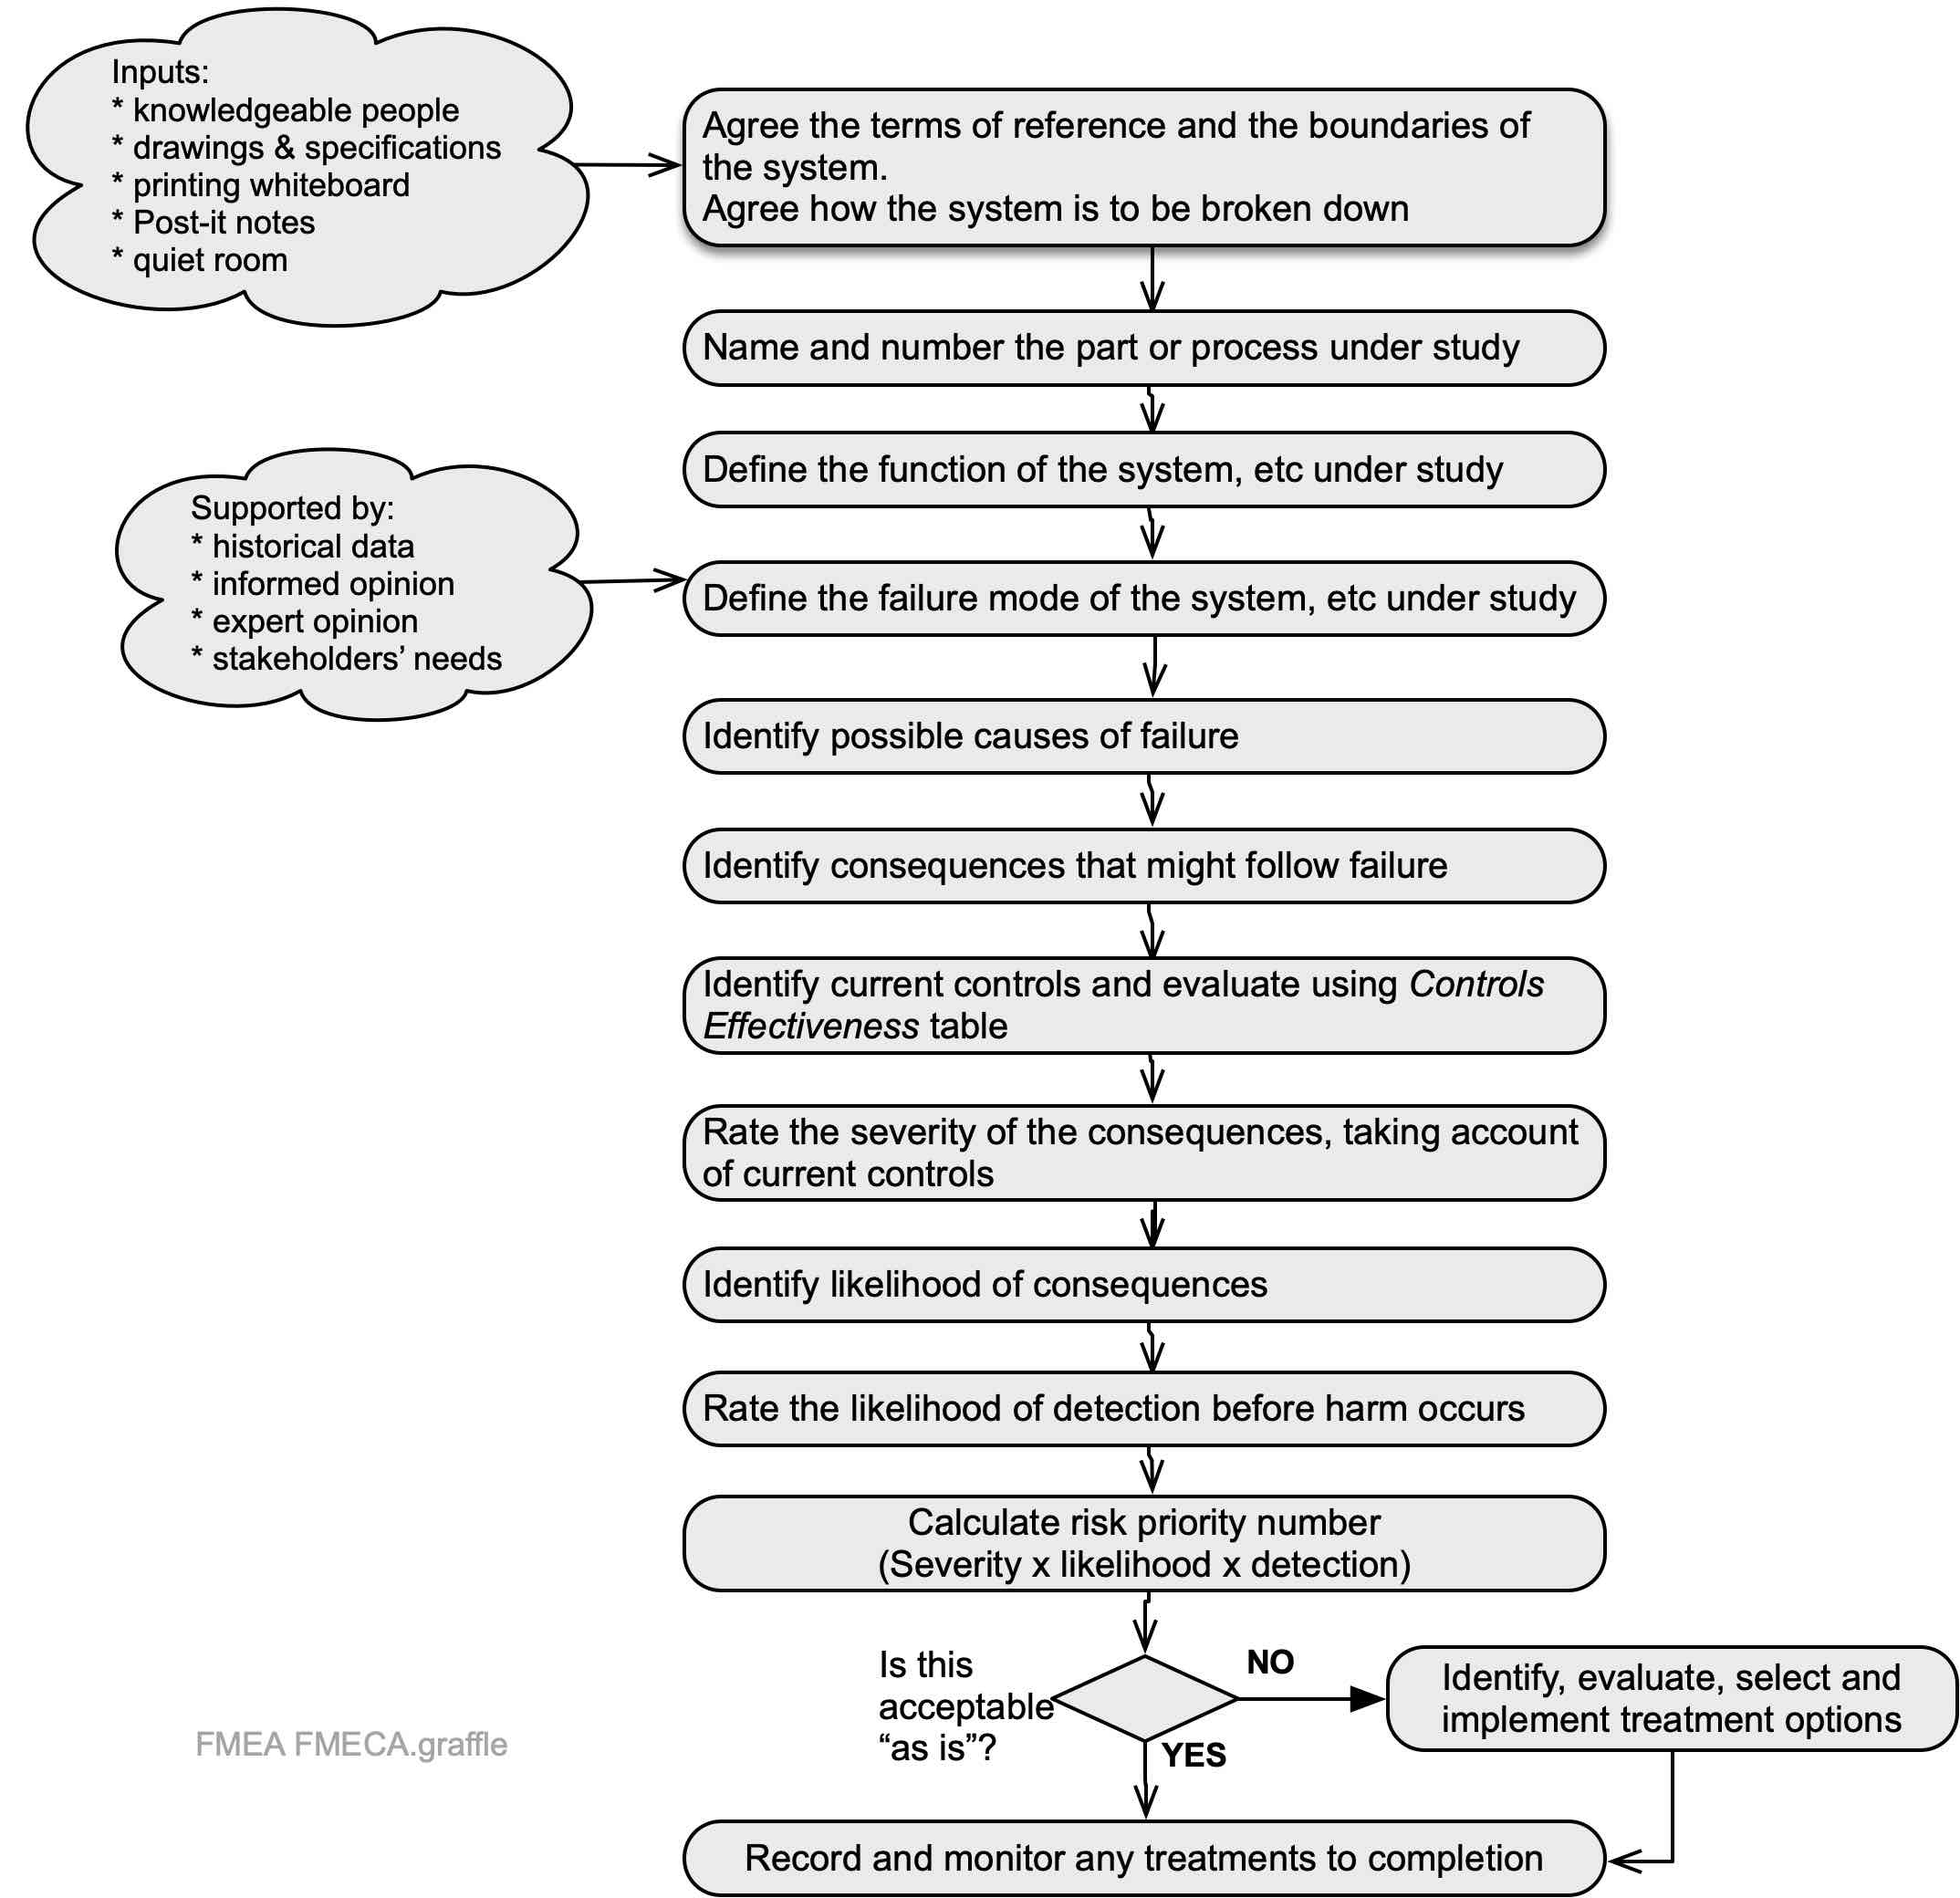
The following table is a suggested FMEA and FMECA record sheet.
Table 43. Outline sample FMEA/FMECA record sheet
|
FMEA step |
Item 1 |
Item 2 |
Itemn | |
| 1 | Part or process name and number | Pipe 14 | Pipe 15 | etc |
| 2 | Part or process function | Connects tanks A and B | Connects tank B to array of dispensers | |
| 3 | Failure mode | Impact damage | Impact damage | |
| 4 | Consequences of failure | Spill of lube oil | Spill of lube oil, flows into storm drain | |
| 5 | Causes of failure | Forklift truck hits pipe | Forklift truck hits pipe | |
| 6 | Current controls | Barriers, lighting, positioning away from road | None | |
| 7 | Consequence of event
(1 = trivial 10 = catastrophic) |
7 | 10 | |
| 8 | Probability of consequence
(1 = extremely unlikely 10 = almost certain) |
3 | 7 | |
| 9 | Detection of event before harm occurs
(1 = high likelihood of detection 10 = very low likelihood) |
8 | 10 | |
| 10 | Risk priority number (RPN): likelihood x consequence x detection | 168 | 700 | |
| 11 | Recommended treatment or corrective action | None currently | Relocate pipe, barriers | |
| 12 | Treatment owner | Production manager | ||
| 13 | Recalculated likelihood of failure | 0 | ||
| 14 | Recalculated consequence of failure | 0 | ||
| 15 | Recalculated detection of failure before harm occurs | N/A | ||
| 16 | Recalculated RPN | 0 | ||
The second of the two items has Risk Priority Number of 700 and would demand more urgent action than the example with a Risk Priority Number of 168. Treating item 2 would eliminate the risk resulting in an RPN of 0.
21.3.11 Fault tree analysis
- What are the objectives of the organisation, activity, system, or item?
- What is the nature and level of uncertainty that could affect achievement of those objectives?
- Cross-reference to clauses 6.1 and 8.1 in ISO45001 and some other standards.
Fault tree analysis (FTA) is a “top down”, logic-based analysis tool for identifying “events” that can combine through AND or gates to result in a specified “top event” (IEC/ISO31010, 2019)and can also be used as an investigation technique (CSB, 2017; Livingston et al., 2001). The events may be initiating events, changes in circumstances or failure of controls. A fault tree can be used as the left-hand side in bowtie analysis. The finished FTA shows where likely failures or combinations require treatment to modify the top event.
A well-constructed qualitative FTA can give very good information about how the top event might occur. A large FTA can be time-consuming to develop but can help identify where there is complexity in a system.
A fault tree analysis can be quantified by assigning probabilities to initiating events or faults. These are then combined through AND and OR logic gates. In an AND gate, the probabilities are multiplied. In an OR gate, the probabilities are added. The probabilities of events are mostly derived from historical data. If there has been a change in that data or in the conditions of use or operation of the system, a quantified FTA may be inaccurate.
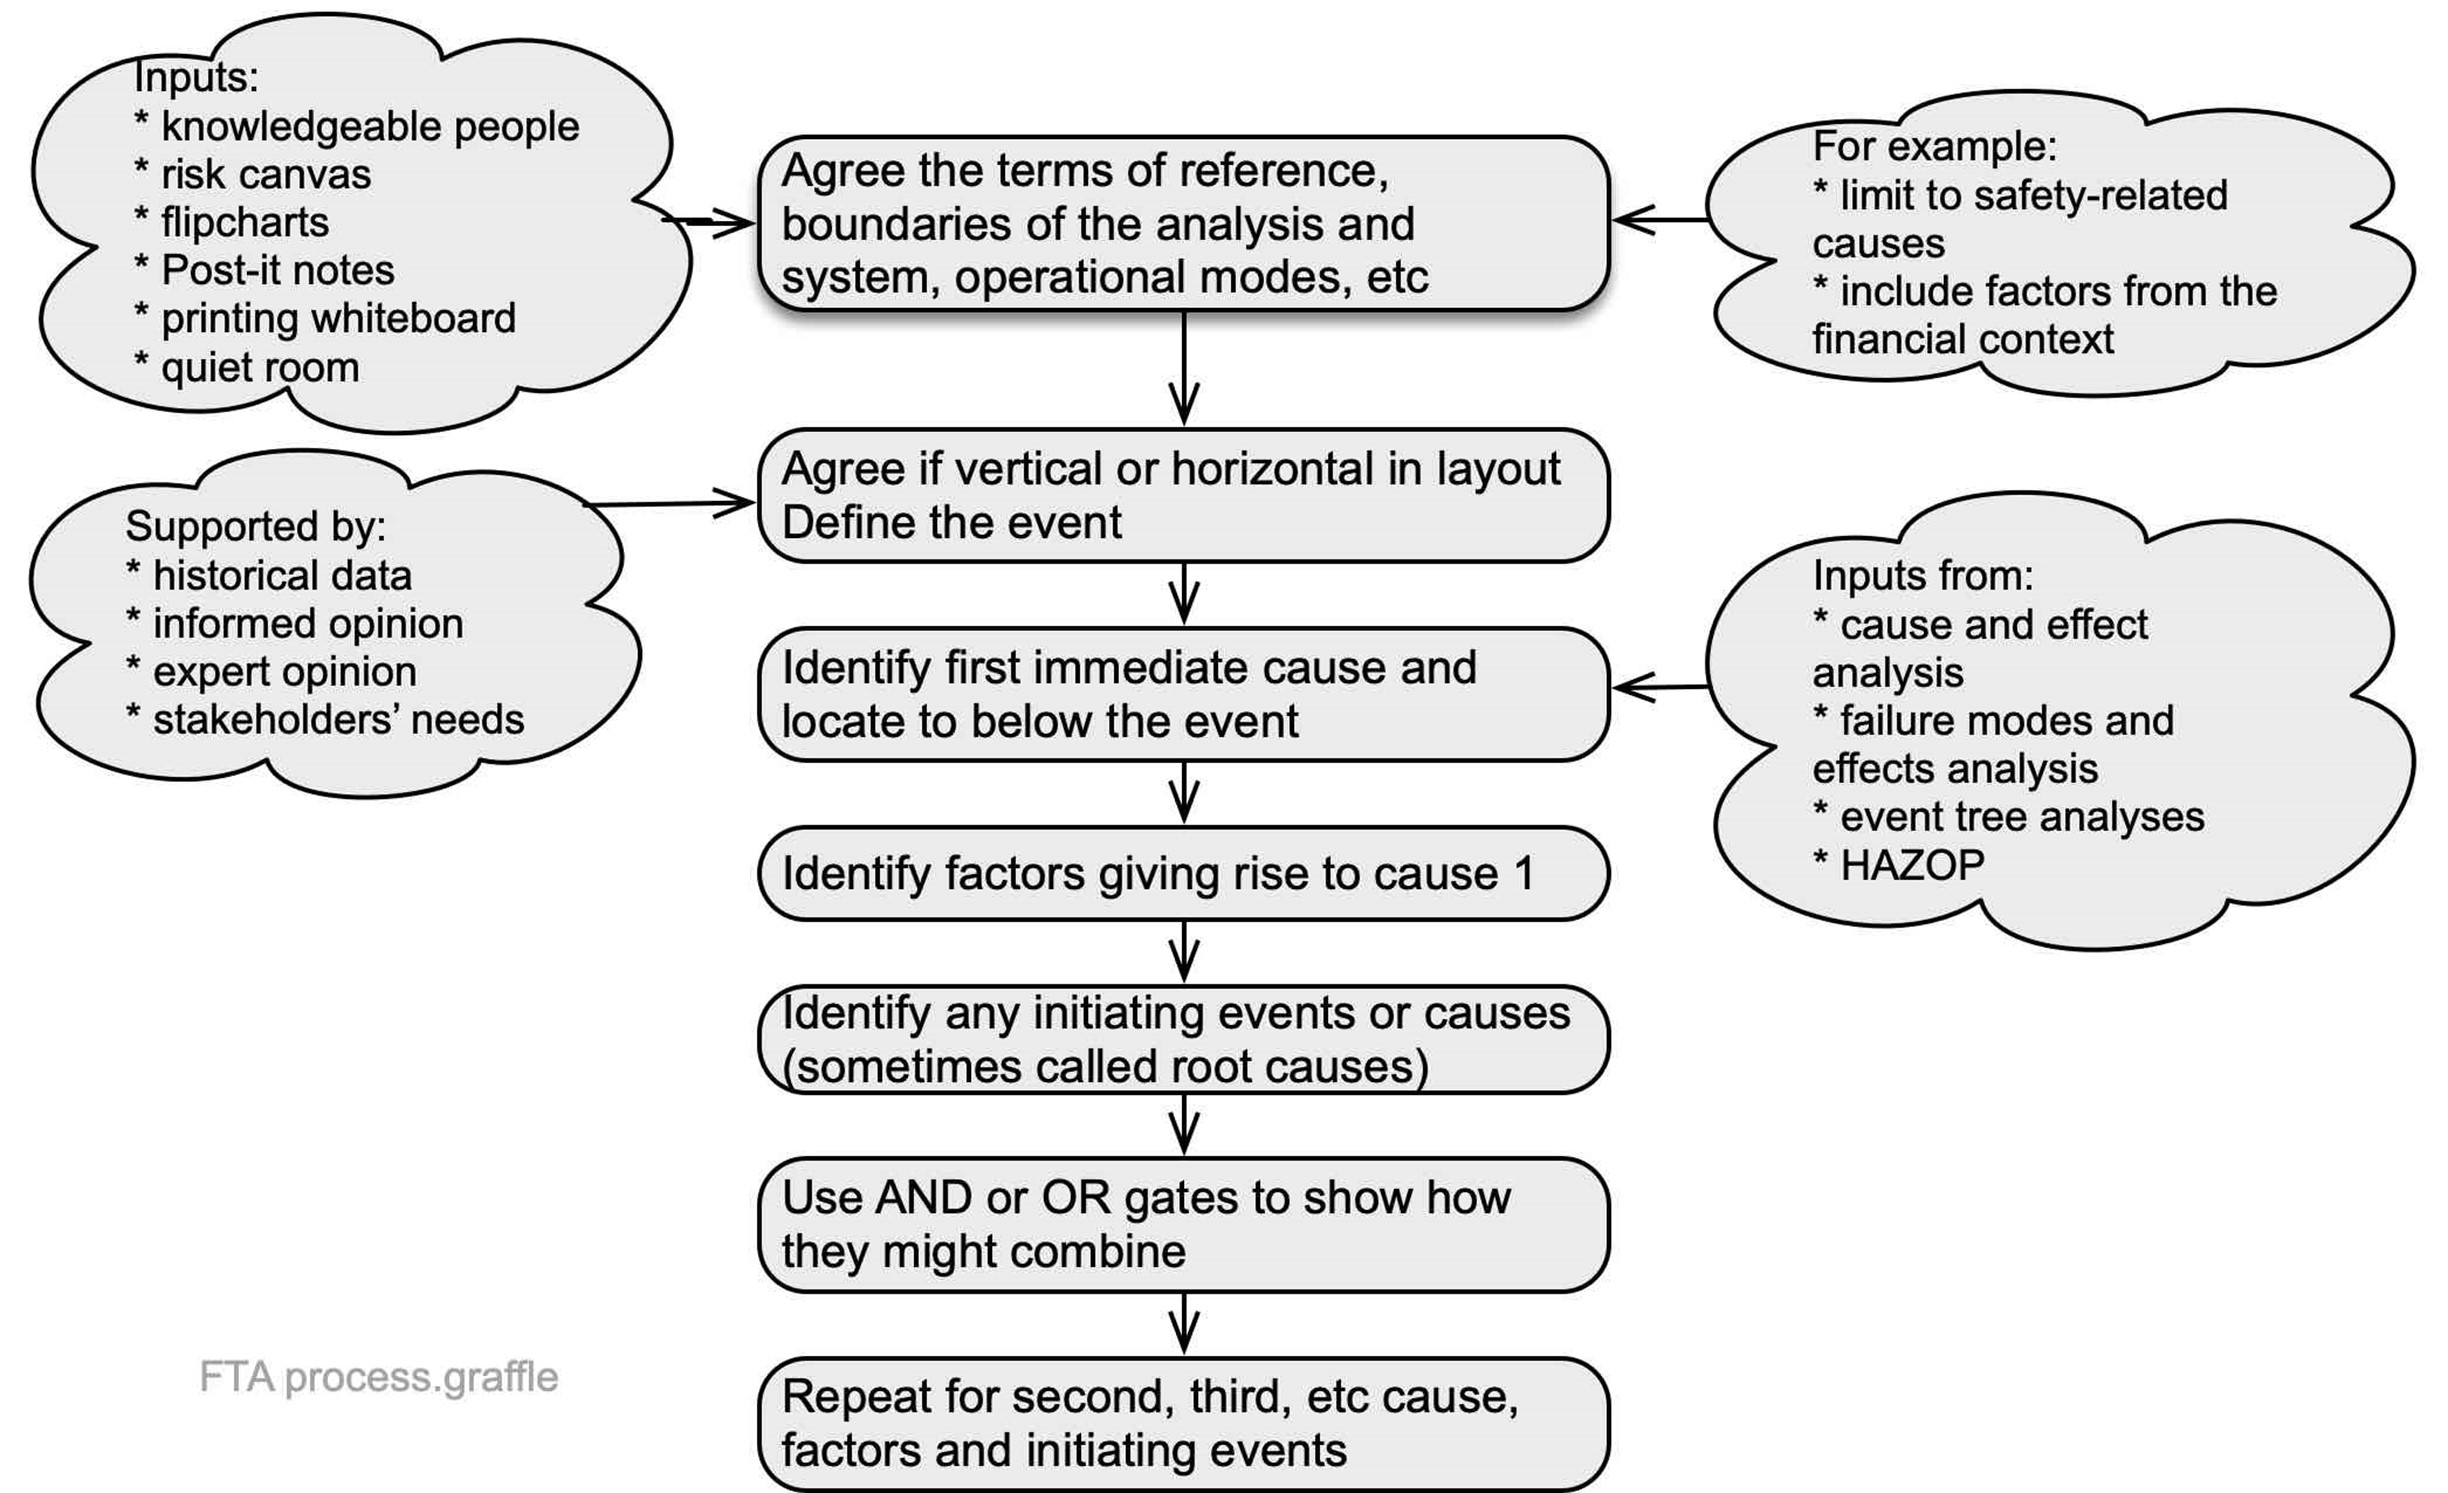
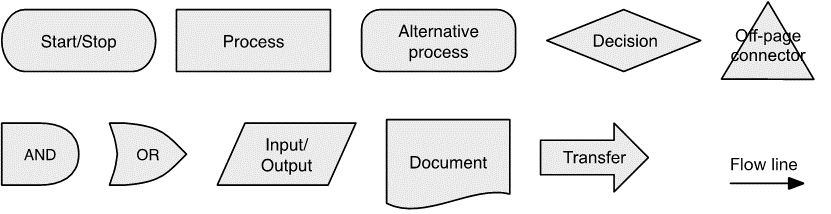
The following are symbols commonly used in fault tree analysis and process maps. A simple fault tree can be completed with just the process, AND, and OR symbols, but larger or more complex trees may require the use of more symbols.
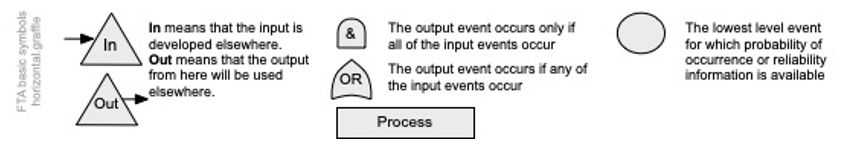
Source: Author using IEC/ISO31010 (2019)
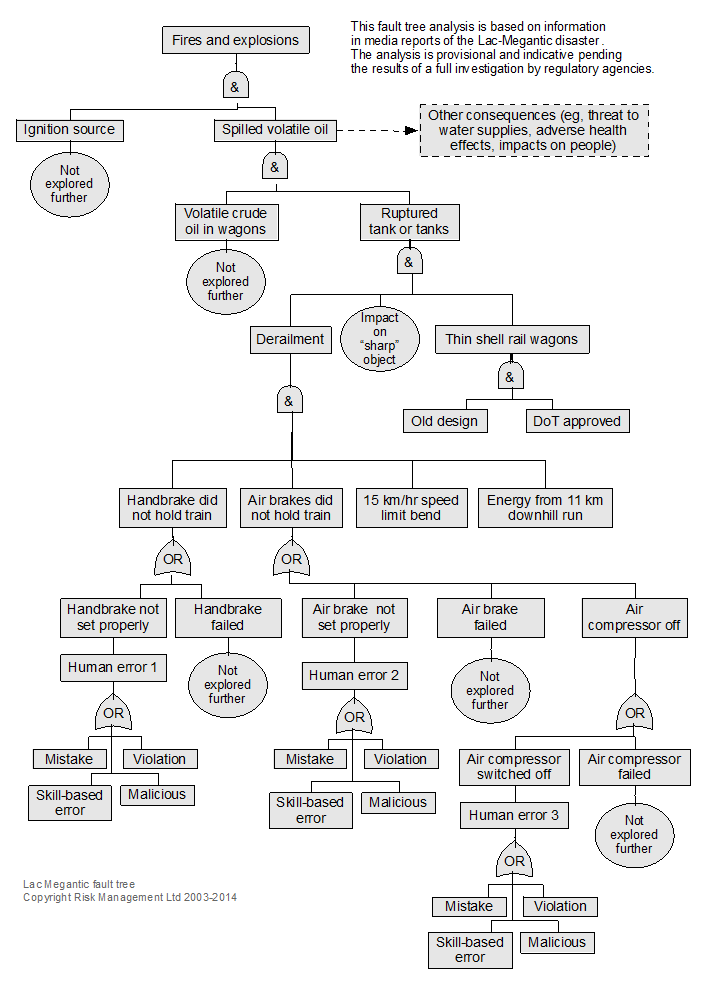
Example: use of a fault tree for analysis of the Lac-Megantic, Canada case study
In 2013 the hand brake and air brakes on a parked train loaded with volatile crude oil failed. The train rolled 11 km down a hill into Lac-Megantic, a small town in Canada, where it derailed. The oil ignited and the explosion destroyed the town centre, killing 49 people.
Figure 72, a vertical fault tree, analyses the event but does not show the ultimate root cause – transport of volatile crude oil by rail due to the absence of a pipeline. Work through the fault tree to see how many causal factors were almost certain (ie, probability of ≤1).
On 14 February 2015 a similar train derailed in Canada followed by two similar events in March 2015.
Investigation report
The following diagram is from the Transportation Safety Board of Canada (2014) report on the incident and shows the 18 contributory factors. The fault tree analysis could be redrawn to include them.
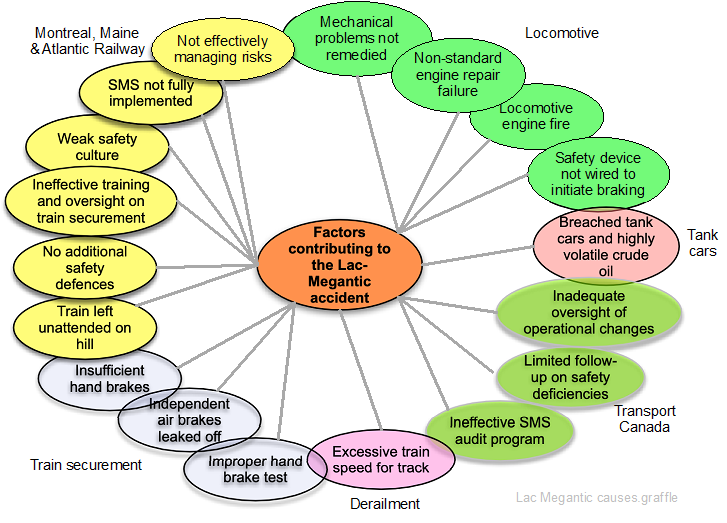
Source: Adapted from Transportation Safety Board of Canada (2014)
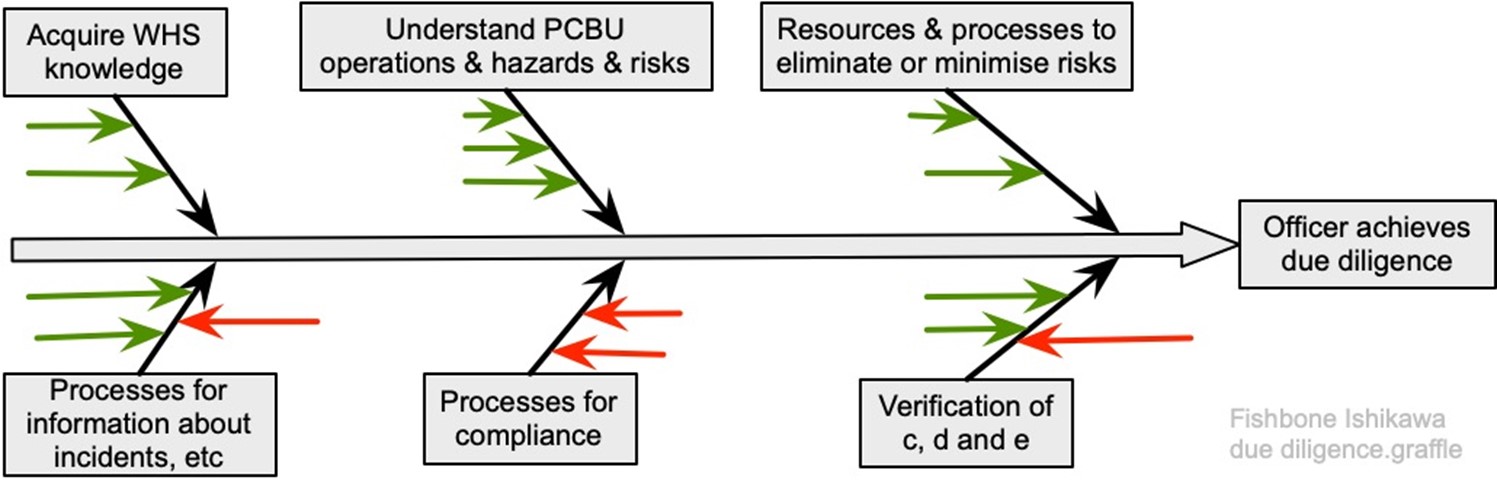
21.3.12 Fishbone or Ishikawa diagram
The Fishbone or Ishikawa diagram was developed by Professor Ishikawa of Tokyo University (Proctor, 2019)to help identify, analyse and graphically represent key factors in a project, or what might, or what did, cause an event (IEC62740, 2015; IEC/ISO31010, 2019). The event being studied is identified and positioned at the right-hand side. A horizontal line is drawn to the left of the event and categories for the main causes selected. Common categories include: 6Ms (methods, machinery, management, materials, manpower, money); 5Ms (methods, machinery, management, materials, manpower); 4Ss (surroundings, suppliers, systems, skills).
For each main category, ask “why” and “how” might that happen? Each is then reviewed for completeness and consistency, and to identify the most important and the best available information. Note that there is no right set of categories. Figure 73 suggests how an Ishikawa diagram could be used to analyse due diligence under section 44 HSWA; the sub-categories have not been named, the green arrows represent positive factors leading to success, and red arrows are factors leading to failure.
Chang & Lin analysed 242 tank accidents and mapped them in the following Fishbone diagram. Note that they used categories derived from their analysis and not one of the common categories.
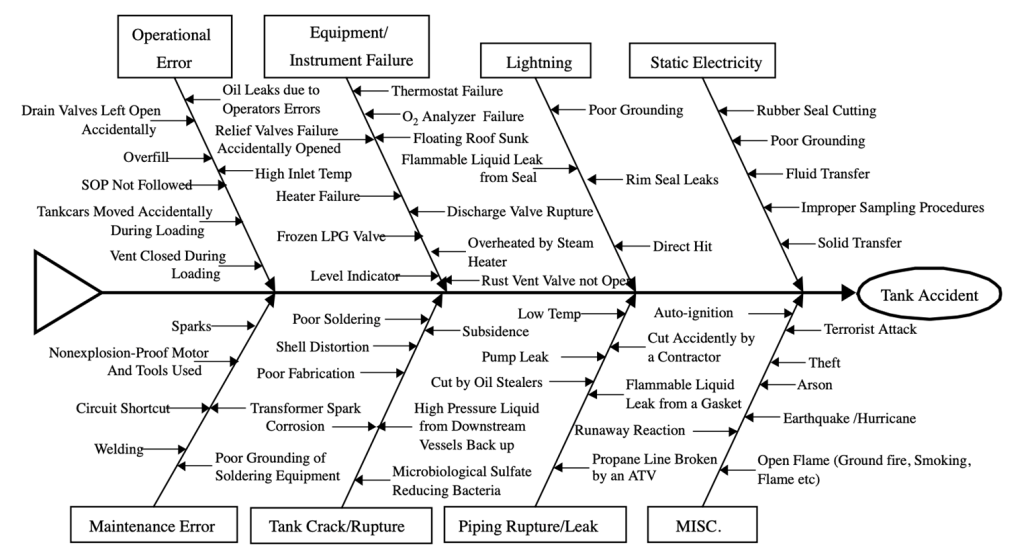
Source: Reproduced from Figure 1, Chang & Lin (2006)
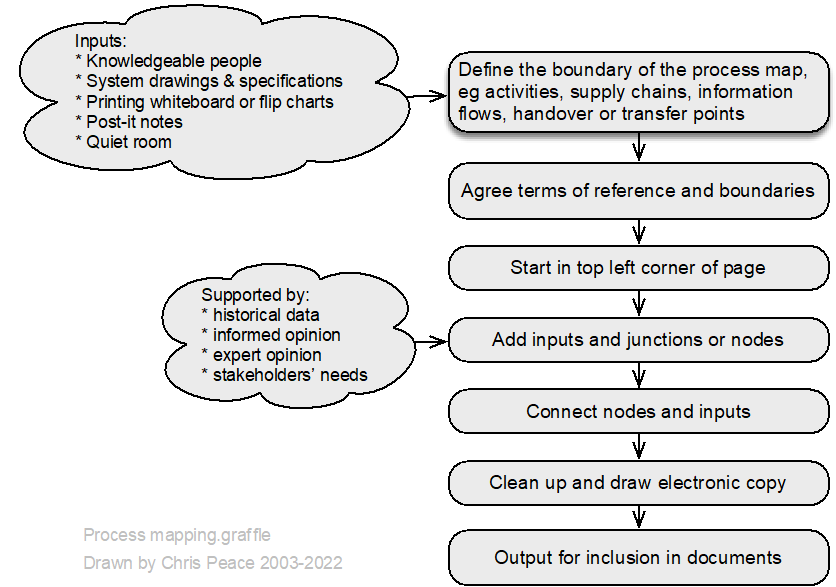
21.3.13 Flowcharting or process mapping
- What are the objectives of the organisation, activity, system, or item?
- What is the nature and level of uncertainty that could affect achievement of those objectives?
- Cross reference to clauses 4.1 and 6.2 in management system standards.
Process mapping is a graphical technique (https://en.wikipedia.org/wiki/Flowchart) that can show how “things” move through a system. This might be done by two teams: one maps the system as imagined by management or the system designers while the other team maps how the system actually works (“work as imagined and work as done”). Such a comparison can be very revealing.
Process maps can form part of documented information maintained under clause 7.5 Annex SL.
It is most common to use symbols mutually agreeable within a team or workshop group although some preferred symbols are in Figure 76.
Weaknesses of process maps
- large process maps may be difficult to read or maintain
- may not represent complexity
- cannot be quantified.
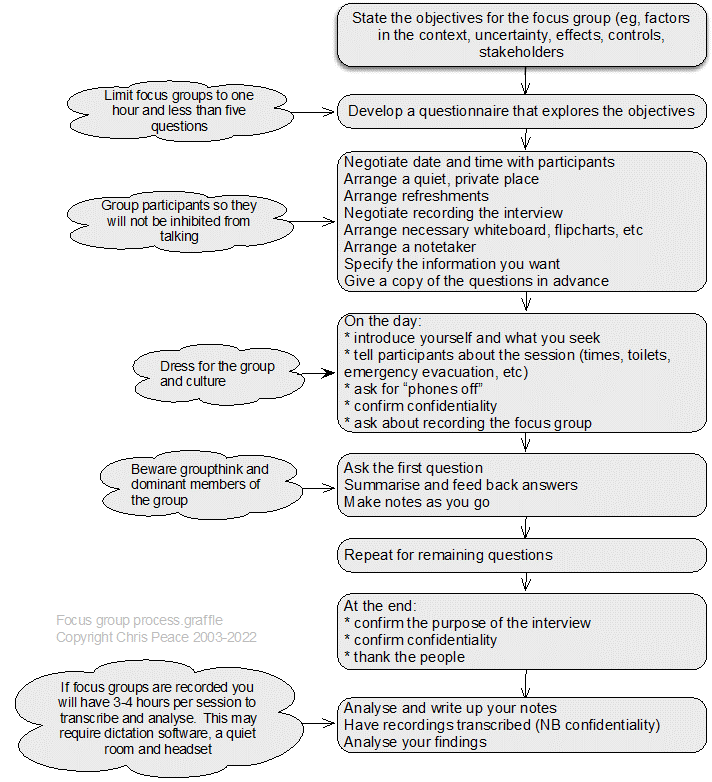
21.3.14 Focus groups
Description
A focus group is a group interview (Saunders et al., 2019, pp. 467-472), composed of a small number of participants, facilitated by a “moderator”, in which the topic is defined clearly and precisely and there is a focus on enabling and recording interactive discussion between participants (Ritchie & Herscovitch, 1995).
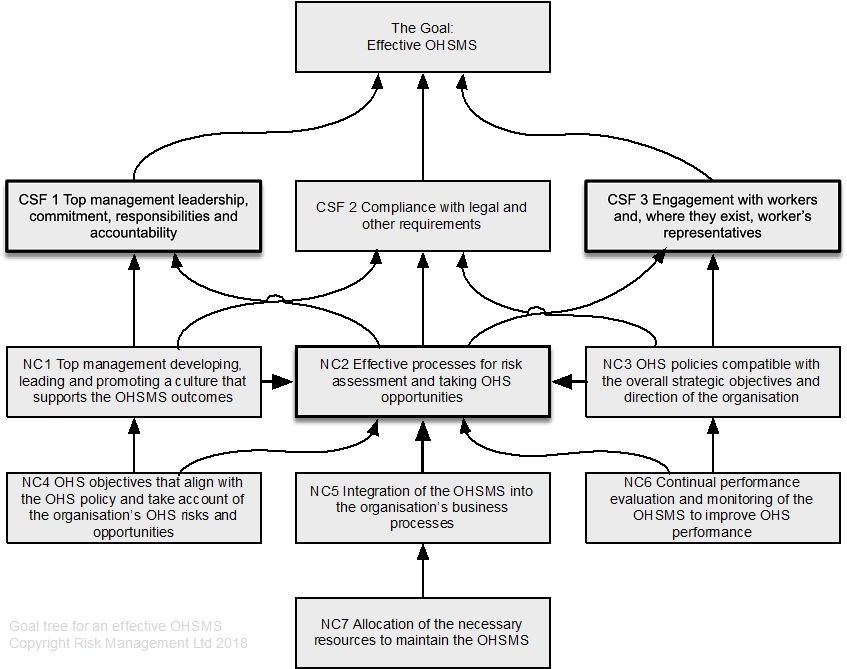
21.3.15 The Goal Tree
The Goal Tree is part of the Theory of Constraints, a quality improvement set of tools that is also widely used in operational research. A Goal Tree shows the relationship between 3-5 critical success factors (CSF) that must be achieved if the goal is to be achieved, and their underpinning necessary conditions (NC). The GT was developed by Dettmer (2007, 2011) and researched by Peace (2019). The concept is summarised in the following chart.
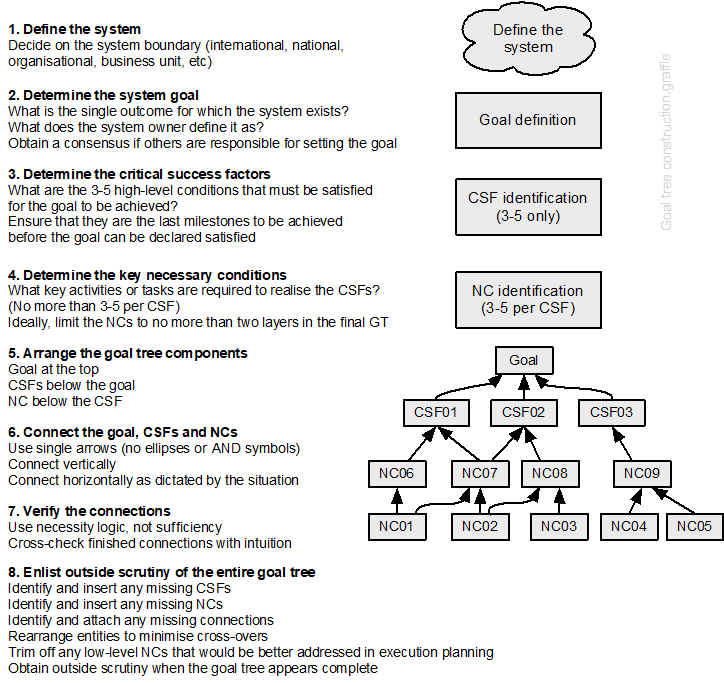
Source: Adapted from Figure 3.14, Dettmer (2017)
Developing a goal tree can be tedious but very rewarding as it can result in decluttering overlapping and duplicated policies and systems of work. ISO45001 (2018, pp. vi-vii) sets out 11 success factors for achievement of the goal, an effective OHSMS. Some are necessary conditions rather than critical success factors, but most have been included in the tentative GT shown in Figure 79. This is goal tree is tentative because it has not been tested (an area for applied research).
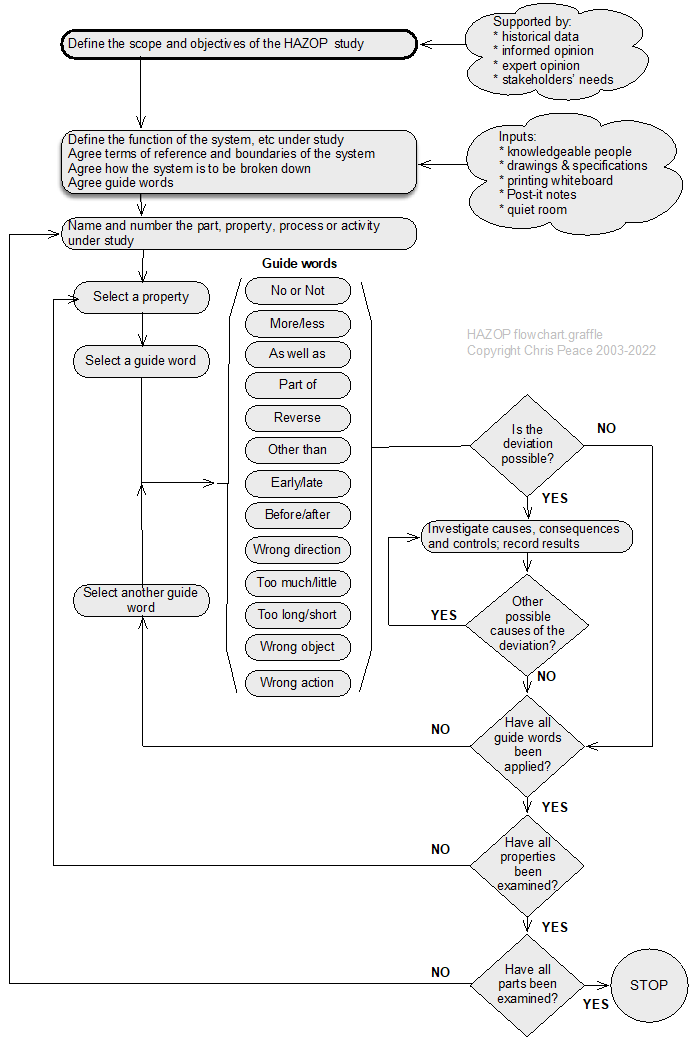
21.3.16 HAZOP analysis
- What are the objectives of the activity, system, subsystem, unit, or part?
- What is the nature and level of uncertainty that could affect achievement of those objectives?
HAZOP is an acronym formed from HAZard and OPerability study; HAZOP studies can be applied to carry out qualitative risk analyses and help prompt for risk treatment options (Grainne, 2004; IEC/ISO31010, 2019; Kletz, 2001, pp. 207-210). Originally developed in the 1970s for the chemical industry (Swann & Preston, 1995), HAZOP has been used in a wide range of sectors and settings. The process is summarised below, and an example of a HAZOP worksheet is shown on the next page.
Alternative guide words
For a human factors HAZOP the following additional words might be used.
| No action | More action | Less action | Wrong action |
| Part of action | Extra action | Other action | |
| More time | Less time | Out of sequence | |
| More information | Less information | No information | Wrong information |
Nature and degree of uncertainty
A HAZOP study can give a thorough analysis of a stated system but provides no analysis of uncertainty outside the agreed system. It does not ask why a system exists and is limited to the given design and the objectives of the review. HAZOP is time-consuming but can yield excellent results given an effective group facilitator.
As shown in the process map, HAZOP is used for risks with “undesirable” consequences. These might be negative (eg, harm to people, fire, fraud) or positive (eg, excessive profits harming reputation and share analysts’ expectations).
Table 44. HAZOP worksheet
| System element | ||||
|---|---|---|---|---|
| Objectives of the element | ||||
| Scope | ||||
| Team members (design) | ||||
| Team members (operational) | ||||
| Documents referred to | ||||
| Guidewords |
Definitions |
|||
| No or Not | No part of the intended result is achieved (eg, no flow) | |||
| More | Quantitative increase such as increased temperature or flow | |||
| Less | Quantitative decrease such as reduced temperature or flow | |||
| As well as | Qualitative change such as impurities present or simultaneous execution of another operation or step | |||
| Part of | Qualitative change such as only part of the intention is achieved (eg, only part of an intended fluid transfer) | |||
| Reverse | Opposite or reverse of intention (eg, flow in pipes, reverse reaction) | |||
| Other than | No part of the intention is achieved, something completely different happens | |||
| Early | Something happens early relative to clock time | |||
| Late | Something happens late relative to clock time | |||
| Before | Something happens earlier than intended in a sequence | |||
| After | Something happens later than intended in a sequence | |||
| Guideword | Deviation | Possible causes | Consequences | Controls or treatment required |
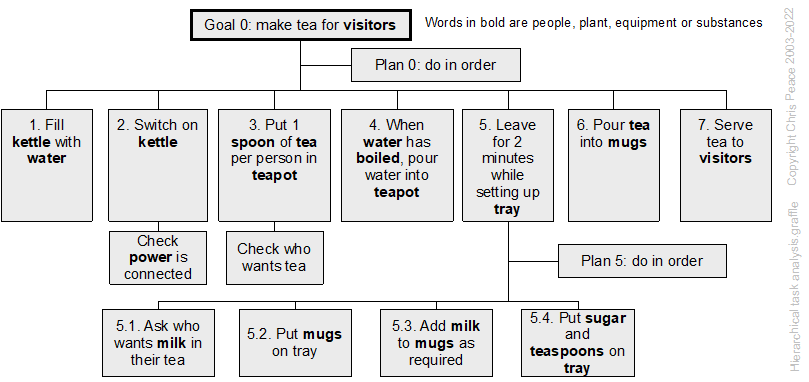
21.3.17 Hierarchical task analysis
Review the risk management policy
Establish who is accountable for this work. For example, who is the budget-holding manager? In some instances, there may be interdepartmental activities and two or more groups to involve.
Establish the organisation requirements for worker engagement. Development of a standard operating procedure or safe system of work requires full support and engagement with the workers or contractors who will carry out the work.
Establish a method for selecting jobs
In organisation with well-established job analysis systems line managers and employees may collaborate to select jobs to be analysed while in other situations this might be done by “corporate staff” (eg, following an incident resulting in an injury, damage or “near hit”).
A range of criteria might be used to help decide which jobs or tasks should be analysed first, including:
- potential severity of one or more consequences
- likelihood of consequences
- professional judgement of experienced people
- importance of the job or task for organisation objectives.
Often, more than one criterion will be relevant, and jobs or tasks will need to be ranked in a priority list.
Carry out the job analysis
This will require some form of observation of the work activity; see the next page.
Current controls and their effectiveness are recorded and (for safety-related risks) possible treatments identified to help ensure that (1) all that is practicable has been identified and then (2) assessed for reasonableness (ie, is there anything else that could be done that would make the activity more reliable at a reasonable cost).
Independent review
It is preferable that someone other than the assessment team review the results to help ensure they are valid and can be implemented.
Implement the results into operational systems
This may require changes to hardware, information such as documents (ISO/N1286, 2015) or training, instruction or supervision of employees (Health and Safety at Work Act 2015, section 36(3)(f)).
21.3.18 Inspections, physical surveys and observations
- What are the objectives of the organisation, activity, system, or item?
- What is the nature and level of uncertainty that could affect achievement of those objectives?
To survey is to “look carefully and thoroughly at”, or to “examine and report on the condition of” while to inspect is to “look at closely” in a series of observations and to observe is to “watch attentively” (Oxford University Press Ltd, 2022) an event or activity. Research (Hrymak & de Vries, 2020) has shown that formal training will improve the ability of people to see (“perceive with the eyes”) rather than look (“direct one’s gaze in a specified direction”) (Oxford University Press Ltd, 2022).
Current requirements for inspections of plant can be traced back to 1854 and standards set by marine (ie, boiler and pressure vessel) insurers, but now include risk-based inspections (Jackson, 2014; Wintle et al., 2001). A structured safety “walkabout” can result in a reduction in workplace injuries (Hopkins, 2011; Mikkelsen et al., 2010) and is a good way to find hazards, or causal factors of events.
The MORT chart (NRI, 2009a) includes the subtree for inspections shown in Figure 82.
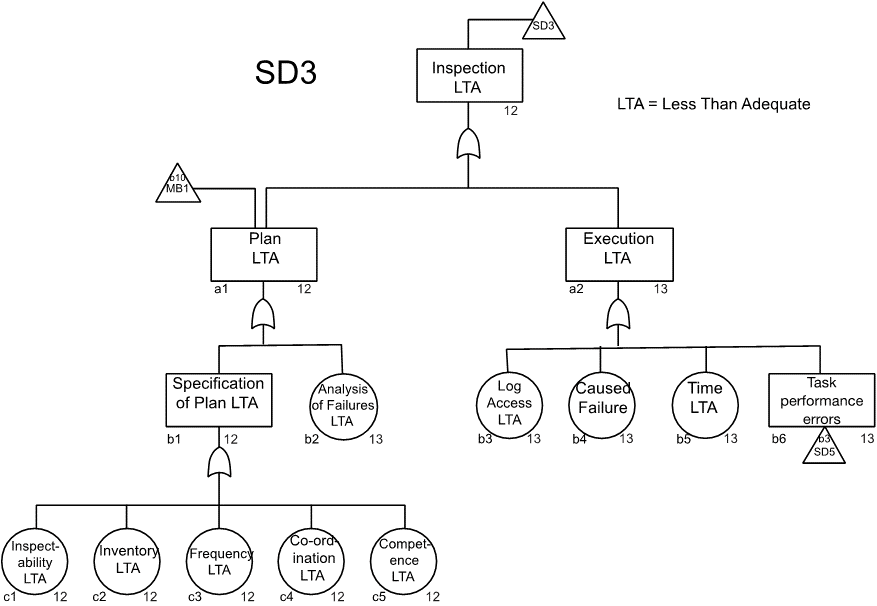
Source: Reproduced with permission from inspection sub-tree in the MORT chart (NRI, 2009a). For use with the Management Oversight and Risk Tree analytical logic diagram.
Structured inspection plan
Inspections generally should be scheduled for earlier in the day to avoid “inspection fatigue” resulting in causal factors being missed (Ibanez & Toffel, 2017).
The inspection plan should include why the inspection is required, who is to carry out the inspection (including necessary competence), what is to be inspected (eg, buildings, “rooms”, plant), when the inspection is to be carried out (eg, coordination with cleaning or maintenance work), and how the results will be recorded (eg, handwritten, voice recording, still or video photography). Execution of the inspection must allow sufficient time, use a structured process, and avoid damage to the subject of the inspection.
A site plan, aerial photograph or location map may help with understanding the layout of a site. Previous reports describing inspections or testing may be available and should be obtained before commencing the inspection.
Ask for a flowchart of the business activity. If one is not available ask the guide to draw it for you in your notebook or on a sheet of paper. Ask for standard operating procedures or similar documents that will help you better understand the process and individual activities on site.
A structured approach to inspecting a workplace would be to stand at the entrance to the “room” and survey (“look carefully and thoroughly at”) the ceiling, walls, and floor. The work activities, plant, substances, and general workplace environment are then surveyed, with a record being made of any hazards or causal factors found. It might not be possible to inspect some items or features due to their design or because they have been “built in”. Such issues should be recorded for subsequent action and a follow-up date.
Clothing and equipment
When planning site inspections account should be taken of the type of premises and the equipment, and the equipment, clothing, etc that may be needed. For example, a construction site inspection will require hardhats and safety footwear; disposable outer clothing may also be appropriate.
A digital camera and audio recorder facilitates information gathering but ensure that it is acceptable and safe to use electronic equipment on site.
Occupied and active commercial and industrial sites
Inspections or audits of occupied and active industrial sites require a guide or representative of the occupier who can warn of hazards and facilitate access as necessary.
Conduct of an inspection
Download and print a digital map of the site to aid navigation. Arrive early and look at the site from outside the boundary to identify any features of interest.
Before entering any buildings, it is good practice to tour the site as a whole and identify any points of interest. Use the site map or aerial photograph to help make notes. During this tour identify any external plant or storage areas. Photograph each.
In a food business or similar businesses requiring high standards of hygiene it is good practice to start at the cleanest point and work backwards towards goods inwards. In other businesses it may be acceptable to following the process from raw materials in to finished goods despatch.
The following general pattern of inspection can be adapted to specific needs.
- Pause at the entry point in the building or room you are about to enter and take in what is going on.
- Photograph the view.
- Check where you will be walking and any need for caution.
- Note the construction and condition of the floor, then the walls and the ceiling or roof.
- Note the standards of housekeeping and, in an industrial workplace, whether there is dust or some other haze in the atmosphere.
- Then follow the process from raw goods or work in progress to the point where it leaves the space or room.
- Note the plant or equipment used, the activity, quantities and accumulations of waste materials and any other points of interest.
- Observe and make notes about work practices.
- Interview workers as you go and record points of interest for the audit or inspection.
- At the exit point, pause and look back to make sure you have not missed anything of interest.
- Photograph the view.
- Move on to the next building or room and repeat the above.
On completion of the inspection make sure you have seen all stages on the flowchart and areas of the site. If in doubt, ask to revisit!
Reflection
Does what you have seen make sense? Do you understand what is going on? What else to you need to know? Who else do you need to talk to?
Observations
Any form of observation will almost certainly require the written consent of the employees and their representatives.
Observation is a useful task analysis/job analysis technique (Kirwan & Ainsworth, 1992, pp. 53-58) and is also a research technique (Saunders et al., 2019, pp. 378-424). Observations are often direct, or use self-description diaries or logs, or in workshops. Observation through managers walking around may also benefit health and safety (Xu et al., 2023).
Direct observation can be done by watching how a task is carried out “on the floor”. This can be done by one or more people to collect more information about the tasks or behaviours that might need to be changed with the results recorded for subsequent discussion and action. Direct observation can be supplemented by video or still photographs for subsequent risk assessment (eg, in a workshop) or long-term records.
Using self-description diaries or logs employees are asked to record “a day-in-the-life” diary or log that is used later for risk assessment. It may be possible to use “bodycams” or audio diaries to facilitate data capture.
In a workshop, the job is broken down into a series of activities and sub-activities using hierarchical task analysis and any plant or equipment, substances, or other hazards the employee recorded. Data might be from the direct observations, self-description diaries or logs, or video, audio or still photographs as a source of information. Potential performance shaping factors and “human error” events are identified and analysed for their causes and consequences, and the likelihood of consequences, and the results are recorded.
Table 45. Hazards or causal factors to be alert to during observations
| Class of hazard | Exposure through: | Examples |
| Chemical | Inhalation | Dusts |
| Mists | ||
| Gases | ||
| Fumes | ||
| Skin contact | Pesticides and phenol absorbed through skin | |
| Acids and vapours corroding skin | ||
| Liquid toluene defatting skin | ||
| Creosote and bitumen as photosensitisers | ||
| Nickel and cadmium as allergens | ||
| Eyes and mucous membranes | Acids and vapours | |
| Physical agents | Ears | Noise |
| Whole body | Infrasound | |
| Vibration | ||
| Ultraviolet | ||
| Heat | ||
| Cold | ||
| Electromagnetic non-ionising radiation | ||
| Ionising radiation | ||
| Eyes | Light (Ultraviolet and infrared) | |
| Lasers | ||
| Biological | Some occupations have specific exposures; see the outline literature search on waste collection and disposal | Bacterial |
| Fungal | ||
| Viral |
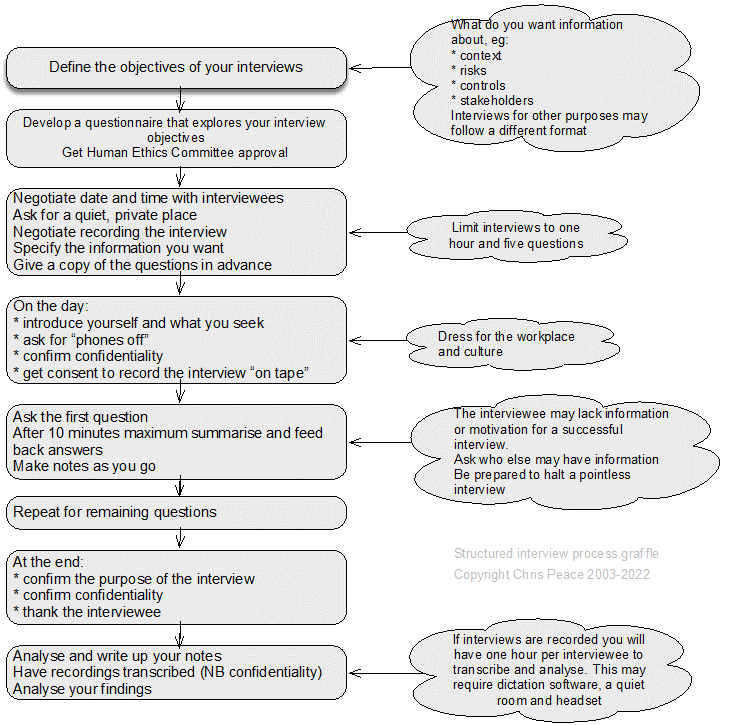
21.3.19 Interviews (structured, semi-structured, unstructured and informant) & enquiring
Interviewing stakeholders (Saunders et al., 2019, pp. 434-467) is a basic skill that can provide much information about a subject. Care must be taken to manage the interviews, so they remain focused on the context and do not drift on to pet gripes or other issues. Within a project, it is quite likely there will be a sequence of interviews to capture information about the context, sources, uncertainty, effects, consequences, controls, treatment options, etc.
A structured interview is a data collection technique in which an interviewer physically meets with respondents one at a time, reads them the same set of questions in a pre-determined order, and records the response to each.
A semi-structured interview is a wide-ranging category of interview in which the interviewer commences with a set of interview themes but is prepared to vary the order in which questions are asked and to ask new questions in the context of the research situation.
An unstructured interview is an informally conducted interview that may commence with one or more themes to explore with participants but without a predetermined list of questions to work through.
Enquiring may be preceded by a review of a standard operating procedure, or position or job description to understand how work is intended to be done (work as imagined) and then asking people about the way they carry out their work. This helps identify how it is carried out in practice (work as done) and may show major gaps between work as designed and work as done.
21.3.20 Job safety analysis
Kirwan & Ainsworth (1992) describe 25 task analysis techniques, including failure modes and effects analysis and hazard and operability studies. Although their book is out of print it can be bought second-hand.
See also Newcombe & Bywater (2005) and Pavlov (1979). Pavlov was developed for the US nuclear power industry and, despite its age, is still a useful source.
According to the Health and Safety Executive (HSE), when carrying out a risk assessment, step l is to identify the hazards. The HSE guide on risk assessment (www.hse.gov.uk/pubns/indg163.pdf) suggests: “A good starting point is to walk around your workplace and think about any hazards.” This “I spy” approach will inevitably miss some hazards, such as those created by routine work, maintenance or emergency procedures.
Elsewhere on the HSE website there are hints about a technique that will assist with hazard identification. In the Safety Report Assessment Guides for major accident hazard sites, the HSE lists job safety analysis (JSA) as an acceptable method. A similar term crops up in two research reports for the executive. One describes a toolkit of techniques to support behaviour change and worker engagement in small- and medium-sized construction companies, and refers to job hazard analysis (JHA) as one of the “safety programmes that were found to be most effective in reducing unsafe conditions”. An earlier report on behaviour change and worker engagement in construction mentions the use of JHA as a “bottom-up worker engagement method”. But while the HSE appears to accept JSA or JHA as suitable methods for identifying hazards, it offers no practical guidance on them.
The terms are used more widely in Canada and the US. The Canadian Centre for Occupational Health and Safety (CCOHS) website defines JSA as “a procedure which helps integrate accepted safety and health principles and practices into a particular task or job operation” (www.ccohs.ca/oshanswers/hsprograms/job-haz.html). It suggests four stages:
- Select the job
- Break the job down into a sequence of steps
- Identify hazards
- Determine preventive measures to overcome these hazards.
Steps 1 and 2 involve task analysis (TA), a set of techniques that became popular in the field of human factors in the 1980s. The standard text on the subject, A Guide to Task Analysis (Kirwan and Ainsworth, 1992), describes it as “any process that identifies and examines the tasks that must be performed by users when they interact with systems”. The benefits include increased productivity, reduced downtime, better designed jobs and safety improvements. Kirwan and Ainsworth describe 25 TA techniques covering data collection, task description, decomposition, simulation, behaviour assessment and evaluation of the task requirements. There are, therefore, many ways that TA can be applied to JSA.
Step 1 – choosing the job – is critical. A poorly defined job can result in important hazards remaining unidentified, but achieving the right granularity for the job is difficult. The CCOHS explanation that “overhauling an engine” is too broad but that “positioning a car jack” is too narrow, won’t help if you are risk assessing “driving for work”. One TA technique that will help is hierarchical task analysis (HTA).
An individual’s job can be divided into tasks, then into sub-tasks, until you reach a level of description that makes identification of the hazard straightforward. Hence “driving for work” can be divided into types of vehicle, then journey types, then times of the day. Jobs at the lowest level might include “driving home from an exhibition more than 100 km later than 9pm” and “driving less than 50 km at 10am” so hazardous sub-tasks can be identified.
JSA supports the hierarchy of controls by considering where elimination or substitution is possible at a finer level of detail. For a given job role, it might not be possible to stop driving for work but perhaps distances of more than 100 km could be eliminated or driving after 9pm substituted.
Many safety and health professionals instinctively consider the elements of each job task when deciding on suitable controls. What JSA offers is a set of tools to do this, and a systematic way of applying those tools and documenting the results.
Though CCOHS favours the term JSA, the US Occupational Safety and Health Administration (OSHA) uses JHA, defining it as “a technique that focuses on job tasks as a way to identify hazards before they occur” (www.osha.gov/Publications/ 0sha3071.pdf). The emphasis here is on identifying the hazards, rather than the CCOHS approach of integrating safety and health principles into the job. As such, JHA covers steps 1 to 3 of JSA, with the hazard prevention and management taking place after JHA is completed. At the end of its definition OSHA adds: “Ideally, after you identify uncontrolled hazards, you will take steps to eliminate or reduce them to an acceptable risk level.” It is not clear what the benefit of JHA would be if the risk level is not managed.
Source: Leathley (2016)
21.3.21 Layers of protection analysis (LOPA)
- What are the objectives of the organisation, activity, system, or item?
- What is the nature and level of uncertainty that could affect achievement of those objectives?
- Cross-reference to clauses 6.4, 8.1 and 9 in management system standards.
LOPA is a qualitative or semi-quantitative method for assessing the effectiveness of controls for risks associated with an undesired event or scenario (Chambers et al., 2009). Treatments can also be assessed using LOPA.
LOPA is typically used in process industries to decide if enough protection layers (controls) have been or will be implemented and maintained to prevent an unwanted event occurring, or to modify an event, or to restore normal functioning after the event has resulted in undesired consequences. Controls could be anywhere in a cause event consequence chain.
The best protection layer is independent of an event, its consequences and any other controls and is called an independent protection layer (IPL). An IPL is a device or action capable of preventing an initiating or other event proceeding to its undesired consequences. An IPL may be a design feature, physical device (including interlocks and shutdown systems), alarm, post-event physical protection or emergency response system. Each IPL is a control or a risk treatment.
No LOPA
In April 2003 an explosion in a plant in the USA making food-grade caramel released more than 10,000 kg of aqua ammonia forcing the evacuation of 26 nearby residents and requiring 1,500 people to take shelter.
The subsequent investigation found that no layers of protection analysis had been carried out. Had that been done it would have shown the need for:
- monitoring systems
- emergency response training of production workers
- alarms on the feed tank
- interlocks
- overpressure protection.
Source: CSB. (2003). Catastrophic Vessel Failure – D. D. Williamson & Co., Inc. Incident Investigation report; Washington, DC: Chemical Safety and Hazard Investigation Board. Retrieved from http://www.csb.gov, 14 April 2010.
The nature and degree of uncertainty depends on the experience of LOPA team and quality of input data. LOPA requires less time than some other techniques and helps identify the critical layers of protection. It does not analyse complexity in systems or common failure modes but is relatively simple and straightforward.
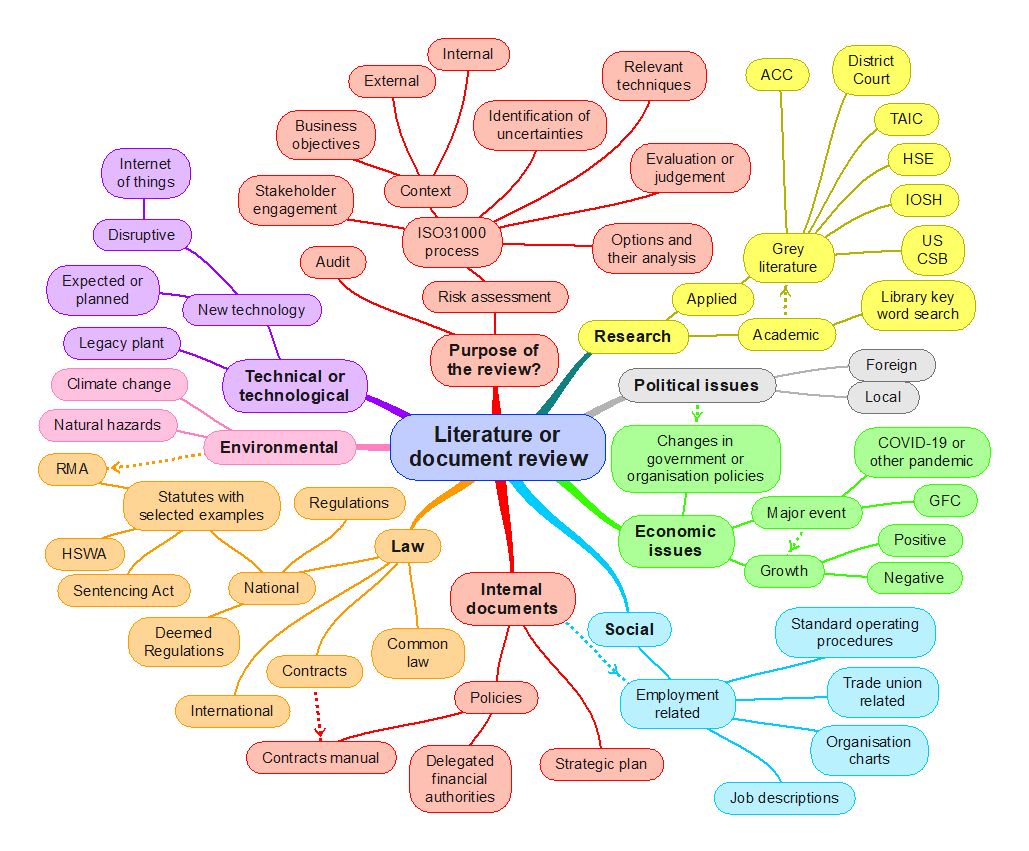
21.3.22 Literature or document review
- What is the research question?
- What are the objectives of the organisation, activity, system, or item?
- What is the nature and level of uncertainty that could affect achievement of those objectives?
A literature or document review is a qualitative technique for researching information (Saunders et al., 2019, pp. 72-115; Van Eerd, 2019; Van Eerd et al., 2017) to help establish or answer a research question or inform a project (Owen, 2018; Schmidt et al., 2021) or audit. It synthesises existing knowledge to produce information in a new format.
The term “document” should be interpreted widely to include any source of hard copy or electronic data (Bretschneider et al., 2017). Document review may lead you on to further information gathering or mapping. Identify sources of uncertainty but record these and deal with them later.
It is essential to establish criteria for what to review in a large project. For example, a review of compliance management will need a review of documents such as training records, contracts, and audit reports. Consult with people who are accountable for activities and note their suggestions for relevant documents. See Bowen (2009) for guidance on using documents as a source of information.
The following diagram suggests some generic topics and can be used to develop your own diagram.
Recording what you read
You may need a library catalogue or records management system that enables easy searching and extraction of documents from storage or filing systems. For documents external to the organisation, a good search engine and strategy are necessary. Notes taken should clearly identify documents and relevant passages. It is sometimes important to build a relationship diagram or mind map to help group documents together. For future reference, the output should be a catalogue of the documents reviewed.
21.3.23 Mind mapping
Origins
Mind mapping (Meier, 2007; Proctor, 2019) was originally developed by Tony Buzan (Buzan & Buzan, 1993) with his brother, Barry, in the 1970s. Mind mapping for management analysis is a way of creating a “rich picture” or the “big picture”.
A key theme or subject of interest is entered at the centre of the mind map and associated themes radiate from there. Each sub-term can create further sub-terms. The technique is applicable to lone working and brainstorming in workshops.
For risk management purposes, mind mapping can be used to identify factors in the external, internal and risk management contexts, causes of risk events, risk events, consequences of risk events and impacts on objectives.
Inputs are a large sheet of paper or software and a group of people knowledgeable about the area of interest.
The first key term of interest is identified and written on a sheet of paper or entered into the software. Main themes, sub-themes and subsequent branches are then linked to the key term until exhausted.
The outputs are a structured understanding of the area of interest that enables further analysis.
Mind mapping software is available for Windows and Apple computers.
The nature and degree of uncertainty about a mind map depend on the knowledge of the team or individual.
Fairly simple and straightforward technique. Large maps can be complex.
21.3.24 Management oversight and risk tree (MORT)
The MORT chart was developed by Johnson (1973) as part of a contract to aid investigations into events in the nuclear power industry in the USA. The original version is available (NRI, 2002) and has been revised to update the language (NRI, 2009a). A full user manual is available from the NRI website.
An important phrase in the MORT system is “less than adequate” – abbreviated to LTA. Part of a system is adequate if it meets its intended goal. If it is less than adequate remedial action may be required.
The full chart should be printed at A1 size to enable reading. The top of the chart is shown in Figure 86 and extracts have been used elsewhere in this book. The chart and manual can be used for investigation of events or to help check that a management system covers all key features.
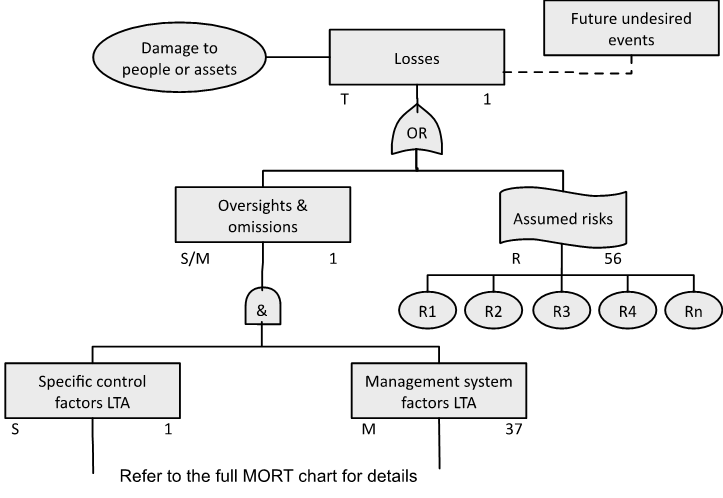
Source: Reproduced with permission from NRI (2009a). For use with the Management Oversight and Risk Tree analytical logic diagram.
21.3.25 Nertney Wheel
The Nertney Wheel (Nertney, 1987) represents people, equipment and procedures and the interfaces between each. It can be used to aid development of a management of change system, design of a new system or restarting an existing system. Start by identifying the objectives of the system and then use the following process map to walk you through use of the Nertney Wheel.
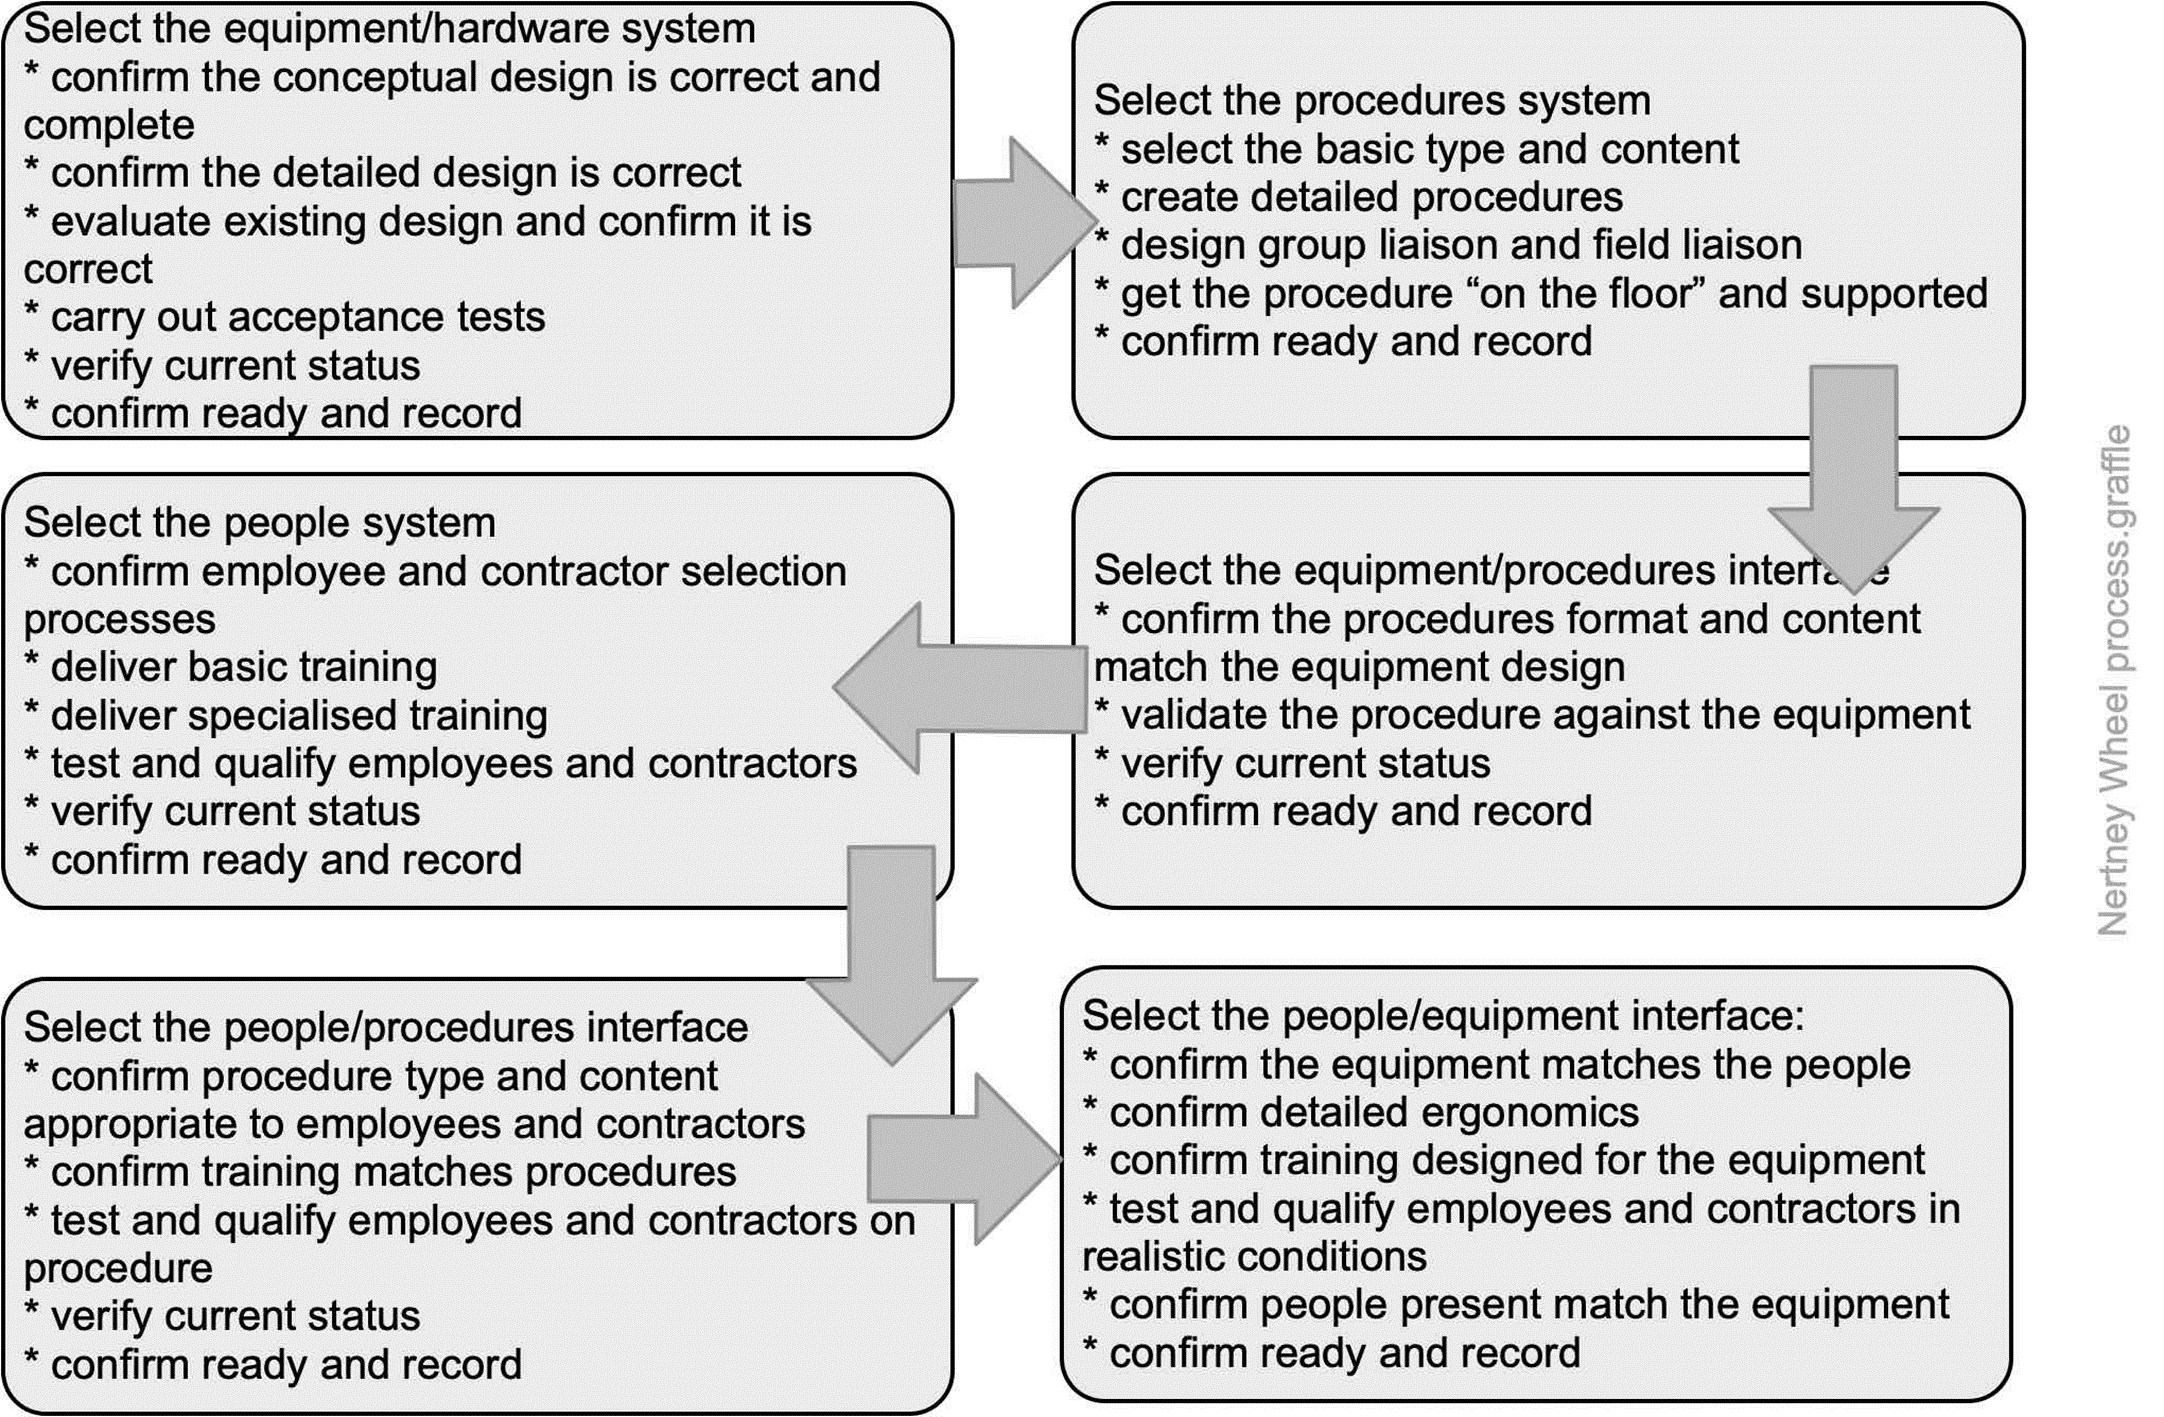
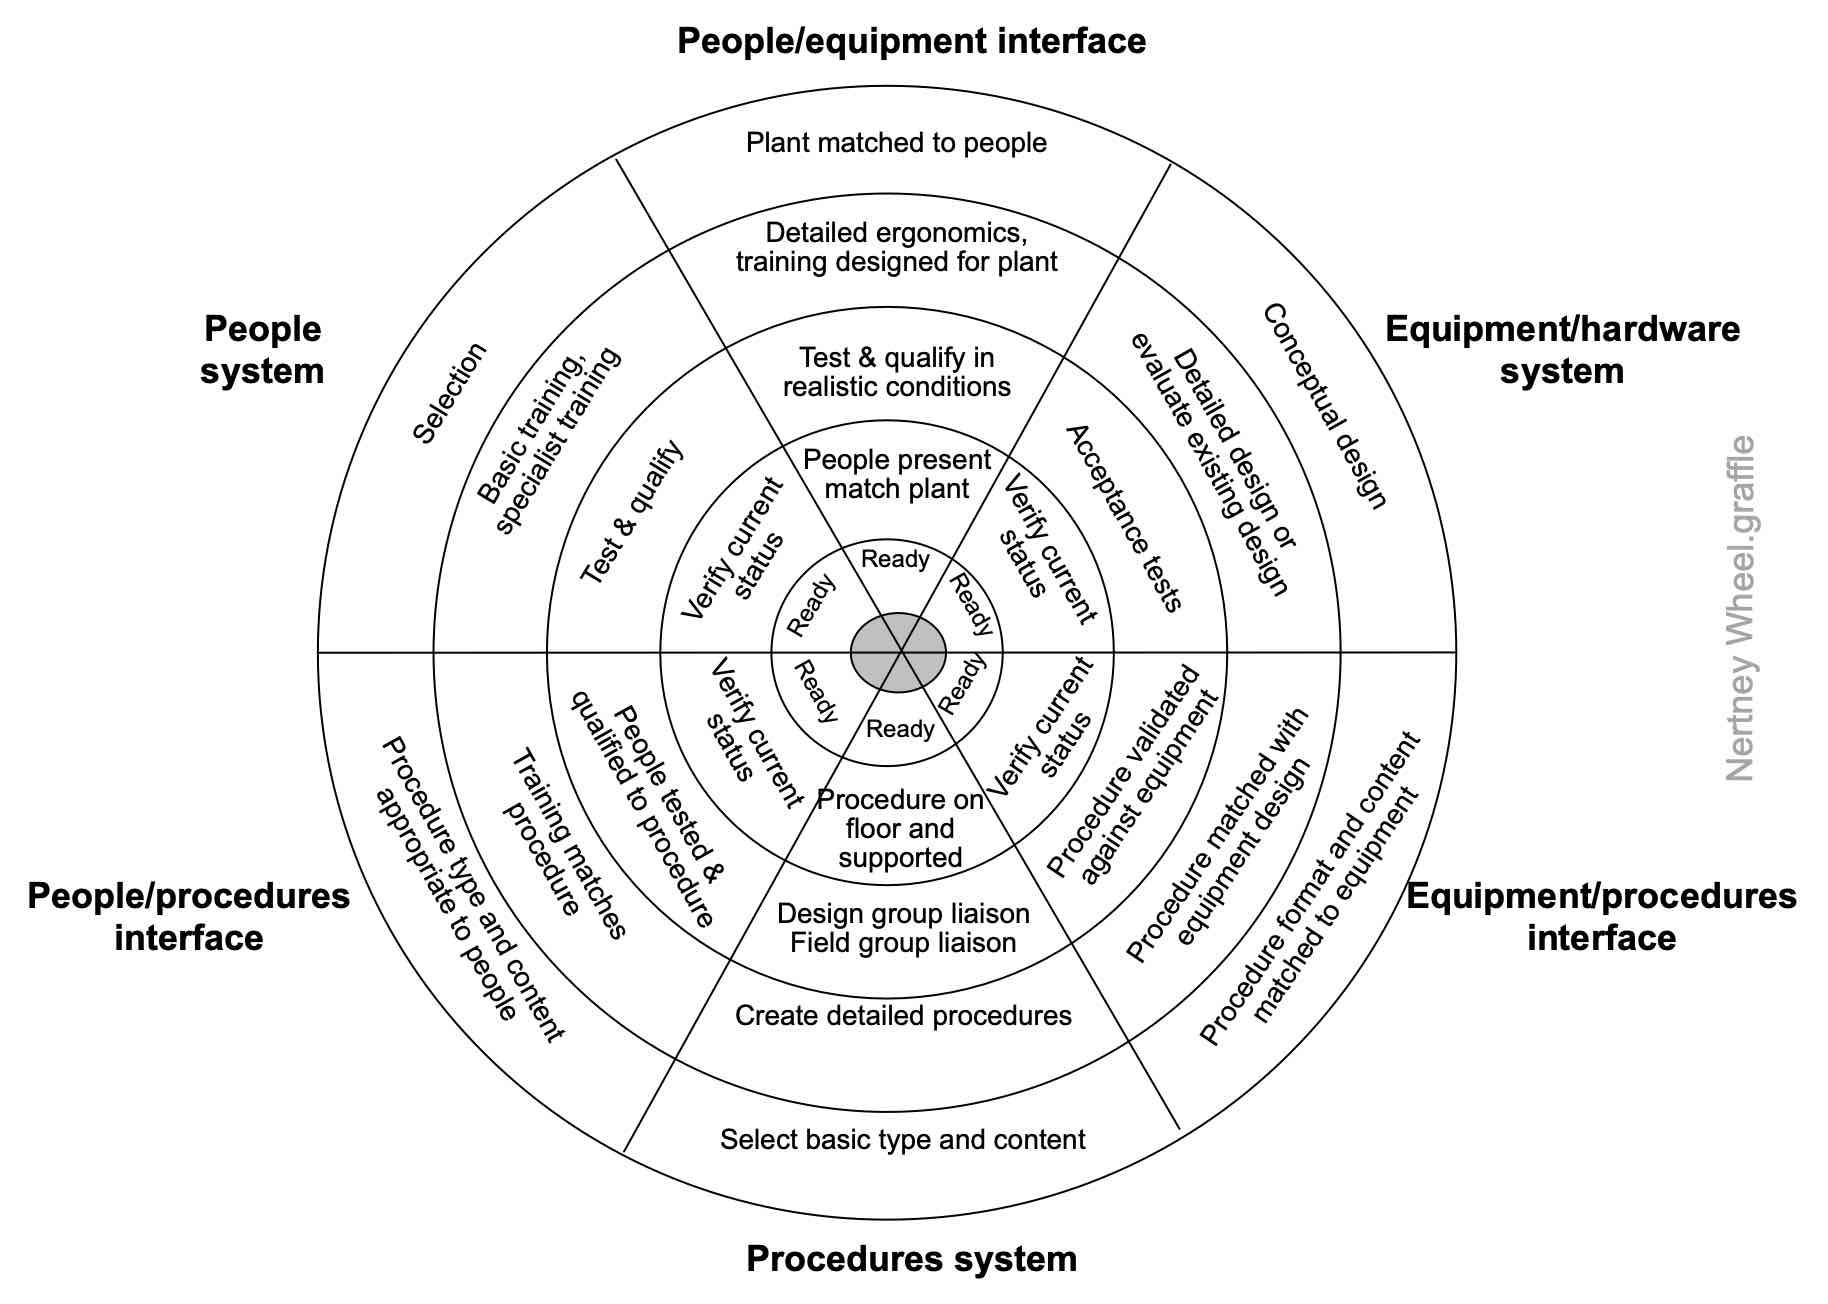
Source: Reproduced with permission from Frei et al. (2014)
21.3.26 Organisation charts (org charts)
An organisation chart (often an org chart) is “a chart illustrating the structure of an organisation; in particular it will show for which function of the business each manager is responsible and the chain of responsibility throughout the organisation. Some organisation charts include managers by name; others show the management positions in the structure” (https://www.oxfordreference.com/).
An organisation chart can be very useful in quickly understanding the structure of a PCBU and accountabilities. However, it does not show the informal structures or who may have deep knowledge of systems or high influence. These may sometimes be of considerable importance. Questions such as “Who else should I ask about that” or ”Who has been here for a long time” may reveal sources of institutional knowledge that should be investigated or explain why something appears to be illogical.
21.3.27 PESTLE analysis
- What are the objectives of the organisation, activity, system, or item?
- What is the nature and level of uncertainty that could affect achievement of those objectives?
- Cross reference to clause 4.1 in management system standards.
PESTLE is an acronym for Political, Economic, Social, Technological, Legal and Environmental. It is sometimes abbreviated to PEST (Proctor, 2019). The general PESTLE analysis method is shown in Figure 89, and a generic PESTLE matrix is in Source: Author 2004-2025
Table 46. PESTLE is best used in a facilitated workshop as a way of identifying factors in the external context but can also be used to identify risks, controls, and treatment options.
If the workshop group is not representative of the whole organisation or stakeholders, it may deliver unbalanced, inaccurate, or incomplete information.
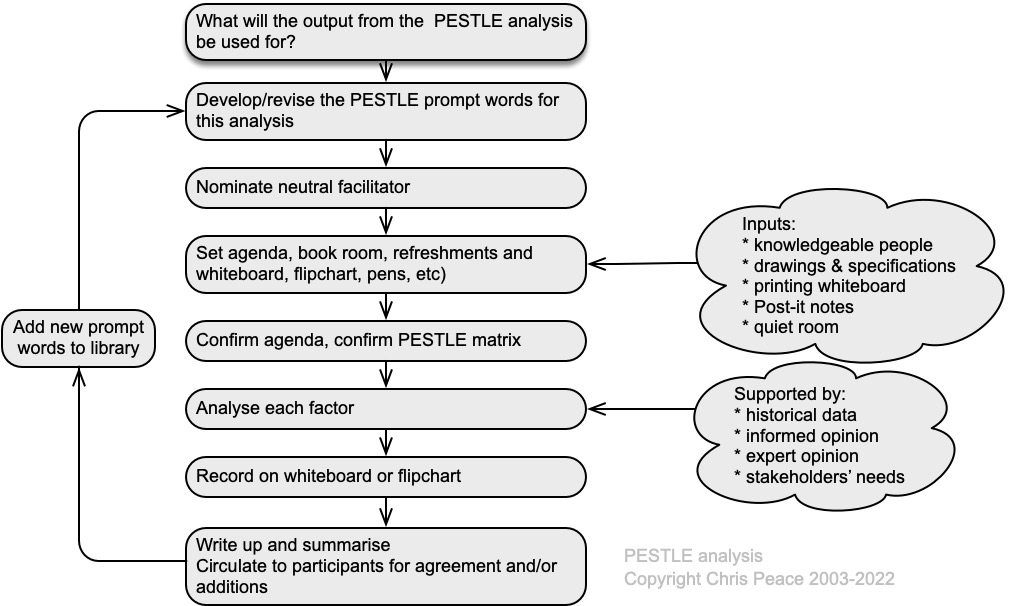
Table 46. Examples of a few PESTLE prompt words
| Political | Economic | Social | Technological | Legal | Environmental |
| Change in local political climate | Economic growth ±ve | Demographic changes | Development of disruptive processes, products, or services | Government legislation | Climate change |
| Change in offshore political climate | Trade agreements | Immigration or emigration | Outsourcing services | Sector or organisation codes | Demand for clean energy |
| Changes in government policies | Barriers to entry or exit | Aging population | Internet of things | Employment laws | Driverless vehicles |
| Brexit or similar | Technology incentives or changes | Education (skilled v unskilled; apprentice schemes; etc) | Smart phones & Apps | Changes in regulatory agencies | Environmental regulations |
| Foreign customers or suppliers | Competitive environment | Pike River, Grenfell Tower, or similar disaster | Shipping containers and transport | Rate of technological change | International treaties |
21.3.28 Porter’s Five Forces
- What are the objectives of the organisation, activity, system, or item?
- What is the nature and level of uncertainty that could affect achievement of those objectives?
- Cross reference to clauses 4.1, 6.1 and 6.2 in management system standards.
Origins
Michael Porter developed his “Five Forces Model” (Porter, 1985, 2008) to show how industry structure and competition is shaped. The model is largely self-explanatory and can be used to help understand the business environment of a business or undertaking, including areas of uncertainty and how they affect objectives. The five forces differ between industries and over time but can be used to help anticipate how changes may result in emerging risks.
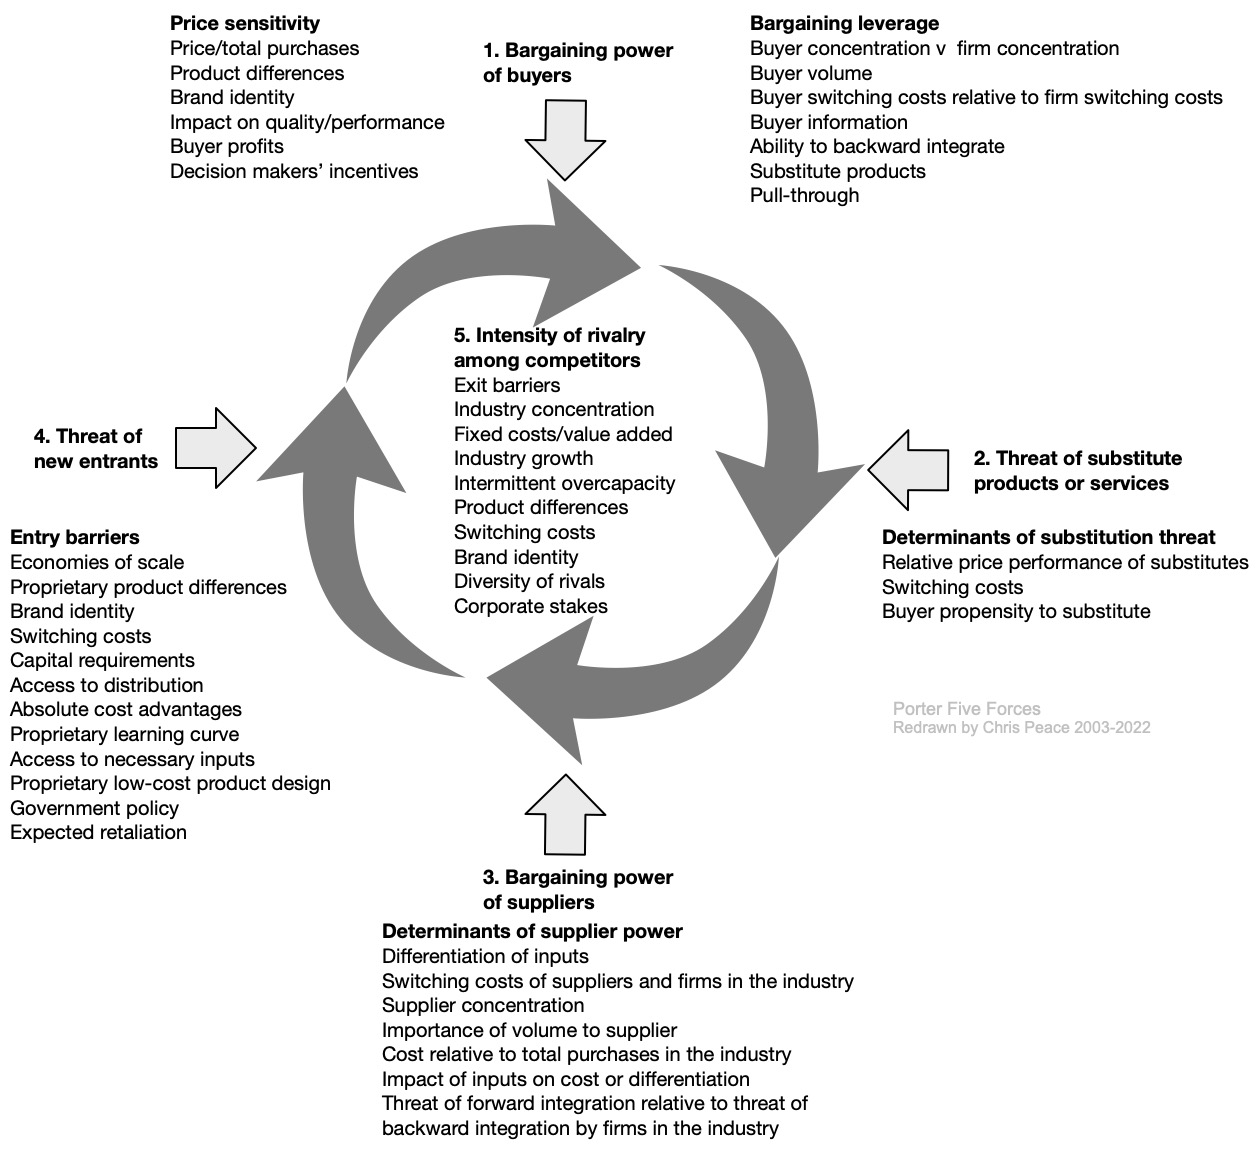
Source: Reproduced from Porter (1985, 2008)
21.3.29 Porter’s Value Chain
- What are the objectives of the PCBU, activity, system, subsystem, unit, or part?
- What is the nature and level of uncertainty that could affect achievement of those objectives?
- Specifically, what uncertainties in the external and internal supply chains affect objectives?
Origins
Michael Porter, an American academic, argued that every organisation “is a collection of activities that are performed to design, produce, market, deliver, and support its product” or services (Porter, 1985). He developed the following generic value chain analysis (adapted here to include “complementary processes or activities” taken from ISO9001) to illustrate how these might be brought together but emphasised that the precise form would depend on the context of the organisation (eg, its history, market sector, competitors, strategy, culture, stakeholders) and the underlying economics of the activities themselves.
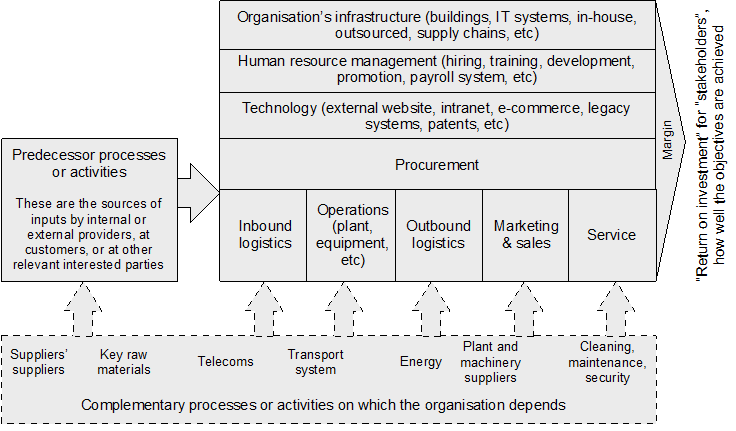
Source: Adapted from Porter (1985) and ISO9001 (2015)
Not all the components shown in the generic diagram will be present in every organisation and, in some organisations, there may be other components, or the labels may be different. However, the concept can be used to describe and analyse relationships within an organisation and its supply chain.
This is another way of discovering uncertainty about supply chain relationships and the performance of each component of an organisation. For example, a change by the supplier of a supplier can result in OHS-related effects for workers in a PCBU in the transport system or the cleaning contractors.
21.3.30 Preliminary hazard analysis
- What are the objectives of the organisation, activity, system, or item?
- What is the nature and level of uncertainty that could affect achievement of those objectives?
- Cross reference to clauses 6.1 and 8 in management system standards.
Description
Preliminary hazard analysis (PHA) is a simple technique used to help identify the hazards, hazardous situations, causal factors or events that might damage, harm or disrupt an activity, facility or system (Aven, 2008; Stewart & Melchers, 1997, pp. 44-46).
PHA can be used when there is limited information (eg, early in a project) but does not provide detailed information. It can be used before designing a new system, to help identify performance-shaping or human factors.
The general PHA process is summarised in the following process map.
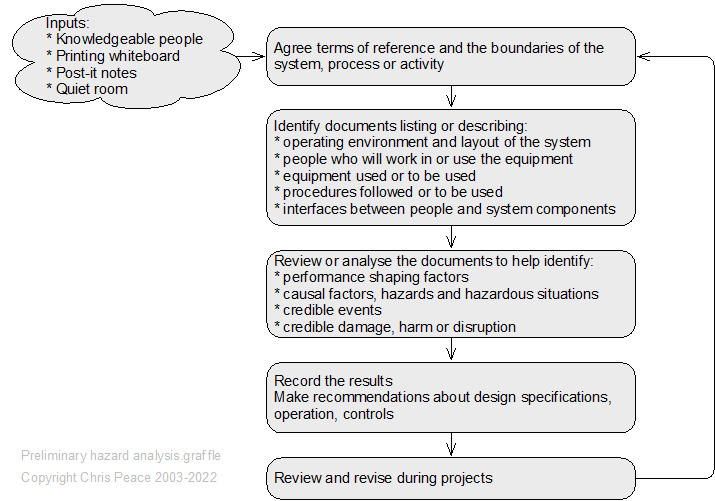
21.3.31 Probability and likelihood analysis
- What are the objectives of the activity, system, subsystem, unit, or part?
- What is the nature and level of uncertainty that could affect achievement of those objectives?
Key definitions
Risk is often expressed in terms of a combination of the consequences of an event (including changes in circumstances) and the associated likelihood of occurrence (ISO31073, 2022).
Likelihood is defined as the “chance of something happening” with the following notes (ISO31073, 2022).
Note 1. In risk management terminology, the word “likelihood” is used to refer to the chance of something happening, whether defined, measured or determined objectively or subjectively, qualitatively or quantitatively, and described using general terms or mathematically (such as a probability or frequency over a given time period).
Note 2. The English term “likelihood” does not have a direct equivalent in some languages; instead, the equivalent of the term “probability” is often used. However, in English, “probability” is often narrowly interpreted as a mathematical term. Therefore, in risk management terminology, “likelihood” is used with the intent that it should have the same broad interpretation as the term “probability” has in many languages other than English.
Uncertainty is the “state, even partial, of deficiency of information related to, understanding or knowledge”(ISO31073, 2022).
Estimate: “an approximate calculation or judgement. A written statement indicating the likely price that will be charged for specified work. A judgement or appraisal” (Oxford English Dictionary).
Likelihood in practice
In the following table the likelihood scale is open to interpretation. What do the words mean to you, to workers, to decision makers? Each person may use a different meaning, making any risk analysis dependent on each reader’s interpretation.
Instead, we should use probability scales. Probability scale 1 in the table is expressed in percentages. For example, “there is a 66%-90% chance that this consequence will be felt in the next year” gives a time scale (as per the last sentence in note 1 above). A range might be made a bit more precise if we have sufficient data to make it, for example, “75% ± 5%” but it remains an estimate.
Probability scale 2 looks more certain, more scientific. Its meaning is shown in the right-hand column, where we should also define the time period in which the likelihood of the consequence may be felt and give an idea of the range of probabilities. Despite its “scientific” appearance it remains an estimate.
Table 47. Likelihood and probability scales
| Likelihood scale | Probability scale 1 | Probability scale 2 | Meaning |
| Virtually certain | >99% | 10-3 | 1 in 1,000 |
| Very likely | >90% | 10-4 | 1 in 10,000 |
| Likely | >66% | 10-5 | 1 in 100,000 |
| About as likely as not | 33 to 66% | ||
| Very unlikely | 33% | 10-6 | 1 in 1,000,000 |
| Exceptionally unlikely | <1% | 10-7 | 1 in 10,000,000 |
Work done by the Intergovernmental Panel on Climate Change (IPCC)
For the Intergovernmental Panel on Climate Change (Alley et al., 2005), “likelihood refers to a probabilistic assessment of some well-defined outcome having occurred or occurring in the future”. The IPCC categories suggested in Figure 93 should be considered as having ‘fuzzy’ boundaries. “Likelihood may be based on quantitative analysis or an elicitation of expert views. The central range of this scale should not be used to express a lack of knowledge – see the article for that situation.”
“There is evidence that readers may adjust their interpretation of this likelihood language according to the magnitude of perceived potential consequences.” In other words, a reader might change the assessed consequences or probability if the results are politically unacceptable.
As drawn here, Figure 93 has fuzzy boundaries to reflect uncertainty in the climate and, for workplaces, the variabilities that occur every day.
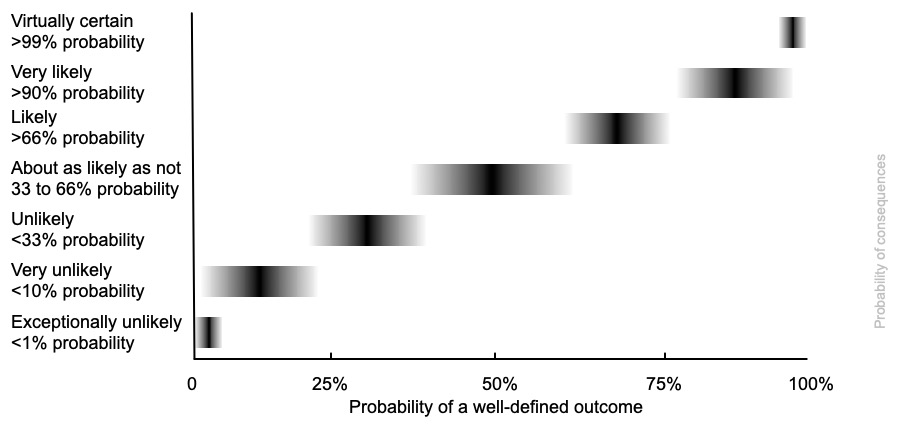
Source: Adapted by author from Alley et al. (2005)
Warning!
Beware making estimates of likelihood or probability too certain or too tidy. Your estimates are precisely that: an estimate of some possible future state, something we cannot know with any certainty.
21.3.32 Questionnaires and online surveys
A questionnaire may be self-administered or interviewer-administered, paper-based or electronic (Saunders et al., 2019, pp. 502-542). Choices will be influenced by:
- characteristics of the respondents from whom you wish to collect data
- importance of reaching a particular group
- importance of respondents’ answers not being contaminated or distorted
- size of sample required for analysis, taking account of the likely response rate (10% is good)
- types of questions needed to gather data
- number of questions needed to collect data (10 is generally the maximum).
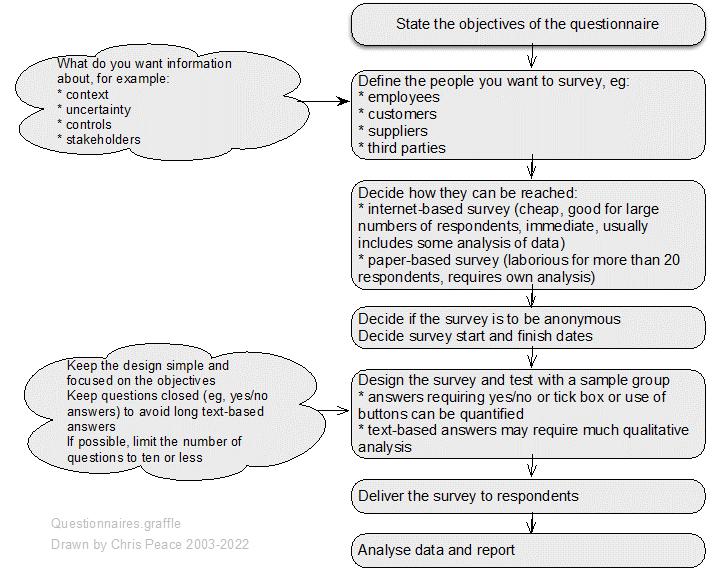
21.3.33 Risk breakdown structure
- What are the objectives of the organisation, activity, system, or item?
- What is the nature and level of uncertainty that could affect achievement of those objectives?
- Cross-reference to clauses 6.1 and 8.1 in ISO45001 and some other standards.
Type of method
Risk breakdown structure (RBS) is a hierarchical framework presenting known risks, controls and treatments (Hillson, 2002; Rasool et al., 2012). It is often used in project management to help structure risk identification and qualitative risk analysis, often as part of project risk management. A generic RBS can be developed for recurring activities (eg, routine projects) or a specific RBS may be developed for a one-off activity.
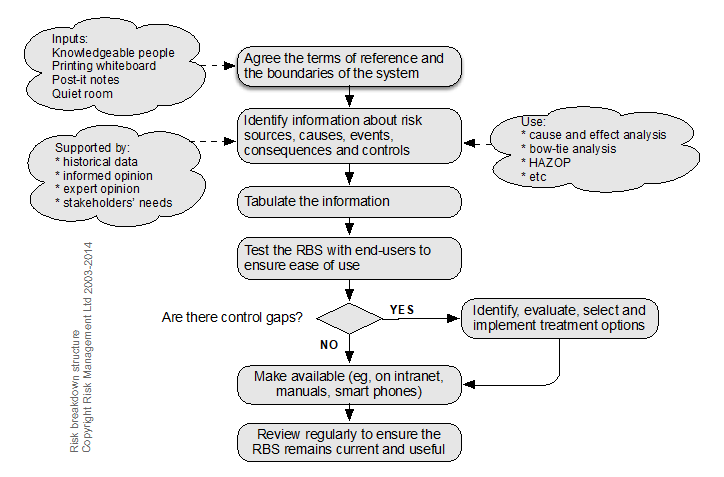
Nature and degree of uncertainty
RBS will help with identification of known risks, controls, and treatment options (ie, circumstances where there is low uncertainty) but may have little value for more dynamic circumstances.
RBS captures known institutional knowledge and experience.
Moderately complex to develop but low complexity to use.
Using RBS
Once developed, an RBS is used by looking up the relevant information in the left-hand column and reading to the right to find the required controls or treatments.
A simple RBS table follows.
Table 48. Example – an extract from an RBS for fire in a high-hazard site
| Facility/event | Cause/comments | Possible consequences | Controls required |
| Petroleum tank fire | Static electricity build-up and spark due to fast filling | Tank roof may fail | Pressure valves checked before fill/discharge |
| If not controlled or extinguished may involve other tanks in the same compound | Foam injection system in class 3(a) tanks | ||
| Water cooling system on each tank | |||
| Pressure vent valve fails, tank roof collapse and ignition | If not controlled or extinguished may involve other tanks in the same compound | Foam injection system in class 3(a) tanks | |
| Water cooling system on each tank |
21.3.34 Risk register or database
A risk register is a “record of information about identified risks” (ISO Guide 73, 2009). Sources of further information include: (Ackermann et al., 2007; BOMEL Ltd, 2005a; Huber, 2011; Pergler, 2012).
Description
A risk register can take many forms. It may be:
- dynamic (ie, updated regularly) or static (ie, historical interest)
- paper-based or electronic
- for business-as-usual activities, projects generally or for a specific project
- “owned” by one person or accessible and usable by many people.
Resources and capability
Inputs
An agreed format of paper-based register or risk record sheets and, possibly, an electronic database.
Method
Information about identified risks is recorded on paper forms or direct into the risk register.
Outputs
A paper-based register or electronic database giving information about identified risks.
Semi-quantitative analysis may be possible if the risk register is electronic. It is common to sort, filter and analyse risks in a variety of ways.
Nature and degree of uncertainty
The adage of GIGO (“garbage in, garbage out”) is true for any risk register. Handwritten record sheets may be illegible or read incorrectly and both paper and electronic records may be incomplete. If data is not regularly updated, cleaned, and validated it becomes of uncertain value.
Strengths and limitations
Proprietary electronic risk registers may link with one or more risk analysis tools such as the consequence/likelihood matrix, bow tie analysis, business impact analysis, failure mode and effect analysis and hazard analysis and critical control point analysis. A well-designed risk register may incorporate a hierarchical risk taxonomy to facilitate sorting, filtering, and analysis.
They do not necessarily link risks that could eventuate at the same time.
Complexity
A risk register can be as complex as the designer and users wish. Some of the most complex electronic databases require training and time to learn. A paper-based or simple electronic file can keep much information more accessibly but take time to maintain.
Table 49. A possible risk register template
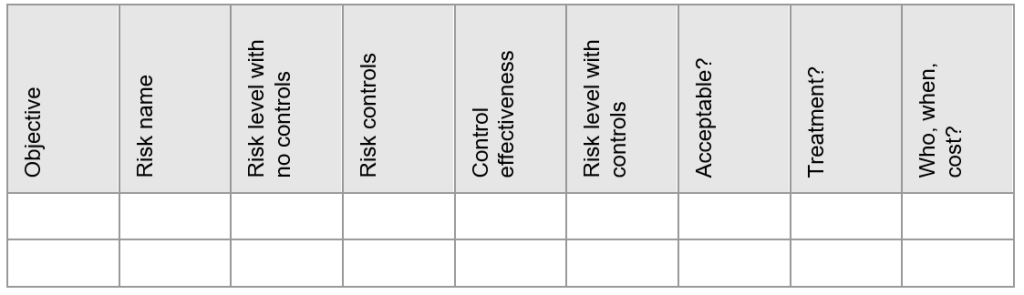
21.3.35 Risk sensing
- What are the objectives of the organisation, activity, system, or item?
- What is the nature and level of uncertainty that could affect achievement of those objectives?
- Cross reference to clauses 6.1 and 7.3 in management system standards.
Risk sensing is more a way of thinking than a risk technique (Day & Schoemaker, 2004; Klein et al., 2019). It involves a state of “healthy paranoia” where an organisation sets up ways of sensing what might be changing or what might change in the future that could threaten current business objectives. The following mind map summarises some of the ways this might be done.
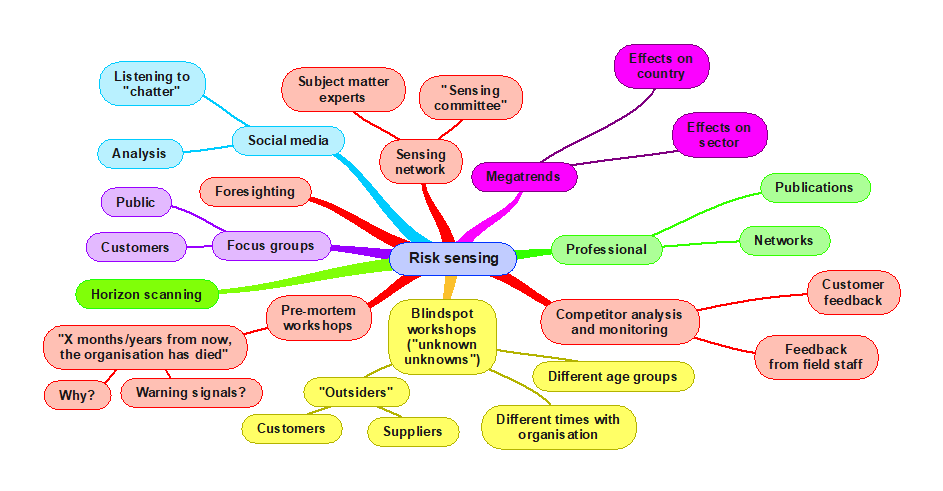
The sensing network can include subject matter experts or a “sensing committee” who meet quarterly to discuss risk and share knowledge.
A person or group monitors megatrends that could affect the country or sector and reports what is evolving to executive management.
Professional networks and publications are mined for issues affecting other organisations.
Competitor analysis using feedback from field staff or customers can show imminent disruptive changes in products or services.
Blind spot workshops engage outsiders (customers, suppliers, etc) or employees who have been with the organisation for differing times to talk about the unknown knowns and unknown unknowns. This is a brainstorming session where all comments are accepted for subsequent analysis.
Pre-mortem workshops posit that at some future point a major adverse event has occurred or a project has failed, or the organisation has “died”. Workshop participants are asked “in the next five minutes write down why that could happen and what warning signals might be expected”. Their notes are then discussed, possibly showing further possible causes.
Social media can give advance warning of a change in consumer tastes, expectations, or tolerance. Such “chatter” can be analysed to suggest trends.
Formal focus groups with customers or the public can give a more structured warning of trends.
21.3.36 Risk velocity
- What are the objectives of the activity, system, subsystem, unit, or part?
- What is the nature and level of uncertainty that could affect achievement of those objectives?
The speed with which a risk might eventuate can be extremely important (Davis & Lukomnik, 2010; Tattam & Esteban, 2013). When considering risk velocity, take account of the detection and response time from initiation to the key event and from the key event to impact on objectives.
The detection time tells us how quickly a risk might eventuate and how much warning an organisation will have. The response time tells us how quickly an organisation may have to react to the initiating event, event, or consequences. If the risk is analysed as having a high level of risk with short detection and response times, contingency planning must be based on high levels of agility and fast responses. Conversely, slow, or very slow developing risks might be managed via business-as-usual controls. Account must also be taken of risk interactions and synergistic effects. These can be identified using risk interaction mapping.
The following table suggests one way of analysing risk velocity. Before using it in your organisation, check the suggested time scale is relevant and acceptable to the risk owners. For example, an airline might analyse failure of the online checking-in system and decide one second should be rated as “very fast”.
Table 50. Speed of onset or velocity
| Rating | Descriptor | Definitions | Examples of causes and consequences |
| 1 | Very slow | Very slow onset and build up to the event; consequences are very slow to impact on objectives
Total time to impact more than one year This may be better described as a change in specific circumstances |
Occupational disease such as asbestosis (can be 20-30 years)
Changes in reinsurance markets in response to a major damaging earthquake Obsolete IT hardware or legacy software degrades operations Latent defect in plant or equipment Change in customer preferences |
| 2 | Slow | Slow onset and build to the event, consequences are slow
Total time to impact several months This may also be a change in specific circumstances |
Occupational ill-health such as stress or repetitive strain injuries
Changes in insurance markets in response to a major damaging fire or other loss Loss of major customer |
| 3 | Moderate | Time from initiating event to event and then impact of consequences on objectives is quick
Total time a few weeks or months |
Earthquake damage to critical suppliers in another country
Failure of a supplier of low importance Change in commodity prices |
| 4 | Fast | Time from initiating event to event and then impact of consequences on objectives is quite fast
Total time to impact a few days or a week or so |
Failure of critical just-in-time supplier
Website outage or loss of email Major outage of fuel oil deliveries |
| 5 | Very fast | Little or no warning – the initiating cause(s) occurred and triggered the main event, consequences impact on objectives very quickly
Total time to impact a day or less, maybe hours or minutes |
Trauma to employee operating an unguarded machine
Earthquake damage to own infrastructure in an earthquake prone region, a major fire in own premises Failure of critical IT system disrupts operations Major outage of gas or electricity supply |
21.3.37 Scenario analysis
Introduction
Risk is the “effect of uncertainty on objectives”. Organisations should have as part of their objectives “Value creation and protection” ((ISO31000, 2018, pp. 2-4)). Value may be financial, reputational, etc. Certainty about what the future holds and how it might affect the creation or protection of value is not possible and the further we look into the future the more we are just guessing. Strategic planners may try to plan for a certain future, only to have a different future upset their plans [1].
Strategic planning does not deal with future decisions. It deals with the futurity of present decisions. Decisions exist only in the present. The question that faces the strategic decision-maker is not what his organization should do tomorrow. It is, “What do we have to do today to be ready for an uncertain tomorrow?” The question is not what will happen in the future. It is, “What futurity do we have to build into our present thinking and doing, what time spans do we have to consider, and how do we use this information to make a rational decision now?
Decision-making is a time machine which synchronizes into one present a great number of divergent time spans. We are only learning this now. Our approach still tends toward making plans for something we will decide to do in the future, which may be entertaining but is futile. We can make decisions only in the present and yet we cannot make decisions for the present alone; the most expedient, most opportunistic decision – let alone the decision not to decide at all – may commit us for a long time, if not permanently and irrevocably”.
(Drucker, 1973, p. 125)
Making major strategy-related decisions is done in the present but must include thought for the future. Such decisions should include consideration of the OHS of workers employed or controlled by a PCBU.
Table 54 summarises the top 12 concerns of senior managers in a relatively simple survey carried out by Mitchell (2008). Were those concerns real issues?[2] Do those concerns have high uncertainty? Have any eventuated and with what consequences? What would your PCBU have done with this information in 2008? Would it have made a difference to the current conditions you are operating in?
[1] As happened in the 2020 COVID-19 pandemic.
[2] An issue is an “important topic for debate or resolution”
Table 51. A medium-term study
| A 2008 study by The Economist Intelligence Unit surveyed 600 senior executives from companies of a variety of sizes, and from a wide range of industries around the world and included 200 chief executive officers. Three-quarters of respondents were C-level, or board-level. For the decade to 2018 the respondents identified as their top 12 major risk concerns: | |
|
|
In this survey, 26% of respondents said they use scenario planning on a regular basis and 41% said that they use it on an ad hoc basis. Out of the remainder, 29% said they had plans to use the technique in the future. Just under half of those surveyed who currently use scenario planning (42%) said they apply the lessons they learn from the process to their strategic planning. Mitchell found that perhaps as many as 50% of senior managers consider a 3–5-year time horizon; about 15% look 5-10 years into the future; and about 3% look more than 10 years ahead.
Type of method
Scenario building and analysis is a widely-used qualitative technique using plausible futures to help consider what might be and to test the current adaptability of the organisation (Alcamo, 2001; Brown, D., 2007; IEC/ISO31010, 2019; Mitchell, 2008; Proctor, 2019).
Scenarios are usually built as sets of scenarios, using information available now to describe a plausible future. that information might be derived from the use of foresight methodologies (Conway, 2008). They are not forecasts or predictions but are used as a way of testing current thinking, organisational structures, products, services, or other attributes of organisations.
Each scenario is a story about a possible future that helps us think ahead, make plans now for what the future might hold, commit resources to those future expectations and monitor how changes are occurring. Each identifies the potential aggregated effect of multiple uncertain events taking account of known business-as-usual activities and projects. They can also be used to estimate how near-future events might cause knock-on consequences.
Scenarios can be developed for the “investment period + 1” to try to anticipate ways the decisions might play out. For example, a PCBU need to invest in new technology that requires a plan for recruitment, training, and retention of specific worker competencies over a three-year period.
Scenario development
Scenario analysis requires:
- one or more questions about strategy, investment, or the future
- the current understanding of the context of the organisation
- people with time to commit to the project
- research resources
- support from a facilitator or consultancy with relevant skills or, in a very large organisation, a specialist team.
Many methods exist but outputs and uses are applied similarly in each method.
Scenario writing
Proctor (2009, pp. 199-200) described “Scenario Writing” as having three stages:
- initial briefing on the issues and questions to be addressed, methodology to be followed, need for evidence and what the impacts of the scenarios on the organisation might be
- individual scenario writing over a two-week period, done independently by each team member
- collective scenario writing where the writers meet, listen to each scenario, discuss, and reach a consensus leading to a report.
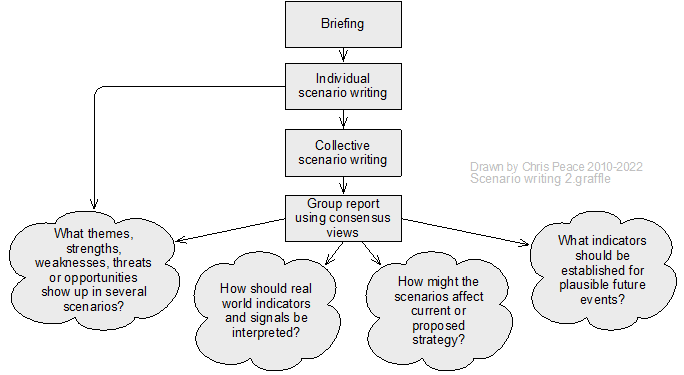
Shell international model
Shell International is credited as one of the most prominent users of scenario analysis (Alcamo, 2001; Schwartz, 1996; Shell International Ltd, 2003); its scenario building model is summarised in Figure 98 and the method description follows the graphic.
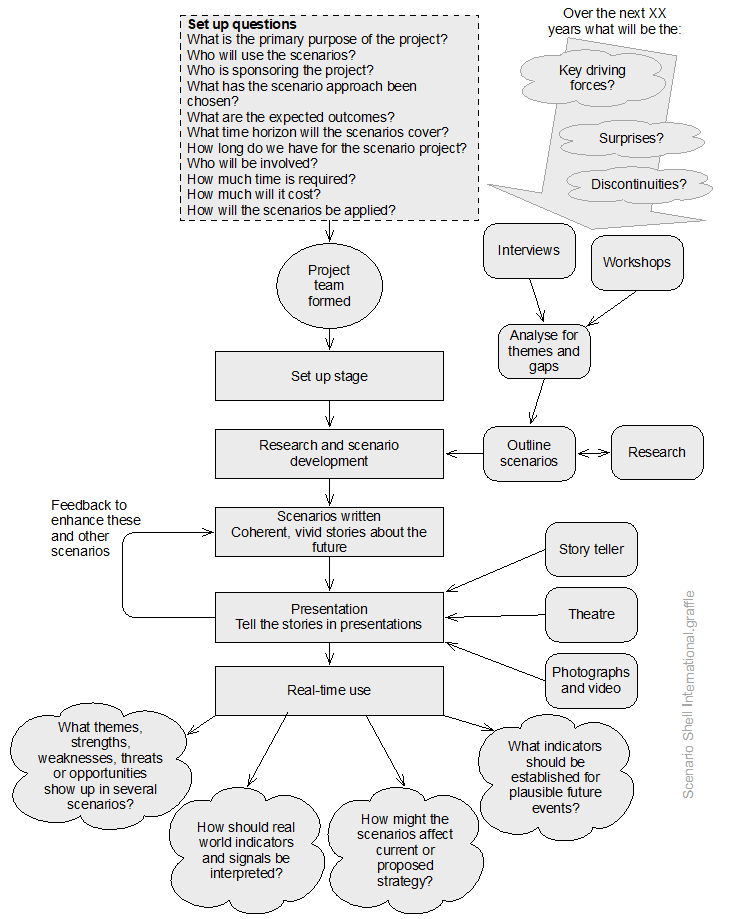
Source: Author using data adapted from Shell International Ltd (2003)
Shell is a very large multi-national with long lead times for investments and its use of scenario analysis is relative to those investments and timescales. Note: one scenario project may generate several scenarios. Initial research is by interviews of internal and external stakeholders who are asked about key driving forces, possible surprises, and plausible discontinuities over the period of interest. If you do this in interviews or workshops, consider using PESTLE analysis or Porter’s Five Forces as a way of guiding conversations. The results are summarised and taken to one or more workshops to identify common themes and gaps in knowledge. Research needs are identified and met, and outline scenarios are developed.
Following any further research or workshops, full scenarios are written to tell coherent, vivid stories about the future. The scenarios are presented to users and made more compelling using a storyteller, simple theatre, photographs, or video. Feedback from users may be used to revise the scenarios. The scenarios then are used in real-time to aid decision-making.
Outputs from scenarios
Scenarios can be used to answer questions such as:
- What themes, strengths, weaknesses, threats or opportunities show up in several scenarios?
- How should we interpret real world indicators and signals?
- How might the scenarios affect strategy?
- What indicators should be established for plausible future events?
Other questions or uses may be developed by an organisation.
Nature and degree of uncertainty and complexity
Uncertainties exist about data from outside the organisation. Uncertainties grow as researchers and scenario-builders consider the future. These must be made clear in the final scenarios or report, and it must be noted that scenarios are not forecasts or predictions.
Scenario analysis is not complex but is time-consuming. It may use sensitive data and the outcomes may become confidential.
Example
The British HSE commissioned a scenario analysis imagining the future of OHS (Schultz, W., 2007). The report set out possible futures for 2017. How many have eventuated?
21.3.38 SWIFT (Structured-What-If-Then)
- What are the objectives of the organisation, activity, system, or item?
- What is the nature and level of uncertainty that could affect achievement of those objectives?
- Cross reference to clause 6.1 and 8 in management system standards.
Description
Structured what-if-then (SWIFT) is a workshop-based method for identifying some sources of uncertainty and their effects (Aven, 2008; Card et al., 2012; IEC/ISO31010, 2019; Leathley, 2017; Turney & Pitblado, 1996).
Example questions
- What if the power supply to our IT centre failed for X hours/days?
- What if our key supplier failed today?
- Has anyone ever heard of a town’s water supply being contaminated?
- Could someone hack our email server?
- What if a key transport route was blocked for 12 months?
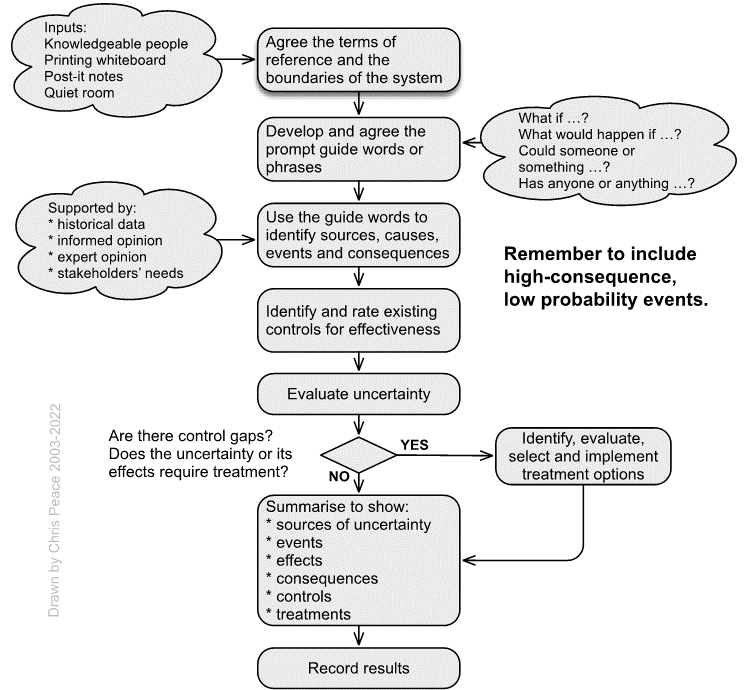
21.3.39 SWOT (strengths, weaknesses, opportunities, and threats) analysis
- What are the high-level objectives of the organisation, activity, system, or item?
- What is the nature and level of uncertainty that could affect achievement of those objectives?
- Cross reference to clauses 4.1, 6.2 and 8 in management system standards.
Description
SWOT is a structured workshop or interview technique often used to aid identification of factors in the internal context (Proctor, 2019). It can also be used to identify risks with positive and negative consequences and can provide considerable information about the environment an organisation is operating in or proposes to enter. Figure 100 sets out a generic SWOT analysis process and some possible topics.
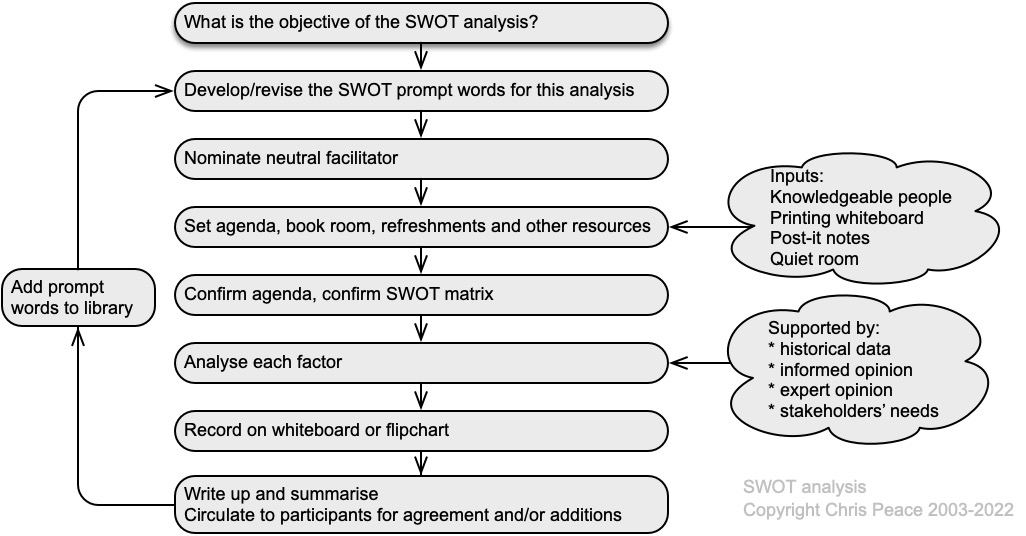
| Possible topics | |||||
| • Governance, organisation structure, roles, and accountabilities • Organisation culture |
• Policies, objectives, and the strategies that are in place to achieve them | • The capabilities, understood in terms of resources and knowledge (eg, capital, time, people, processes, systems, and technologies) | • Perceptions and values of stakeholders • Standards, guidelines, and models adopted by the organisation |
• Perceptions and values of stakeholders • Form and extent of contractual relationships |
• Relationships with, and perceptions and values of, internal stakeholders |
Complexity
Simple and easily used but it is easy to miss key information. Some users over-simplify the data for decision-making. Access to good information can be time-consuming and difficult (especially for sensitive information). Needs regular updating with people having different perspectives.
| Strengths | Weaknesses | Opportunities | Threats |
| Governance | Change of government policy | ||
| Industry buy-in | |||
21.3.40 Workshops
Workshops as a source of OHS-related information are a structured, large-group conversation about future uncertainties intended to enable efficient sharing of data and experiences that may also enable team building and continuous improvement (Niven, 2014, pp. 129-157; Quail, 2010, pp. 159-170). Participants should include subject matter experts for what is being discussed, supported by people who are assessment experts and others who have relevant knowledge. Techniques that can be used to structure a workshop include failure modes and effects analysis (FMEA); failure modes, effects, and criticality analysis (FMECA); hazard and operability study (HAZOP); and hazard analysis and critical control points (HACCP).
Workshop planning
Follow the process map below and use or develop your own checklist such as the one on the next page.
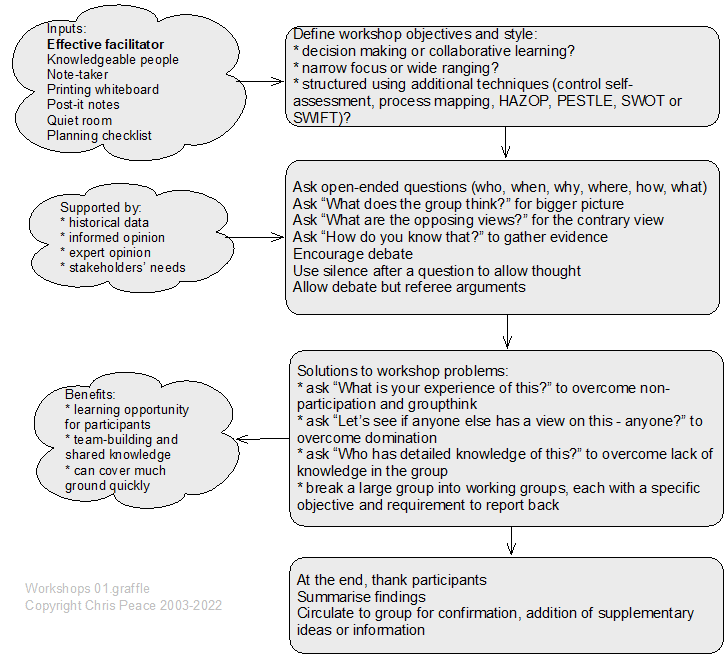
Table 53. Draft workshop planning checklist
| Planning and execution stage | Step | Notes |
| Workshop preparation | Workshop sponsor identified | |
| Set clear workshop objectives | ||
| Scope set based on organisation objectives | Time horizon: this year, next two years, next X years | |
| Reference materials assembled and distributed? | Example: risk criteria for consequence, likelihood, severity, acceptance; risk appetite | |
| Agenda set | Include time for breaks and refreshments | |
| Agenda approved by sponsor | ||
| Attendees or stakeholders determined | External or internal stakeholders?
Best group sizes are 6-20 people |
|
| Participants’ materials needed? | Flipcharts, risk canvas, paper, Post-it notes, pens | |
| Venue selection | Large enough capacity for attendees | |
| Room layout, seating | Groups, U-shaped seating (best for face-to-face contact, facilitator engagement and sharing materials), classroom (least good) | |
| Away from offices or workspaces | ||
| Catering | On arrival, morning tea, lunch, afternoon tea | |
| Equipment | Computer, projector, flipchart(s), whiteboard (printing?) | |
| Before the day | Circulate agenda, objectives, and reference materials | Two or three days before the workshop |
| Print extras copies for the workshop | ||
| On the day | Start on time | Remember to remain neutral |
| Housekeeping | Phones off, refreshment breaks defined, what to do “in an emergency” during the workshop | |
| Explain objectives of workshop | ||
| Set ground rules | No personal attacks or mocking | |
| Ask everyone to introduce themselves | Pair people, ask them to interview their “colleague” and discover their name, job title and something a little unusual about them. They then introduce their colleague. | |
| Explain any techniques | Examples: PESTLE, SWOT, process mapping, HAZOP, SWIFT | |
| Facilitate the workshop | For a large group have a note-taker | |
| Take a break every 45 minutes or so | Allow time for comfort stops and refreshments | |
| On completion | Thank attendees, tell them summary notes will be circulated within X days | Try to make sure everyone shares ownership of the workshop outcomes |
| After the workshop | Record the results and any feedback | Who is the note-taker or reporter? |
21.3.41 Treatment effectiveness and priorities
Treatments should be assessed for their effectiveness in modifying a risk and their urgency. Use the following table to help determine the effectiveness of proposed treatments. It is essentially the same as the generic risk control effectiveness rating table and must be revised for specific organisation and frameworks.
Table 54. Risk treatment effectiveness
| Descriptor | Suggested treatment effectiveness rating | Description of effectiveness of a treatment |
| Most satisfactory | ≤95% | The treatment is well designed for the uncertainty or its effects on objectives, address the root causes and management believes that they will be always effective and reliable. Nothing more to be done except review and monitor the treatment after it has been implemented |
| Satisfactory | 75-90% | The treatment is designed correctly and when in place will be effective. Some more work to be done to improve operating effectiveness, or management has some doubts about operational effectiveness and reliability |
| Reservations | 45-75% | While the design of the treatment may be largely correct in that it addresses most of the root causes of uncertainty or its effects on objectives, but it will not be very effective OR The treatment does not address root causes |
| Poor | 25-45% | The treatment will have significant control gaps because, either it does not address root causes, or does not operate at all effectively |
| Uncontrolled | < 25% | The treatment will give virtually no credible control. Management has no confidence that any degree of control will be achieved, due to poor control design and/or very limited operational effectiveness |
21.4 Chapter summary
This chapter provides outlines of some management techniques that may be useful when assessing uncertainty or its effect on objectives.
21.5 References used in this chapter
Ackermann, F., Eden, C., Williams, T., et al. (2007). Systemic risk assessment: a case study. Journal of the Operational Research Society, 58(1), 39-51. http://dx.doi.org/10.1057/palgrave.jors.2602105
Alcamo, J. (2001). Scenarios as tools for international environmental assessments [Environmental issue report 92-9167-402-8]. Office for Official Publications of the European Communities, Luxembourg. http://www.eea.europa.eu/
Alley, R., Berntsen, T., Bindoff, N., et al. (2005). Guidance Notes for Lead Authors of the IPCC Fourth Assessment Report on Addressing Uncertainties. World Meteorological Organisation, Geneva. http://www.ipcc.ch/pdf/assessment-report/ar4/wg1/ar4-uncertaintyguidancenote.pdf
Anon. (2011). Assurance Maps [Practice Advisory]. Institute of Internal Auditors, http://www.theiia.org
Anon. (2014, 23 August). Crude errors: How to make oil shipments safer. The Economist, 31. www.economist.com
Aven, T. (2008). Risk analysis: Assessing uncertainties beyond expected values and probabilities. John Wiley & Sons, Ltd.
BOMEL Ltd. (2005a). New perspectives on falls from height: identifying high profile areas for interventions [Research Report RR0356]. Health and Safety Executive, Buxton. https://www.hse.gov.uk/research/publish.htm
Bowen, G. A. (2009). Document Analysis as a Qualitative Research Method. Qualitative Research Journal, 9(2), 27-40. https://doi.org/10.3316/QRJ0902027
Bretschneider, P. a., Cirilli, S., Jones, T., et al. (2017). Document Review as a Qualitative Research Data Collection Method for Teacher Research. Sage Publications. https://doi.org/10.4135/9781473957435
Brown, D. (2007). Horizon scanning and the business environment — the implications for risk management. BT Technology Journal, 25(1), 208-214. https://doi.org/10.1007/s10550-007-0022-8
Buzan, A., & Buzan, B. (1993). The Mind Map Book. BBC Books.
Card, A. J., Ward, J. R., & Clarkson, P. J. (2012). Beyond FMEA: The structured what-if technique (SWIFT). Journal of Healthcare Risk Management, 31(4), 23-29. https://doi.org/10.1002/jhrm.20101
Chambers, C., Wilday, J., & Turner, S. (2009). A review of Layers of Protection Analysis (LOPA) analyses of overfill of fuel storage tanks [Research Report RR0716]. Health and Safety Executive, Buxton. https://www.hse.gov.uk/research/publish.htm
Chang, J. I., & Lin, C.-C. (2006). A study of storage tank accidents. Journal of Loss Prevention in the Process Industries, 19(1), 51-59. https://doi.org/DOI: 10.1016/j.jlp.2005.05.015
Conway, M. (2008). An Overview of Foresight Methodologies [Research paper]. Thinking Futures, Melbourne. https://thinkingfutures.net/downloads/downloads
Crary, D. (2013, 11 July). Rail head lays train blast blame. Dominion Post. http://www.stuff.co.nz/
CSB. (2017). Key Lessons for Preventing Inadvertent Mixing During Chemical Unloading Operations: Chemical Reaction and Release in Atchison, Kansa [Incident Investigation report 2017-01-I-KS]. Chemical Safety and Hazard Investigation Board, Washington DC. http://www.csb.gov/
Davis, S., & Lukomnik, J. (2010, Jan 2010
2013-12-20). Risk Velocity, the Unknown Dimension in ERM. Compliance Week, 7(72), 56-57.
Day, G. S., & Schoemaker, P. (2004). Peripheral Vision: Sensing and Acting on Weak Signals. Long Range Planning, 37(2), 117-121. https://doi.org/10.1016/j.lrp.2004.01.003
Dettmer, H. W. (2007). The logical thinking process: a systems approach to complex problem solving. American Society for Quality.
Dettmer, H. W. (2011). Our goal is … What is our goal? [Research paper]. Goal Systems International, http://goalsys.com/
Drucker, P. (1973). Management: tasks, responsibilities, practices. Harper & Row.
Goldberg, B., Everhart, K., Stevens, R., et al. (1994). System Engineering “Toolbox” for Design-Oriented Engineers [Reference Publication 1358]. NASA, Alabama. http://snebulos.mit.edu/
Gould, J., Glossop, M., & Ioannides, A. (2005). Review of hazard identification techniques [Research Report HSL/2005/58]. Health and Safety Laboratory, Buxton. https://www.hse.gov.uk/research/hsl/
Grainne, K. (2004, March 2004). Reducing risk and all that haz. Safety & Health Practitioner.
Graves, S., & Marsh, T. (2001). Control self-assessment adds value to the internal audit function Allied Academies International Conference. Academy of Accounting and Financial Studies. Proceedings, Arden.
Hansson, S. O. (2018). How to Perform an Ethical Risk Analysis (eRA). Risk Analysis, 38(9), 1820-1829. https://doi.org/10.1111/risa.12978
Hillson, D. (2002, 3-10 October2002). Use a Risk Breakdown Structure (RBS) to Understand Your Risks Project Management Institute Annual Seminars & Symposium, San Antonio, TX. Project Management Institute http://www.risk-doctor.com/publications-papers_general.asp http://www.risk-doctor.com/publications-papers_general.asp
Hopkins, A. (2011). Management Walk-Arounds: Lessons from the Gulf of Mexico Oil Well Blowout [Working Paper wp79]. Australian National University, Canberra. www.http://ohs.anu.edu.au/
Hrymak, V., & de Vries, J. M. A. (2020). The development and trial of systematic visual search: a visual inspection method designed to improve current workplace risk assessment practice. Policy and Practice in Health and Safety, 1-16. https://doi.org/10.1080/14773996.2019.1708615
Huber, M. (2011). The Risk University: Risk identification at higher education institutions in England [Discussion Paper]. London School of Economics and Political Science, London. http://www.lse.ac.uk
Ibanez, M., & Toffel, M. (2017). Assessing the Quality of Quality Assessment: The Role of Scheduling [Working Paper]. https://papers.ssrn.com/sol3/papers.cfm?abstract_id=2953142
IEC61025: 2008 Fault tree analysis, International Electrotechnical Commission, Geneva. https://www.saiglobal.com/
IEC62740: 2015 Root cause analysis (RCA), International Electrotechnical Commission, Geneva. https://www.standards.govt.nz/
IEC/ISO31010: 2019 Risk management – Risk assessment techniques, International Electrotechnical Commission,, Geneva.
ISO31000: 2009 Risk management – Principles and guidelines, International Standards Organization, Geneva.
ISO31000: 2018 Risk management – Guidelines, International Standards Organization, Geneva.
ISO31073: 2022 Risk management — Vocabulary, International Standards Organization, Geneva.
ISO45001: 2018 Occupational health and safety management systems: Requirements with guidance for use, International Standards Organization, Geneva.
ISO Guide 73: 2009 Risk management – vocabulary – guidelines for use in standards, International Standards Organization, Geneva. https://www.lexology.com/
ISO/N1286. (2015). Guidance on the requirements for Documented Information of ISO 9001:2015 [Guidance Note ISO/TC 176/SC2/N1286]. International Standards Organization, Geneva. https://www.iso.org/home.html
Jackson, P. (2014, January). Risky business. Safety & Health Practitioner, 44-46.
Johnson, W. G. (1973). The Management Oversight and Risk Tree – MORT [Research Report SAN8212]. Idaho Falls, ID. www.nri.eu.com
Kirwan, B., & Ainsworth, L. (1992). A Guide to Task Analysis. Taylor & Francis.
Klein, G., Koller, T., & Lovallo, D. (2019). Pre-mortems: Being smart at the start. McKinsey Quarterly.
Kletz, T. (2001). An engineer’s view of human error (3rd ed.). I Chem E.
Leathley, B. (2016, November). Job safety analysis. IOSH Magazine. www.ioshmagazine.com/
Leathley, B. (2017, December). A SWIFT response. IOSH Magazine, 49-52.
Livingston, A., Jackson, G., & Priestley, K. (2001). Root cause analysis: literature review [Contract Research Report CRR325]. Health and Safety Executive, Buxton. https://www.hse.gov.uk/research/publish.htm
McCuaig, B. (1998). Auditing, assurance, & CSA. The Internal Auditor, 55(3), 43-48.
McDermott, P., & Davies, G. (2008). Communicating Operational Risk Results to Senior Management. RMA Journal, 90(9), 50-53.
Meier, P. (2007). Mind-mapping: a tool for eliciting and representing knowledge held by diverse informants. Social Research Update, (52). http://sru.soc.surrey.ac.uk/SRU52.pdf
Mikkelsen, K. L., Spangenberg, S., & Kines, P. (2010). Safety walkarounds predict injury risk and reduce injury rates in the construction industry. American Journal of Industrial Medicine, 53(6), 601-607. https://doi.org/10.1002/ajim.20803
Mitchell, R. (2008). Risk 2018: Planning for an unpredictable decade [Research Report]. Economist Intelligence Unit, London. http://www.eiu.com/
Nertney, R. (1987). Process Operational Readiness and Operational Readiness Follow-on [Working Paper]. System Safety Development Center, EG&G, Idaho Falls, ID.
New Zealand Treasury. (2015). Guide to Social Cost Benefit Analysis. Author, Wellington. http://www.treasury.govt.nz/
Newcombe, I., & Bywater, J. (2005). Guidelines for Best Practice in the Use of Job Analysis Techniques. Retrieved 22 January 2015, from http://ceb.shl.com/assets/resources/Best-Practice-Job-Analysis.pdf
Niven, P. (2014). Balanced Scorecard Evolution: A Dynamic Approach to Strategy Execution. Wiley.
NRI. (2002). MORT – Management Oversight and Risk Tree [Technical Guide NRI-2]. Noordwijk Risk Initiative Foundation, Delft. www.nri.eu.com
NRI. (2009a). MORT – Management Oversight and Risk Tree [Report NRI2-2009-EN]. Noordwijk Risk Initiative Foundation, Delft. www.nri.eu.com
Owen, C. (2018). How emergency services organisations can – and do – utilise research. Australian Journal of Emergency Management, 33(2), 28-33.
Concise Oxford English Dictionary, Oxford University Press Ltd. (2022).
Pavlov, P. (1979). Job Safety Analysis [Report DOE 76-45/19 SSDC-19]. System Safety Development Center, EG&G, Idaho Falls, ID. http://www.nri.eu.com/
Peace, C. (2017a). The reasonably practicable test and work health and safety-related risk assessments. New Zealand Journal of Employment Relations, 42(2), 61-78.
Peace, C. (2019). The effectiveness of risk assessments in informing decision makers [PhD thesis, Victoria University of Wellington]. New Zealand. https://www.wgtn.ac.nz/library
Pergler, M. (2012). Enterprise risk management: What’s different in the corporate world and why [Working Paper 40]. McKinsey & Co, www.mckinsey.com
Porter, M. (1985). Competitive Advantage: creating and sustaining superior performance. Simon & Schuster Inc.
Porter, M. (2008). The five competitive forces that shape strategy. Harvard Business Review, 86(1), 78-93.
Proctor, A. (2009). Creative problem solving for managers (3rd ed.). Routledge.
Proctor, A. (2019). Creative Problem Solving for Managers: Developing Skills for Decision Making and Innovation (5th ed.). Routledge.
Quail, R. (2010). How to plan and run a risk management workshop. In J. Fraser & B. Simkins (Eds.), Enterprise Risk Management – Today’s Leading Research and Best Practices for Tomorrow’s Executives (pp. 155-170). Wiley.
Rasool, M., Franck, T., Denys, B., et al. (2012). Methodology and tools for risk evaluation in construction projects using Risk Breakdown Structure. European journal of environmental and civil engineering, 16(sup1), s78-s98. https://doi.org/10.1080/19648189.2012.681959
Ritchie, J., & Herscovitch, F. (1995). From Likert to love it: engaging blue collar workers in focus group inquiries. Journal of Occupational Health and Safety – Australia and New Zealand, 11(5), 471-479.
Saunders, M., Lewis, P., & Thornhill, A. (2019). Research Methods for Business Students (8th ed.). Pearson.
Schmidt, K. G., Holtermann, A., Jorgensen, M. B., et al. (2021). Developing a practice and evidence-based guideline for occupational health and safety professionals to prevent and handle musculoskeletal pain in workplaces. Applied Ergonomics, 97. https://doi.org/10.1016/j.apergo.2021.103520
Schultz, W. (2007). HSE futures scenario building: The future of health and safety in 2017 [Research Report RR0600]. Health and Safety Executive, Buxton. https://www.hse.gov.uk/research/publish.htm
Schwartz, P. (1996). The Art of the Long View. Doubleday.
Shell International Ltd. (2003). Scenarios: an explorers guide. Author.
Stewart, M., & Melchers, R. (1997). Probabilistic risk assessment of engineering systems. Chapman & Hall.
Sutton, R. I., & Hargadon, A. (1996). Brainstorming Groups in Context: Effectiveness in a Product Design Firm. Administrative Science Quarterly, 41(4), 685-718. https://doi.org/10.2307/2393872
Swallom, D., Lindberg, R., & Smith-Jackson, T. (2003). System Safety Principles and Methods. In Handbook of Human Systems Integration (pp. 497-540). John Wiley & Sons.
Swann, C. D., & Preston, M. L. (1995). Twenty-five years of HAZOPs. Journal of Loss Prevention in the Process Industries, 8(6), 349-353. https://doi.org/10.1016/0950-4230(95)00041-0
Tattam, D., & Esteban, A. (2013, April). Risk velocity – the third dimension of risk? Keeping Good Companies, 65(3), 146-149.
Transportation Safety Board of Canada. (2014). Runaway and main-track derailment [Investigation Report R13D0054]. Author, Montreal. http://www.tsb.gc.ca/
Trbojevic, V. (2008). Optimising hazard management by workforce engagement and supervision [Research Report RR0637]. Health and Safety Executive, Buxton. https://www.hse.gov.uk/research/publish.htm
Tritter, R. P., Zittnan, D. L., & DeHaas, D. (1996). Control self-assessment: experience, current thinking, and best practices. Institute of Internal Auditors.
Turnbull, J. (2011). Assurance Mapping – concept or reality? [Research Report]. RSM Tenon Group, London. www.rsmtenon.com
Turney, R., & Pitblado, R. (1996). Risk assessment in the process industries (2nd ed.). Institution of Chemical Engineers.
Van Eerd, D. (2019). Knowledge transfer and exchange in health and safety: a rapid review. Policy and Practice in Health and Safety, 17(1), 54-77. https://doi.org/10.1080/14773996.2018.1508116
Van Eerd, D., Cardoso, S., Irvin, E., et al. (2017). Occupational safety and health knowledge users’ perspectives about research use. Policy and Practice in Health and Safety, 4-19. https://doi.org/10.1080/14773996.2017.1356544
Wintle, J., Kenzie, B., Amphlett, G., et al. (2001). Best practice for risk-based inspection as a part of plant integrity management [Contract Research Report crr0363]. Health and Safety Executive, Buxton. https://www.hse.gov.uk/research/publish.htm
Xu, Y., Wang, M., Feng, Y., et al. (2023, 2023/05/01/). Does managers’ walking around benefit workplace safety? A safety climate intervention field study. Safety Science, 161, 106062. https://doi.org/10.1016/j.ssci.2023.106062
- This is often misquoted as “a picture is worth a thousand words”. ↵
- High Court Rules 2016, Schedule 4 ↵
- Scognamiglio, D. (2019). Liverpool Victoria Insurance Co Ltd v Zafar. Lexology. https://www.lexology.com/ ↵
- Evidence Act 2006, section 25 ↵
