16 Risk assessment process: Analysis
16.1 Chapter overview
Cross reference to ISO31000 Clause 6.3 and ISO45001 clauses 6.1 and 8.1.
Check for key readings, webinars, and videos for complementary resources.
Definitions of italicised terms are in the Glossary.
Relevant law
- Health and Safety at Work Act 2015 and
- Health and Safety at Work (General Risk and Workplace Management) Regulations 2016
Key questions
What is or will be the impact of artificial intelligence on the business?
Risk is the “effect of uncertainty on objectives”:
- what are the objectives of the organisation, activity, system, or item?
- how could identified uncertainties affect achievement of those objectives?
Useful management techniques
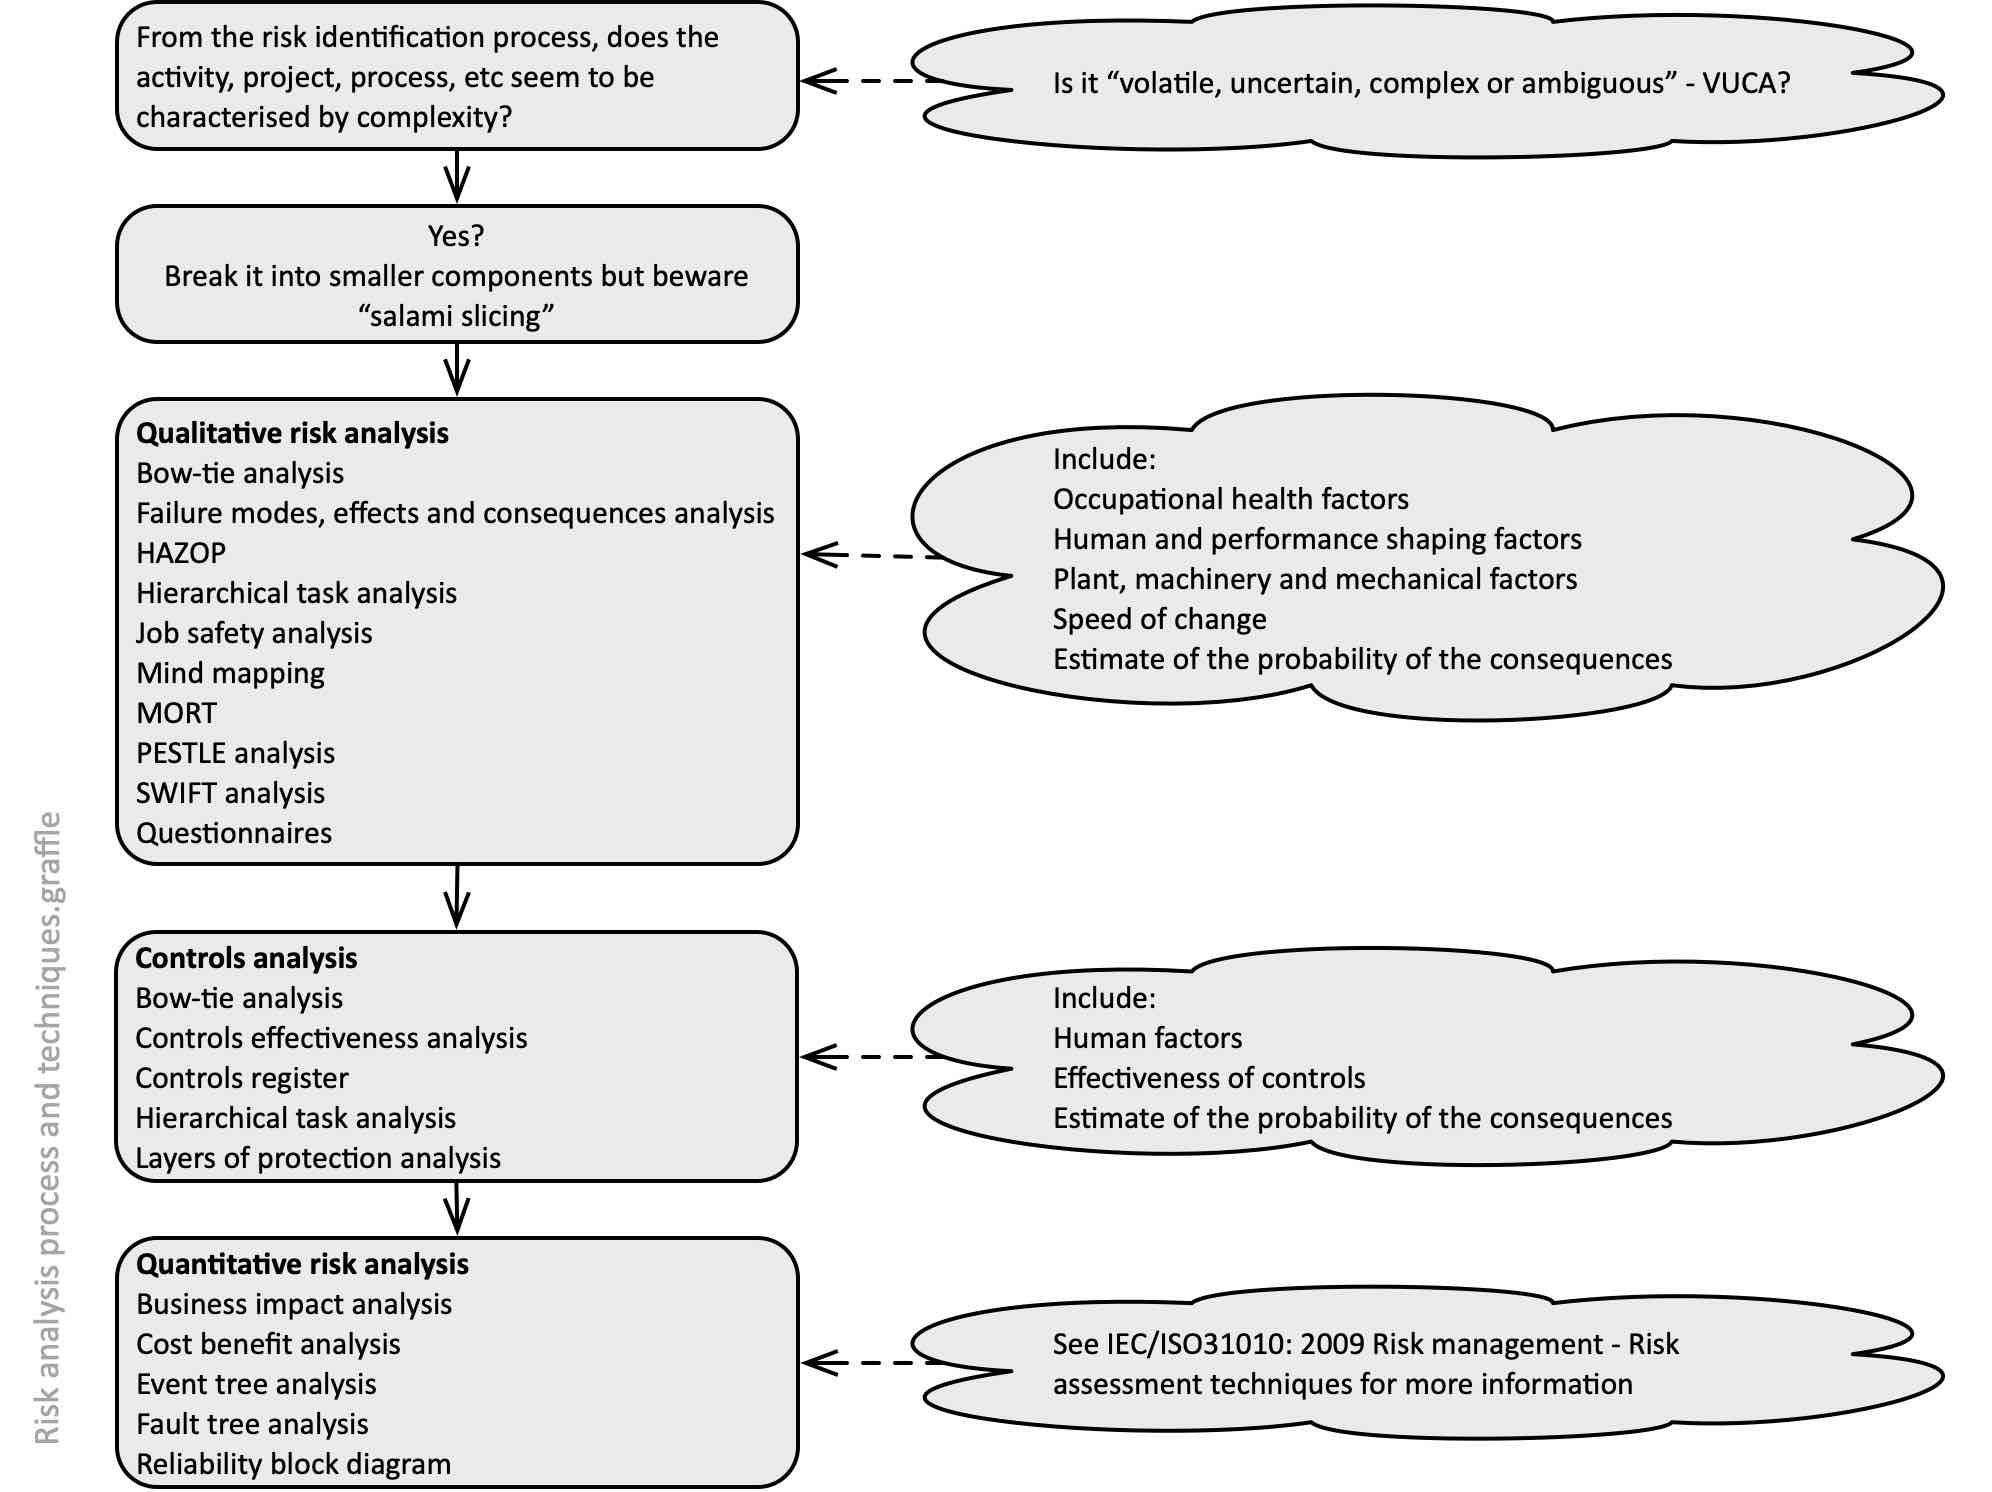
See the list in Figure 51 and then see techniques of interest in Chapter 11.
16.2 What is risk analysis?
Risk analysis is the (ISO31073, 2022) “process to comprehend the nature of risk and to determine the level of risk”. Using substitution (and plain English), it is a “process to understand the nature of uncertainty and its effects on objectives, and to determine the level of uncertainty”. It provides the basis for evaluation and decisions about treating unacceptable levels of uncertainty and their effects on objectives.
16.2.1 Suggested analysis process
Having identified uncertainty and some of its effects on objectives, you now need to ask questions so you can characterise the nature and level of uncertainty and how much it will affect objectives. The quality of your answers will depend on the availability and reliability of the information and the resources (including your time) that you have available. Any assumptions you make, data you decide not to use, or limitations of the techniques you use, should all be recorded.
Figure 51 suggests one way of carrying out a structured analysis, including some relevant techniques. Always start with a qualitative analysis so you see the big picture and then consider quantitative analysis. But please read the notes about quantitative risk analysis before trying to build quantifiable models!
Remember: aspects of uncertainty might be thought to have safety-related consequences, but it might also have financial consequences (eg, fines and penalties following a prosecution, loss of productivity, damage to assets, increase in ACC and other insurance premiums). The reverse may also be true (eg, development of a new product or facility will create safety-related consequences as well as the obvious finance-related risks). Thus, the full range of potential consequences should be included in your analysis.
Beware the assumption that the biggest/worst event in your experience is, in fact, the biggest/worst that could happen with consequences for workers and others.
Experience shows that any review of an analysis should include similar events and their consequences for the PCBU or that have happened elsewhere.
Beware salami slicing
While it may be important to break a complex system into smaller components it is crucial this does not include “salami slicing” into such small components that the resulting risk assessment makes no sense.
16.2.2 Qualitative or quantitative analysis?
The advantages and disadvantages of qualitative and quantitative techniques are summarised in Table 22.
Table 22. Qualitative and quantitative risk techniques compared
|
Advantages |
Disadvantages |
|
| Qualitative techniques | Mostly simple to use and interpret
Provide rich information about the nature and characteristics of risks Easily understood by stakeholders Easier to train employees in use |
Do not identify the level of risk – the “magnitude of a risk or combination of risks, expressed in terms of the combination of consequences and their likelihood” (ISO31073, 2022)
Cannot combine or aggregate risks numerically Limited ability to carry out cost benefit analysis |
| Quantitative techniques | Enable analysis of trends and patterns
Allow numerical combination and aggregation of risks if using, for example, value at risk, cash-flow at risk Permit cost benefit analysis Enable risk-based capital allocation to business units and activities Enable risk-based allocation of insurance premiums to business units and activities Enable calculation of capital requirements to maintain solvency under extreme conditions |
QRA requires development of a model that can be quantified; however, “all models are wrong but some models are useful” (Box & Luceño, 1997, p. 6)
QRA can be time consuming and expensive May require specialist input Units of measurement (eg, dollars) may hide important qualitative factors Use of numbers implies great precision when this may not be warranted Uncertainty in sources of data and assumptions made may not be stated |
16.3 Qualitative analysis
The process suggested in Figure 51 can be used to show how to combine qualitative techniques.
Example 1
For analysis of a loss of control involving mobile plant you could brainstorm (section 21.3.4) a mind map (section 21.3.23) showing the causes and consequences of a “loss of control” event use the “human error” classification in Figure 44, and ask questions about people in the vicinity (5W1H, section 21.3.1). The results could then be combined in a bow tie analysis showing where there are controls, the effectiveness of the controls (section 21.3.6), control gaps, and the likely effectiveness of treatments to improve control of the work activity
Example 2
For analysis of recurring injuries due to slips, trips and falls of workers and others in a public area you could use Figure 40 to identify possible causes of such events. Identification of people who are in the area (5W1H, section 21.3.1), and the work carried out by workers could be mapped on a flowchart (section 21.3.13) showing the effectiveness of the controls (section 21.3.6), control gaps, and the likely effectiveness of treatments to improve control of the work activity.
Example 3
See Cherrie (2023, p. 3) for a theoretical model for uptake of hazardous substances following ocular exposure. The model could be used to guide a literature review about the substance (section 21.3.22), engagement with the workers (section 21.3.9), observations of the work (section 21.3.18), and hierarchical task analysis (section 21.3.17). The results could then be combined in a bow tie analysis showing where there are controls, the effectiveness of the controls (section 21.3.6), control gaps, and the likely effectiveness of treatments to improve control of the work activity.
How you mix and match the wide range of techniques is only limited by your imagination. What matters is that you gather the best available information to help reach a decision about necessary action.
16.4 Quantitative analysis
Quantified risk analysis/assessment (QRA) a systematic analytical technique for quantifying the risks associated with hazardous installations, based on assessing a range of foreseeable failure scenarios. The risk to an individual at a specific location is the summation of the risks arising from the different scenarios.
(BMIIB, 2007, p. 87)
The British Health and Safety Executive is a leading agency for industrial risk assessments. In a 1989 report Quantified risk assessment: its input to decision making (HSE, 1989, p. iv), 16 case studies were reviewed where quantified risk assessment had been used. The report authors commented.
“10. The Health and Safety Executive draws a number of conclusions from this paper. First, QRA is an element that cannot be ignored in decision making about risk since it is the only discipline capable, however imperfectly, of enabling a number to be applied and comparisons of a sort to be made, other than of a purely qualitative kind. This said, the numerical element must be viewed with great caution and treated as only one parameter in an essentially judgemental exercise. Moreover, since any judgement on risk is distributional, risks being caused to some, as an outcome of the activity of others, it is therefore essentially political in the widest sense of the word”. [Emphasis added]
Design and use of QRA
In the UK, “22 … Quantified risk assessment (QRA) is not new and is already used in COMAH [Control of Major Accident and Hazard] assessments and widely used offshore, particularly for comparing the risk impacts of different options. In the context of land use planning around major hazard sites it can be a tool for decision-making that enables the total local population at risk at specific sites to be taken into account, and can help deliver consistent planning advice across industry sectors” (BMIIB, 2007, p. 6).
QRA might be used to predict the overall level of risk arising from a process, activity, plant, or equipment and so help decide whether the level of risk is acceptable or tolerable, and so rank risks for attention. It is particularly useful in plant or equipment design, to show areas where risk can be modified “so far as is reasonably practicable” during the design process.
A QRA need not be complex. Each should be devised for the task in hand, and it is this that will determine the necessary degree of detail. QRAs will therefore only be appropriate, and cost-effective, for some situations and will need to differ significantly in depth.
Problems with QRA
QRA is built on the assumption that risk can be objectively measured (Aven, 2009). The following problems may occur with QRA and subsequent decisions about risk:
- extrapolation from the known consequences of exposure to a high level of hazardous substance to the unknown consequences of low level of exposure may be incorrect
- variations in vulnerability over time, populations and individuals may give misleading results
- a minor error in input data, formula or calculations may be amplified through the analysis to give a misleading output
- differing depths of analysis or omissions from an analysis may be significant
- omission of data on causes (eg, incomplete analysis of plant failures, non-quantification of “human error”, omission of external extreme events) may result in a misleading output
- data may be represented as reliable even though input data is uncertain, unreliable, a “guesstimate” or (sometimes) fabricated
- political considerations (eg, estimated benefits from proposed projects) or aversion to particular kinds of risk (eg, nuclear power stations, petrochemical plants) can be powerful influences in some decisions
- there may be too little data on rare, extreme events (so-called “Black Swans”) on which to base any quantitative analysis.
Therefore, any quantitative ranking of risks should be no more than indicative. It may be misleading and inappropriate simply to compare the results of QRAs prepared for different purposes or using different models or data.
16.4.1 Accident ratio studies
Work by Heinrich (1931, 1941) and Bird & Loftus (1976) gave rise to ratio studies that became part of safety mythology. Accident ratio studies are often used to justify recording and analysing near-hits as part of a monitoring programme. They typically compare the number of fatalities or serious harm injuries with minor injuries, property damage and near-hit events.
In the 1941 edition of his book Heinrich showed the results of his research into the causes of 12,000 closed workers’ compensation insurance records and a further 63,000 other cases from the records of business owners. The records were from a wide range of industrial classifications. Analysis of these cases showed that 88% of industrial accidents were due to “unsafe acts of persons” and 10% were due to “unsafe conditions”.
We no longer refer to unsafe acts; instead, we try to find the underlying reasons why a worker might behave in the ways described by Heinrich. We ask why unsafe conditions exist and, in each case, we apply the hierarchy of control
A close reading of a more recent and widely quoted ratio study by Bird & Loftus (1976, pp. 33-35) suggests it should not be cited as reliable or relevant. Their study clajmed to have analysed of 1,753,498 accidents reported by 297 cooperating companies insured by the Insurance Company of North America. Their analysis showed that “For every serious or disabling injury (ANSI, Z16.1-1967) reported, there were 9.8 injuries of a less serious nature”. They found a ratio of 1 serious harm injury for every 10 minor injuries, 30 property damage events and 600 events with no visible injury or damage.
Can the Bird or Heinrich studies be relied on? What is wrong with them? For example, the following criticisms might apply.
- Neither study was peer reviewed nor critically reviewed.
- The data was collected by Heinrich prior to 1941 and by Bird & Loftus in 1969 (ie, 55-85 years ago) from companies in the USA and may not relate to data in other countries for the same period, let alone now.
- It is not clear how much analysis of the 75,000 cases (Heinrich) or 1,753,498 accidents (Bird & Loftus) was possible, or accurately carried out. For example, at the time of the Bird & Loftus study, computers had relatively little power and software was not as sophisticated as now and, at 10 minutes per record, coding and analysis of the data might have taken nearly 150 person years).
- Analysis of data from 4,000 hours of interviews by Bird & Loftus would require considerable coding of transcripts and analysis (now we would use computer-aided qualitative data analysis software). Was their analysis consistent?
- The effects of external factors (eg, the state of the US economy and seasons) was not discussed.
- The industrial groups studied are not specified, making comparisons with current industry sectors unreliable. The “21 different US industrial groups” covered by Bird & Loftus have probably changed substantially since 1969 (eg, the iron and steel industry has diminished while IT services barely existed in 1969) also making current reliability of the ratio doubtful.
- The ANSI standard definitions may well have changed and may have been different to then-commonly used or currently used definitions elsewhere in the world.
- As Bird & Loftus noted, the numbers used were for reported events, not all events, and may contain under- or over-reporting across the sectors studied.
If a risk or safety professional relies on such results from 55-85 years ago it might well damage their credibility. How then can we use the results of the study? Perhaps to say that, in the long run, fatalities and serious harm events are rarer than minor injuries and near-hits – a fairly obvious statement.
How useful are such accident ratio studies? It might be assumed such studies provide some useful results over a long period of time (say 10 years) but the rarity of data on fatalities and serious harm injuries within an organisation could make such studies pointless. Further, long-term changes in the external and internal business environment may mean we are not comparing like with like. Some business sectors may share anonymous data to help identify common causes, but this may mask variations in equipment, substances, products, training, etc, between organisations. Aggregation of data for a whole country means a ratio may be comparing fatalities and serious harm events in, say, mining or deep-sea fishing with minor injuries in IT services.
However, recent work by Yorio & Moore (2018) using data over 13 years from more than 25,000 workplaces showed that, with modern computer power and large datasets from a single industry, it is possible to show an accident ratio.
16.5 Complexity and coupling
Interactions in a linear system are step-by-step or sequential and easily understood (“if A then B”) whereas in complex systems the interactions are difficult to understand or predict (“if A then B or C or D +E resulting in F or G”) (Perrow, 1999, pp. 86-96). Linear systems may appear to be preferable than complex systems but often are less efficient to operate.
Linear systems are more spread out than complex systems and it is easier to isolate and work round failed components. Whether a system is complex or linear, loosely coupled or tightly coupled it will degrade over time. Unless such degradation is actively countered the system will drift into failure (Dekker, 2011), as shown by the 2010 Pike River disaster (Logan et al., 2025). The following table shows how system complexity and coupling can combine to increase uncertainty. The worst combination is tightly coupled, complex system while the best is a loosely coupled linear system.
Table 23. Risk in systems
| System complexity | ||
| Coupling | Linear systems | Complex systems |
| Loose | Possible failures are predictable and do not directly affect the system
These systems may be easily controlled centrally as well as locally and therefore have lower inherent risk Example: manually controlled production line fed from the components store and delivered to the finished goods store |
Possible failures are unpredictable but do not directly affect the system
Inherent risk in these systems is therefore medium and is best controlled locally Examples: military adventures; research & development firms |
| Tight | Possible failures are predictable and directly affect the system
Although consequences of failure may be severe, linear interaction makes the risk easily controllable by centrally planned controls. Inherent risk is therefore medium in these systems Example: chemical reactions in a batch process at ambient temperature and pressure |
Possible failures are unpredictable and directly affect the system
Inherent risk in the system is high and not easily controllable, since the tight coupling requires a centralised control approach whereas the complexity requires a decentralised control approach Example: chemical reactions in a continuous process involving pressure and temperature changes |
The following table gives a summary of tight and loose coupling in systems.
Table 24. Tight and loose coupling in systems
| Tight coupling | Loose coupling |
| Delays in processing not possible | Processing delays possible |
| Invariant sequences | Order of sequences can be changed |
| Only one method to achieve the goal | Alternative methods available |
| Little slack possible in supplies, equipment, people | Slack in resources possible |
| Buffers and redundancies are designed-in, deliberate | Buffers and redundancies are fortuitously available |
| Substitutions of supplies, equipment, or people are limited and must be designed-in | Substitutions are fortuitously available |
In complex systems, equipment may be close together with common-mode connections and limited isolation of components. These may fail in unforeseen ways.
Table 25. Complex versus linear systems
| Complex systems | Linear systems |
| Tight spacing of equipment | Equipment spread out |
| Proximate production steps | Segregated production steps |
| Many common-mode connections of components not in a production sequence | Common-mode connections limited to power supply and environment |
| Limited isolation of failed components | Easy isolation of failed components |
| Specialisation of employees limits awareness of interdependencies | Less specialisation of employees |
| Limited substitution of supplies and materials | Extensive substitution of supplies and materials |
| Unfamiliar or unintended feedback loops | Few unfamiliar or unintended feedback loops |
| Many control parameters with potential interactions | Control parameters few, direct and segregated |
| Indirect or inferential information systems | Direct, online information sources |
| Limited understanding of some processes (associated with transformation processes) | Extensive understanding of all processes (typically fabrication or assembly processes) |
| Summary terms | |
|---|---|
| Proximity | Special segregation |
| Common-mode connections | Dedicated connections |
| Interconnected subsystems | Segregated subsystems |
| Limited substitutions | Easy substitutions |
| Feedback loops | Few feedback loops |
| Multiple and interacting controls | Single purpose, segregated controls |
| Indirect information | Direct information |
| Limited understanding | Extensive understanding |
16.6 Other issues
When is a worker at work?
A worker may be travelling from their workplace to home in a PCBU vehicle to their workplace. When at home they may carry out administrative or other tasks, and it may be clear that they are still “at work” and that their home forms part of their workplace. As a result of the COVID-19 pandemic more people work at home and their employing PCBU owes them a duty of care for their health and safety. However, when travelling in a PCBU vehicle it may be less obvious when a worker arrives at their workplace. There will also be times when a worker travels on public transport, including by air, as part of their work. Are they at work during such travel?
In February 2021 the New Zealand High Court confirmed that to be “at work” for the purposes of the Health and Safety at Work Act 2015, a link between the particular activity undertaken and the work of the PCBU is required (Belcher, 2021; Murray Kelvyn Sarginson v CAA, 2020). If that link is established, anyone engaged in the activity will be a worker “at work” for the purposes of the Act. The short article by Belcher succinctly summarises the High Court decision and the circumstances that gave rise to it.
Violations of required standard operating procedure
A crane company and its director were convicted of breaching the South Australian Work Health and Safety Act by failing to plan for the job and disregarding a crane’s safety features(Sowden & Ly, 2021). Despite a recorded conviction, financial penalties were not imposed.
In-house modifications of machinery
In a civil claim for damages, the New South Wales Court of Appeal found an employer defendant to be liable as a result of in-house modifications it undertook on machinery in circumstances where adequate engineering advice had not been first obtained (Rafter, 2021).
16.7 Chapter summary
This chapter has covered some high-level issues that must be considered when analysing the causal factors of events, and the potential consequences of such events.
16.8 References used in this chapter
Aven, T. (2009). A new scientific framework for quantitative risk assessments. Int. J. Business Continuity and Risk Management, 1(1), 67-77.
Belcher, R. (2021). When is someone ‘at work’ under the Health and Safety at Work Act? Lexology. Retrieved 23 February 2021 from https://www.lexology.com/
Bird, F., & Loftus, R. (1976). Loss Control Management. Institute Press.
BMIIB. (2007). Recommendations on the emergency preparedness for, response to and recovery from incidents [Incident Investigation report]. Buncefield Major Incident Investigation Board, London. http://www.hse.gov.uk/comah/investigation-reports.htm
Box, G., & Luceño, A. (1997). Statistical Control By Monitoring and Feedback Adjustment. Wiley.
Cherrie, J. W. (2023). Occupational exposure science. Annals of Work Exposures and Health, wxad052. https://doi.org/10.1093/annweh/wxad052
Dekker, S. (2011). Drift into Failure: From Hunting Broken Components to Understanding Complex Systems. CRC Press. 10.1201/9781315257396
Heinrich, H. (1931). Industrial Accident Prevention, A Scientific Approach. McGraw-Hill.
Heinrich, H. (1941). Industrial Accident Prevention, A Scientific Approach (2nd ed.). McGraw-Hill.
HSE. (1989). Quantified risk assessment: its input to decision making. HMSO.
ISO31073: 2022 Risk management — Vocabulary, International Standards Organization, Geneva.
Murray Kelvyn Sarginson v CAA [2020] NZHC 3199 Invercargill High Court. https://www.lexology.com/
Perrow, C. (1999). Normal Accidents: living with high-risk technologies. Princeton University Press.
Rafter, G. (2021). Employer found liable for injuries to worker due to in-house modifications performed on machinery. Lexology. Retrieved 10 March from https://www.lexology.com/
Sowden, L., & Ly, A. (2021). Overriding safety results in serious WHS breach [Website]. Lexology, https://www.lexology.com/
Yorio, P. L., & Moore, S. M. (2018). Examining Factors that Influence the Existence of Heinrich’s Safety Triangle Using Site-Specific H&S Data from More than 25,000 Establishments. Risk Analysis, 38(4), 839-852. https://doi.org/10.1111/risa.12869
