5.5 Case studies
The following case studies demonstrate data analytics in healthcare to manage patient outcomes and conserve health resources.
Case 1: Readmission rates
Many healthcare organisation strategic priorities now focus on preventing hospital readmission and on how to best manage patients in primary healthcare settings; this involves community-based support and outreach care to prevent hospital readmission. Suresh (2016) described a model for using available data for patients to provide a probability rating for readmission rates for each patient. The rating is available to each clinician at the point of care to inform their clinical decision-making. More specifically, data analytics can be used to provide personalised care to patients with high risk of readmission.
Suresh (2016) demonstrated that the use of readmission prediction models developed from machine learning techniques in a paediatric hospital at Pittsburgh yielded an algorithm that predicts the probability of readmission of patients with chronic diseases such as asthma exacerbations, seizures and pneumonia. The algorithm identifies these patients to treating clinicians to facilitate discharge processes and ensure appropriate services and follow-up are being considered to prevent readmission. This application of big data highlights its benefit in using a predictive modelling approach using real-life data to improve patient outcomes and health services resources.
Case 2: Pandemic response
Data analytics has been successfully used in epidemic surveillance, tracing, treatment and prevention, policymaking and resource allocation strategies. These concepts were demonstrated in the recent COVID-19 outbreak throughout the world (Hasan et al. 2023).
COVID-19 management used descriptive, predictive and perspective approaches of data analytics to provide timely real-life decision-making tools and large-scale responses to address the challenges associated with the pandemic. Tools for retrieving, processing and analysing COVID-19 data included AI, machine learning, cloud computing and improved susceptible infected models; these were instrumental in providing accurate prediction of the pandemic course (Mbunge et al., 2021; Sheela & Arun, 2022; Tuli et al., 2020; Zheng et al., 2020).
The pandemic provided an opportunity for data sharing between various countries, not just healthcare organisations within the same jurisdiction. This resulted in not only sharing available data from various platforms and data sources but sharing of advanced technologies to process large amounts of varied data across the globe. This in turn provided real-life, timely and valuable data for frontline staff, policymakers and government bodies about finances and resource allocation (vaccines and COVID-19 therapies)
Case 3: Blood glucose monitoring
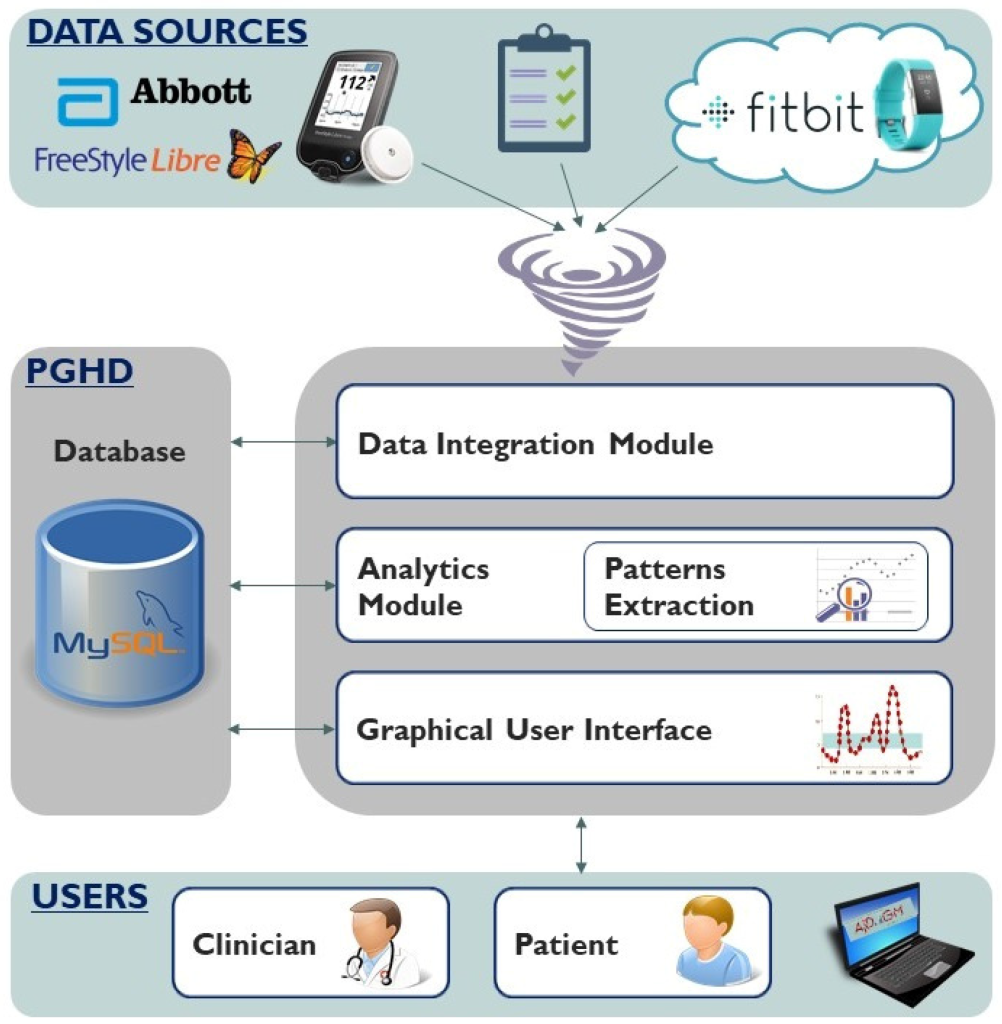
Data analytics and its integration with various software and lifestyle devices such as Fitbits, smartwatches and home blood monitoring devices offers valuable, timely information to patients, carers and clinicians in primary care settings. Salvi et al. (2020) presented a patient integration model that used advanced data analytics modelling and processing from various devices to analyse patient pathology data and couple it with their physical activities and daily eating habits to map a pattern of blood glucose fluctuations over time (see Figure 5.4). Blood glucose fluctuations for the patients were classified into various phases of control for each patient, which was demonstrated graphically to the patient and their clinicians. The data was subsequently used to modify patient treatment and lifestyle habits to optimise diabetes management.
These case studies show how an objective representation of various data types form a well-integrated system to allow better use of available data to improve patient health outcomes. This concept could be transferrable to other chronic disease conditions, such as management of hypertension and hypercholesteremia, which not only will benefit patients but will reduce drain on health resources.

Real-time health management
Singh et al. (2023) conducted a systematic review to provide various examples of how data analytics applications make a significant contribution to the real-time management of health outcomes and resources in various health settings.

