Part 2 – Design
28 Evaluating Quiz Questions
Antonella Strambi; Richard McInnes; Joshua Cramp; and Kirsty Summers
In a Nutshell
Evaluating quiz questions, before and after administering a quiz, should be part of a continuous improvement cycle to ensure student learning and teaching effectiveness. In this chapter, we discuss quiz evaluation techniques that can be used before a quiz is presented to students as well as after the quiz is completed.
Why Does it Matter?
Quizzes are a commonly used online assessment tool – but how do you know if your questions are fair, able to differentiate strongly performing students from weaker students, and measuring what you need them to measure? Writing effective quiz questions can be challenging. Ensuring validity and reliability, as well as controlling for students’ cognitive load, requires thoughtful consideration of what and how we are assessing. Quizzes provide evidence of students’ development toward learning outcomes. As such, they are data collection instruments, like surveys used for research purposes. Therefore, we must ensure that they are evaluated and refined before they are administered for the first time and on an ongoing basis.
What Does it look like in Practice?
Online quizzes can be evaluated at various times. The validity and cognitive load of questions can be evaluated as you write the questions and peer review of the quiz is conducted before the quiz is administered. Post analysis of the student results happens once the students have completed the quiz.
In this section:
- Pre-Administration Quiz Review
- Post-Analysis of Quiz Results
Pre-Administration Quiz Review
Some of the critical checks that need to be performed before a quiz is administered include content coverage and level, and question writing and presentation. For detailed principles and criteria for effective question writing, you may want to review our previous chapter, titled Writing Effective Online Quiz Questions.
Content Coverage and Level
Pre-administration checks ensure that:
- All questions are designed to assess knowledge at the appropriate level, i.e. they are aligned with verbs in course learning outcomes.
- The quiz assesses all relevant course learning outcomes and content areas in the appropriate proportion.
The chapters on Constructive Alignment for Course Design and Principles of Assessment Design provide a useful introduction to key principles underlying these ideas.
A useful tool to enable these checks is a simple matrix that shows content focus and knowledge level for each question included in the quiz. A tally (i.e. frequency count) of all questions against different topics and knowledge levels enables the quiz writer to assess the quiz coverage. A sample overview matrix for a quiz assessing course learning outcomes at 4 levels of knowledge (as measured using Bloom’s taxonomy) and 4 topics is provided in the table below.
| Knowledge Level | Topic 1 | Topic 2 | Topic 3 | Topic 4 | Total items | % of quiz |
| Comprehend | 3 | 3 | 3 | 3 | 12 | 20% |
| Apply | 4 | 4 | 3 | 4 | 15 | 37.5% |
| Analyse | 4 | 2 | 3 | 2 | 10 | 25% |
| Evaluate | 0 | 1 | 1 | 1 | 3 | 7.5% |
| TOTAL | 10 | 10 | 10 | 10 | 40 | 100% |
Question Writing and Presentation
A review of how quiz questions are written and presented to students ensures that principles discussed in the chapter, Writing Effective Online Quiz Questions are indeed realised. Checks include:
- Multiple-choice question (MCQ) stems are written in clear, accessible language and do not contain extraneous information
- MCQ Keys are the only correct options and are indisputably correct
- MCQ Distractors are plausible
- No ‘cuing’ is provided in MCQ options
- Questions are presented in ways that capitalise on online affordances without creating unnecessary cognitive load for students (e.g. consider screen layout, use of images, etc.)
- Sufficient time is allocated for completing the quiz. A useful strategy is to time yourself or a colleague from your discipline when completing the quiz and multiplying this time by 3 or 4 to predict how long it might take a competent student. Another rough measurement is to allocate one minute for each simple MCQ, keeping in mind that more complex questions will take longer.
Once you have performed your own checks, it is important to seek feedback on a quiz draft. Colleagues from your discipline can be very helpful as ‘critical friends’. If possible, a pilot test should also be conducted by administering the quiz to non-experts, i.e. people who have a similar level of knowledge as your students.
Post-Analysis of Quiz Results
Once the quiz has been administered, either as part of a pilot test or for student assessment, you can use the results to measure the quiz effectiveness. Here are a few measures you may want to utilise for this purpose:
Facility Index
As the name suggests, the facility index is a measure of how easy a question was for students. It is simply the percentage of students who answered a question correctly. To calculate the facility index, for each question, tally the number of students who answered the question correctly and the number of students who attempted that question.
Click to read how to calculate and interpret the Facility Index
Calculate the facility index by dividing the number of students who answered the question correctly by the total number of students answering the question. If less than 5% of the students answered the question correctly, the question is either extremely difficult or there is something wrong with it – for example, it is worded in a way that makes it difficult for students to understand the question.
Conversely, if over 95% of your students have answered it correctly, it is too easy and does not discriminate between successful and unsuccessful learners.
However, there may be times when it is appropriate to have a facility score of 95%. An example would be when there is a critical concept that all students must acquire; in all other cases, we should aim for no more than 75% for 4-item MCQs (Parkes & Zimmaro 2016).
If a question records a facility index lower than 30%, it should be reviewed to identify whether it is attached to a concept that has not been appropriately scaffolded in the course or whether there are any issues in the way the question is presented to students.
The facility index, as well as the other measures discussed in this Chapter, can also be used to ensure that alternative questions in randomised quizzes are of comparable difficulty. In other words, if one question is randomly selected out of two equivalent items for inclusion in a quiz, then the facility indexes for the two possible questions should be similar.
Discrimination Efficiency Index
The main idea behind the discrimination efficiency index is that students who perform well on the quiz overall will tend to answer most questions correctly. In other words, it is a correlation measure. A low discrimination efficiency index indicates that students’ answers on a specific question are out of pattern – for example, student A answered 10 questions incorrectly but got question X correct, whereas other students who did well overall answered question X incorrectly.
Click to read how to calculate and interpret the the Discrimination Efficiency Index
To calculate the discrimination efficiency index, you will first need to calculate the discrimination index. To do this, sort the students into two groups, top scorers, and bottom scorers. Calculate how many students in each group answered a specific question correctly. You will need to do this for each question separately. Use the following formula to determine the discrimination index:
(Number of upper group students who answered correctly - Number of lower group students who answered correctly) / Total number of students in the upper and lower groups.
Then, use the facility index for each question that you calculated previously with the following formula:
Discrimination Index *(1-facility index)
Questions that have a discrimination efficiency index lower than 0.20 or 20% should be discarded (Parkes & Zimmaro 2016). A low discrimination efficiency index indicates that although the question discriminates between high and low performers, it might be too easy or too difficult for an effective assessment.
Internal Consistency
Internal consistency refers to the extent to which the items within a quiz or test measure the same construct or concept consistently. One common measure of internal consistency is Cronbach’s Alpha, which assesses how well the items in a quiz correlate with each other and it is a score ranging from 0 to 1. Cronbach’s Alpha is routinely used to evaluate internal consistency of survey scales, therefore it is often provided as option in statistical analysis tools. High-stakes, standardised tests should achieve an internal consistency above 0.9. However, for course assessments, an internal consistency index of 0.6 or above is acceptable (Parkes & Zimmaro 2016).
Analysis of Distractors
Ideally, distractors should only be selected by students who have not mastered the content you are assessing. If a distractor is selected by many students, it may indicate that the question or options are not clear. Similarly, if a distractor is never or very rarely selected, then it is probably implausible and should be discarded. To check whether the distractors are working the way they are intended, we can inspect a frequency table that shows which options were selected by high-performing versus low-performing students. An example of this process is provided in Parkes and Zimmaro (2016).
 At UniSA...
Moodle provides a range of statistical measures in the Quiz Statistics Report that summarises how students interacted with the quiz.
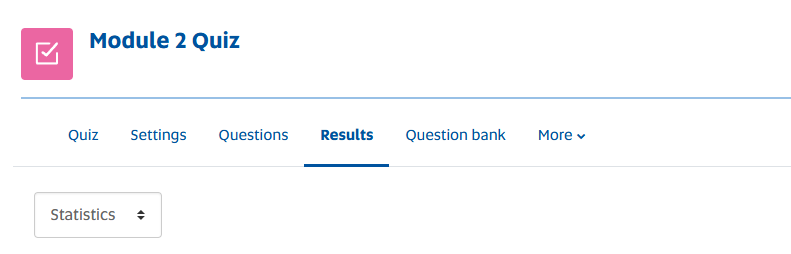
The Quiz Statistics report is accessed from the ‘Results’ tab (step 1) and by selecting ‘Statistics’ (step 2) from the dropdown menu (see image below).
The Quiz statistics report has several components, including:
- A summary of the whole quiz in Quiz information, containing the internal consistency score
- A Quiz structure analysis table, providing detail on which answer options students selected
- Finally, there is a Statistics for question positions graph of two evaluation tools, the Facility index and the Discriminative efficiency index, as shown below for a 10-question quiz.
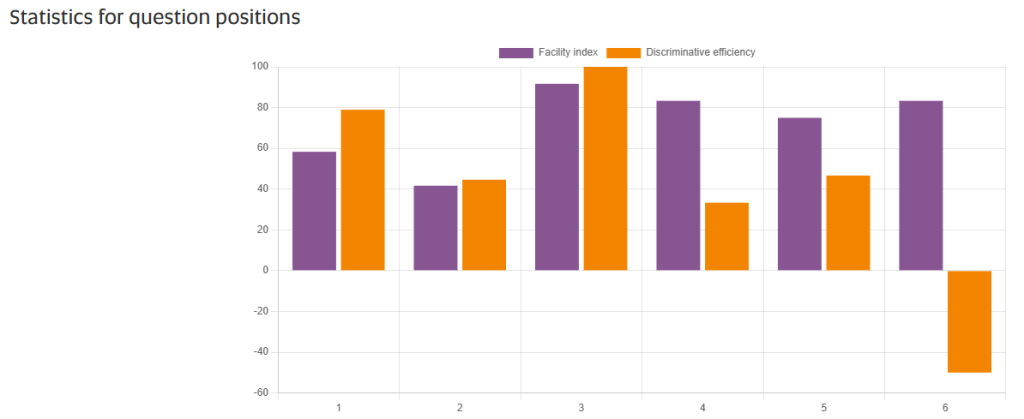
Investigating Facility Index together with Discrimination efficiency index provides useful data to evaluate each question and can help you to identify questions that need to be modified to provide all students with a fair grade (Gamage et al, 2019).
Conclusion
Writing a quiz is only the beginning in a process of continuous improvement. Item and quiz analysis can provide valuable information not only about the quiz validity and reliability, but also on the effectiveness of the learning process. If an item is excessively difficult, this may indicate that the concept it is assessing has not been appropriately scaffolded. Therefore, a quiz can be a valuable measure of teaching effectiveness, as well as student learning.
Knowledge Check – What did you Learn?
Answer the following four questions to see how much of the information you have retained.
What does it all mean for me?
If you have an existing quiz that you would like to evaluate, you may want to follow these steps:
1. Explore what’s available to you. The measurements outlined in this chapter may be accessible to you through your Learning Management System (LMS). Determine what measures are available to you within your quiz settings:
- Login to you LMS using your credentials.
- Locate the ‘Quiz’ section or the specific quiz you wish to evaluate.
- Locate the following measures (if available)
- Facility Index
- Discrimination Efficiency Index
- Internal Consistency Score
- Any other relevant statistical measures related to quiz assessment
If you need help finding these measures in your LMS, your IT department may have help pages or you could do a Google search.
2. Once you have found these measures, interpret the values and data that is presented. Compare the values to those values outlined in this chapter.
3. Reflect on what may or may not need to change in your quiz and why.
References
Gamage, S. H., Ayres, J. R., Behrend, M. B., & Smith, E. J. (2019). Optimising Moodle quizzes for online assessments. International Journal of STEM Education. 6(1), 1-14. https://doi.org/10.1186/s40594-019-0181-4
Parkes, J., & Zimmaro, D. (2016). Learning and assessing with multiple-choice questions in college classrooms. Routledge. https://doi.org/10.4324/9781315727769
Media Attributions
- Private: UniSA Logo
- Moodle Quiz Statistics
- Moodle Quiz Facility index
