Part 1 – Teach
13 Using Learning Analytics to Track Students’ Online Engagement
Diana Quinn
In a Nutshell
When you teach on-campus, it is easy to address the question, ‘are your students engaged?’ because you can see the students who are present and (for the most part) you can see what they are doing. However, during periods of exclusive online learning, having a clear sense of student engagement with course content and learning activities can be challenging. This chapter provides an overview of the analytic reports that are usually available from Learning Management Systems (LMS) and other sources. It also provides suggestions on how to interpret student engagement data.
Why Does it Matter?
Student engagement reports available from the LMS or other systems can help identify students who may be having trouble staying connected with their studies, peers, and teaching staff when studying online, allowing for timely interventions to re-connect them. Additionally, these reports can help determine which resources students are engaging with and which they are not, providing valuable insights to enhance your course site design and improve the overall learning experience.
What Does it Look Like in Practice?
In this section:
- Why measure students’ online engagement and what does that mean?
- What type of analytics?
- Caveats on interpreting student engagement data
Why Measure Students’ Online Engagement and What Does That Mean?
Digital engagement encompasses all the touchpoints you have set up for your students in the LMS. Essentially, it can be anything and everything that involves an online interaction, ranging from opening and clicking links to participating in forums, quizzes, and video recordings. The most widely used definition for engagement is one offered by Kuh et al., who state that “Student engagement represents both the time and energy students invest in educationally purposeful activities and the effort institutions devote to using effective educational practices” (2008, p. 542).
It is important to note that although student engagement with online learning platforms has been proven to correlate with better academic performance (Rodgers, 2008), a student may still perform well in a course without actively using the course website. Therefore, the data reports of student engagement are best used to provide additional insights into student engagement behaviour or as a meaningful starting point for an informed dialogue with students on learning behaviours they need to adjust to improve their success in their studies.
What Type of Analytics?
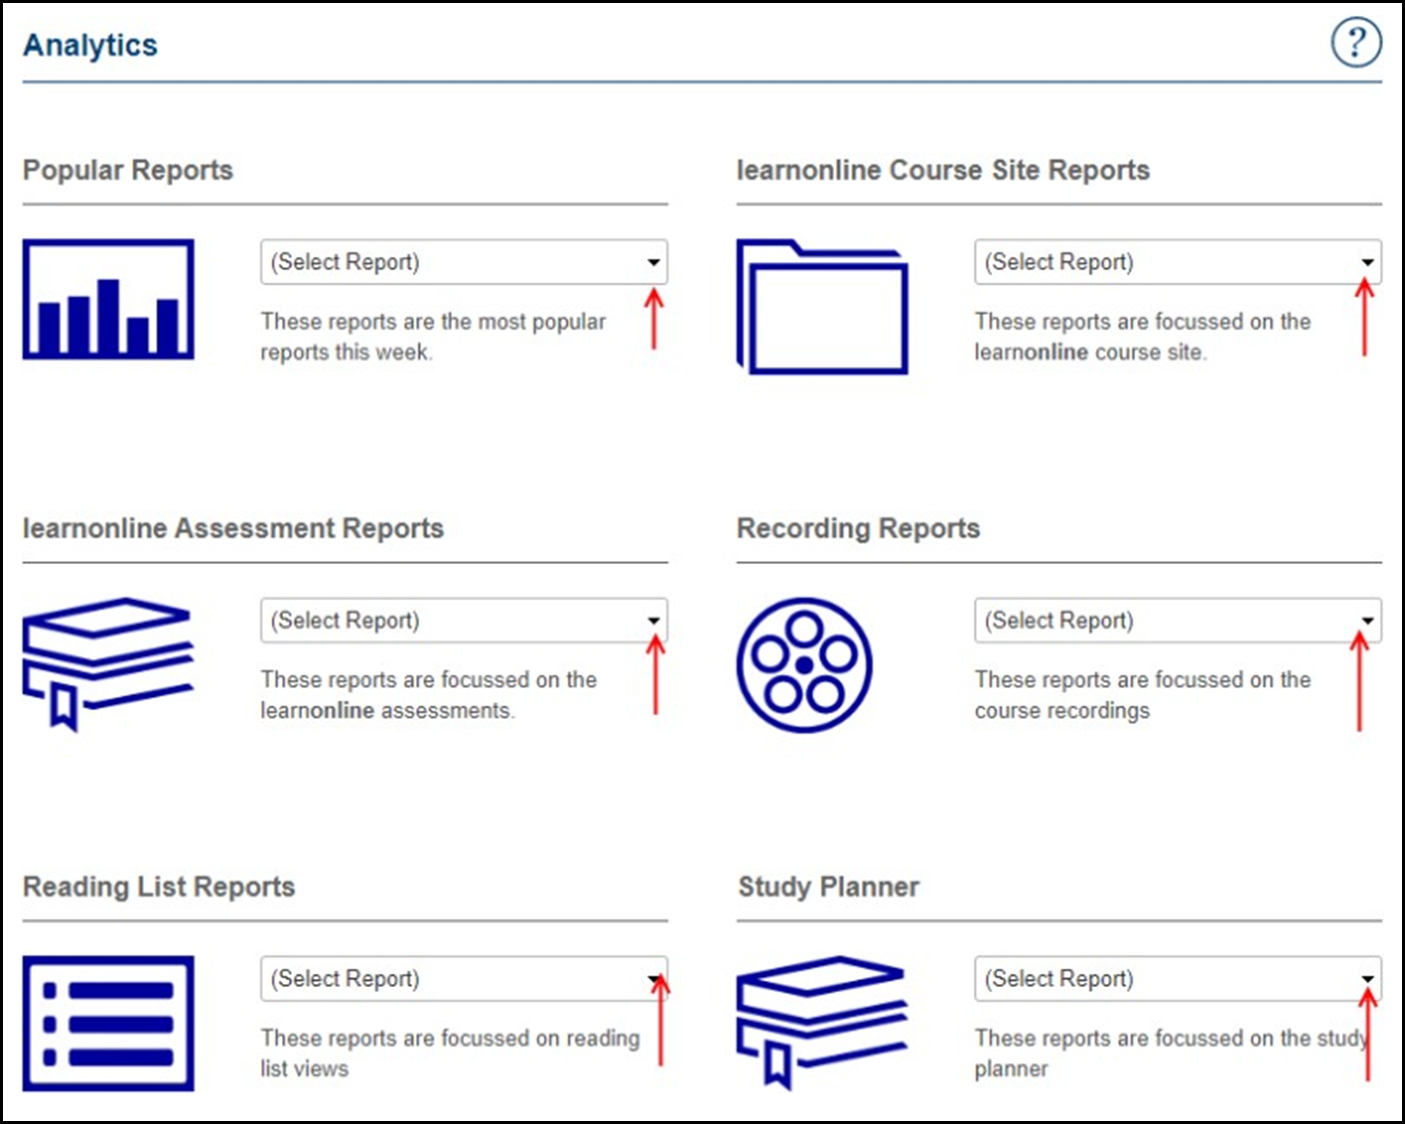
Analytics can provide insight into various aspects of learning. For example, Figure 1 below shows a screenshot of the different reports available at the University of South Australia; these include LMS engagement and submitted assessments reports, student access to course readings, as well as access to course video resources.
Engagement with the Course Site
At the beginning of a Study Period – for example, a semester – most educators are interested in the report on first time logins. Toward the end of the Study Period, the topic of interest may be the report on their Course Evaluation Response Rate or the report on their Course Grade Distribution.
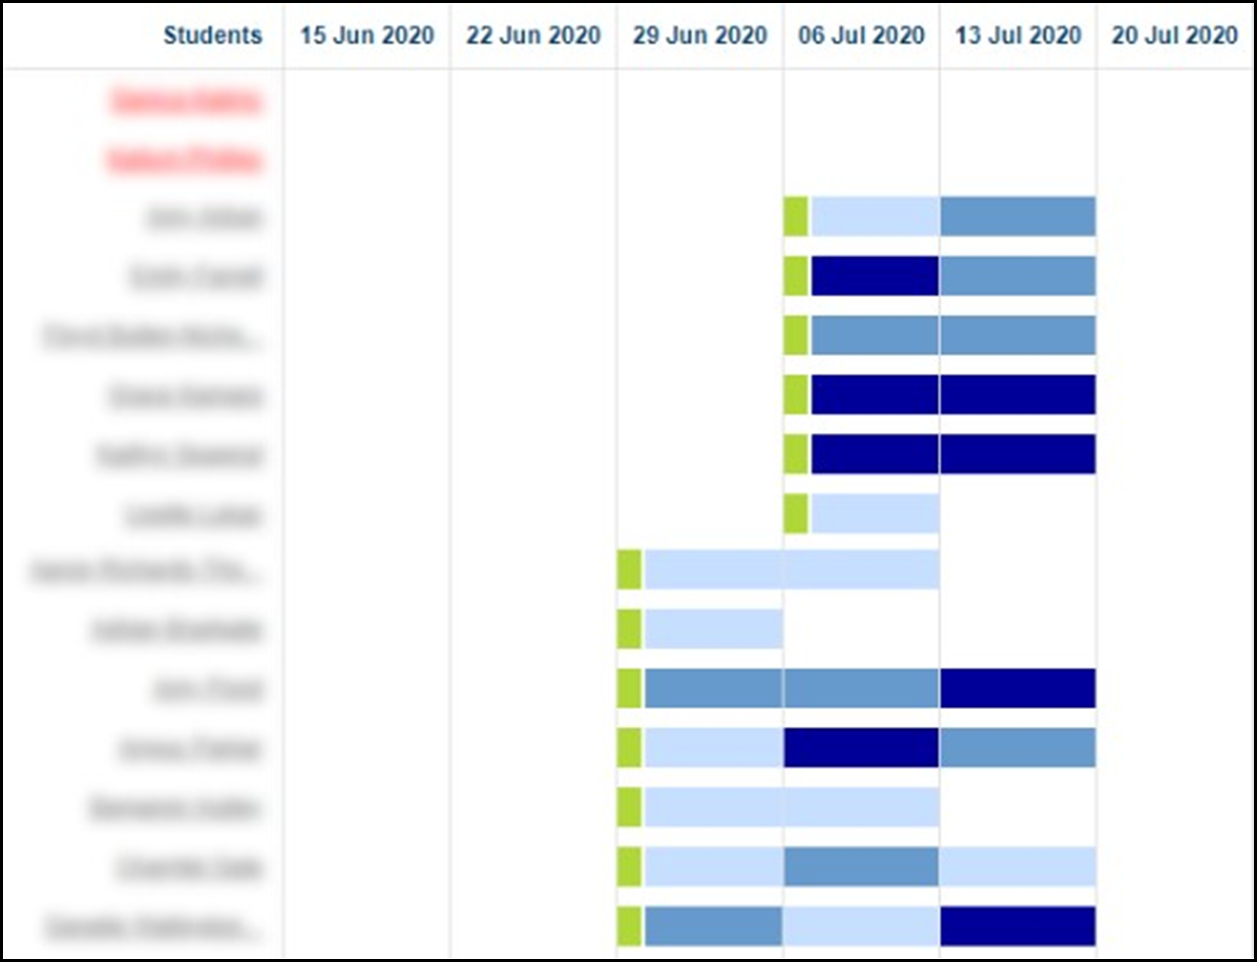
Analytics tracking student course site visits (first-time login and weekly/daily visits) can be represented as a heat map of student engagement, with the intensity of a colour representing the amount of engagement. These analytics may help identify students who are late to join (the green line in Figure 2 indicates first login) or have yet to log in (students’ names in red). As these students are considered ‘at risk,’ they can be contacted to offer support, if appropriate.
However, this type of report can raise more questions than it answers. Is late arrival actually likely to make a student at risk in your course? Will late arrival influence students’ overall grades? Is late arrival a problem that is best tackled at the program level, for example through a combination of interventions and a unified approach? Keep these questions in mind as you analyse student engagement in your courses, as you would be the best person to assign the correct meaning to the data based on what you know about your course context.
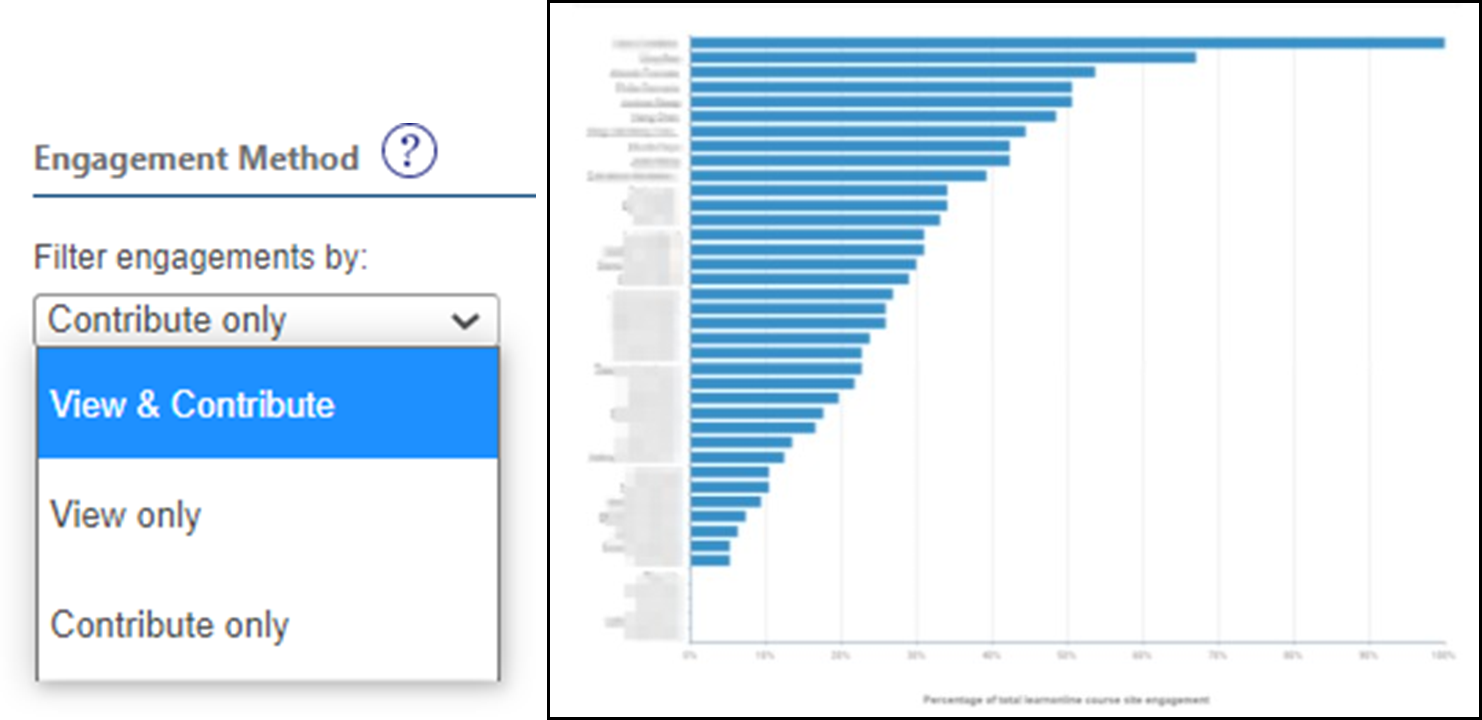
Other reports may show engagement with the course site throughout the semester. For example, LMS reports usually show the average student activity engagement within the course offering; filters can be applied to focus on specific areas of the report, by selecting an activity or engagement method. For example, only data from quizzes in the course can be selected if relevant, or you may want to see how many students have participated (i.e., viewed and contributed) in a forum discussion.
You could also exclude forum post viewings, to identify students who have actively contributed (i.e. posted) – in Figure 3, the filter would be changed to ‘Contribute only’. Forum contributions have been found to correlate with the upper end of student results and can be used to identify ‘champion’ students early and establish forums around them (as one of many options).
Video Watching Analytics
Other resources on which you may want to track student engagement include video presentations and readings. Video recording reports can provide insight into how often your students watch course recordings and for how long.
A watched time report illustrates the total time per student that the recordings have been watched for the course offering. This data can be sorted by students who have watched most or least and can help you identify which students are using the recordings and which are not. From this aggregated data, you can also see the total video time played by all students and the number of views along the recording timeline as a percentage of the video. In other words, how many students have viewed the whole video or a percentage of its total length.
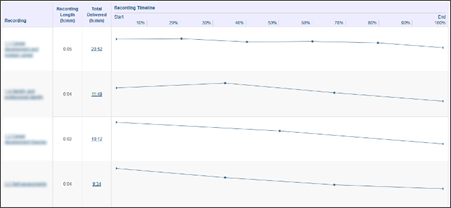
This information can also be visualized as a heat map for a selected video, showing which parts of the video were watched most by which students, and which parts were watched least. If the heatmap shares many similarities among many students, this information can be useful when evaluating the quality of the videos available in the course website.
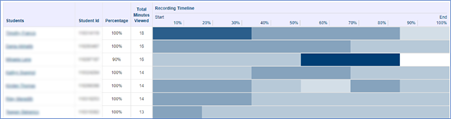
You may also be able to select an individual student to access their viewing profile – what videos they watched and for how long.
If you have spent a lot of time creating video presentations to illustrate concepts in your course, you may be disappointed at the learning analytics report for your course videos. Often, data will show videos have not been watched at all, or they have not been watched in their entirety. When reviewing your video watching reports, consider whether there are other options for students to gain the same information other than the video. For example, there could be a printable equivalent (e.g., a lecture handout) or the topic could be covered in a textbook or other resource.
As educators, we support the learning preferences of student cohorts from diverse learning backgrounds by providing an array of learning resources for students to choose from. This is good practice and will engage more of your student cohort. However, it calls for a more critical interpretation of these focused data sets. You may also need to consider in parallel which resources students are accessing via other sources, such as the Library eReserve.
Reading List Reports
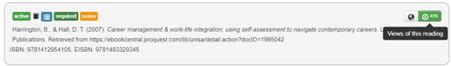
Many university libraries have an eReserve system, which provides reading list reports. Figure 4, for example, shows that the resource titled Career management & work-life integration has been viewed 476 times (note that this information is not visible to students, in this case).
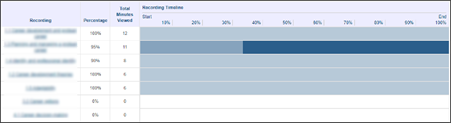
Depending on how the eReading system is set up at your institution, you may also be able to view in detail which students have accessed a resource and how many times. Figure 5 shows an example of an eReserve report available at UniSA which lists the students on the left, and where the bar graph represents the total views per student for a given eReserve item.
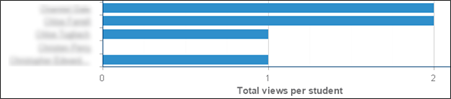
When interpreting reading list reports, look for those readings that are the most popular and those which are not. Remember that accessing an eReading is not the same as reading an eReading resource. Consider the placement of the eReading in the website and the narrative framing it. Ask yourself the following questions: Are there sufficient reasons for students to access an eReading? Do they know why the eReading is important and what they are to do with the knowledge gained from it? By asking questions such as these you can determine which of your readings have the most impact and why, and whether you may need to reconsider your choice of resources.
Caveats on Interpreting Student Engagement Data
Because digital student engagement covers so much ground, it can be overwhelming to analyse and track all dimensions of student online activity. There are a few caveats to be made around the use of engagement data reports.
Engagement Data as a Guide: Engagement data is useful as a guide, but not as a measure of academic success. There is no mechanism for ensuring that a whole cohort will engage with your online resources and often the relationship between online engagement and academic success is complex and non-linear.
Incomplete Data: Student-generated data provides a potentially rich set of data; however, you need to be aware that the data is often incomplete and only a snapshot of student activity. Most of the data provide anonymised aggregate trends, collected over a 24-hour period and then presented as 24-hour, weekly, or monthly blocks of data. Also, the reports don’t take into consideration how students are engaging with their learning outside of institutional systems, for example by accessing printed material, publisher resources, YouTube, etc.
Lack of Contextualization: Usually, the collected data is not specifically contextualised for your course, nor does it take into consideration the characteristics of your cohort, the specifics of your teaching approach, or the disciplinary cognitive development you intended.
Therefore, it is important that you cast a critical eye over the data reports for your course. Evaluate the course analytics by asking questions such as:
- What is meaningful data for my course?
- What assumptions are being made with each report?
- Is there enough data to deduce meaning, and if so, to what degree of accuracy?
- How do I ensure the reports are meaningful?
To get the most from the data collected about your course, it is essential to plan for and identify the purpose for accessing the reports in the first place. This means setting clear objectives for what you hope to learn from the data and how you intend to use the information to improve student engagement and learning outcomes.
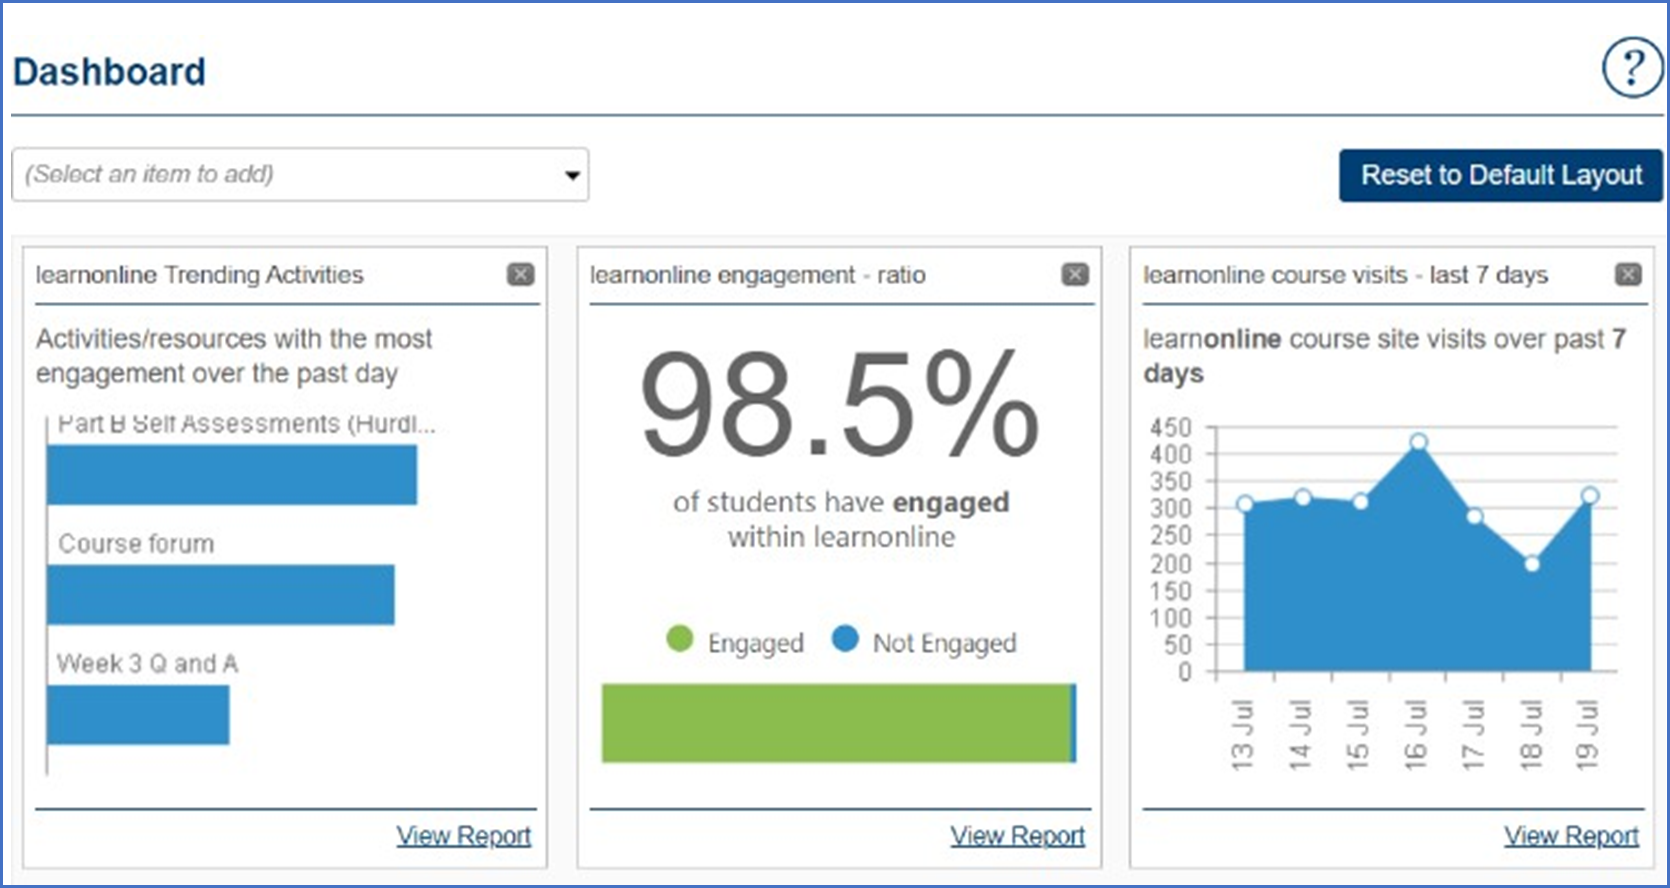
At UniSA…
Measuring online student engagement at UniSA is a straightforward activity as various analytic reports are provided on the course dashboard.
Types of Analytic Reports
At UniSA, there are three basic types of analytic reports:
- Learnonline Activities Reports: Focused on all students’ use of learnonline activities.
- Other Systems Activities Reports: Focused on all students’ use of activities in other systems (such as video recordings, reading lists, and Panopto recordings).
- Individual Student Activity Reports: Reports on any individual student’s activity across multiple course sites in a program.
All the above reports can be accessed via the Teaching Dashboard.
Accessing Reports
The tabs on your course Dashboard provide access to detailed learnonline reports as well as engagement reports for other systems (e.g., video recordings, reading lists, and Panopto recordings). They also offer you the ability to drill down to engagement data sets for individual students.
For further support on how to access and customize analytics on the Teaching Dashboard, visit the relevant resources on the TIU website and Ask Learnonline:
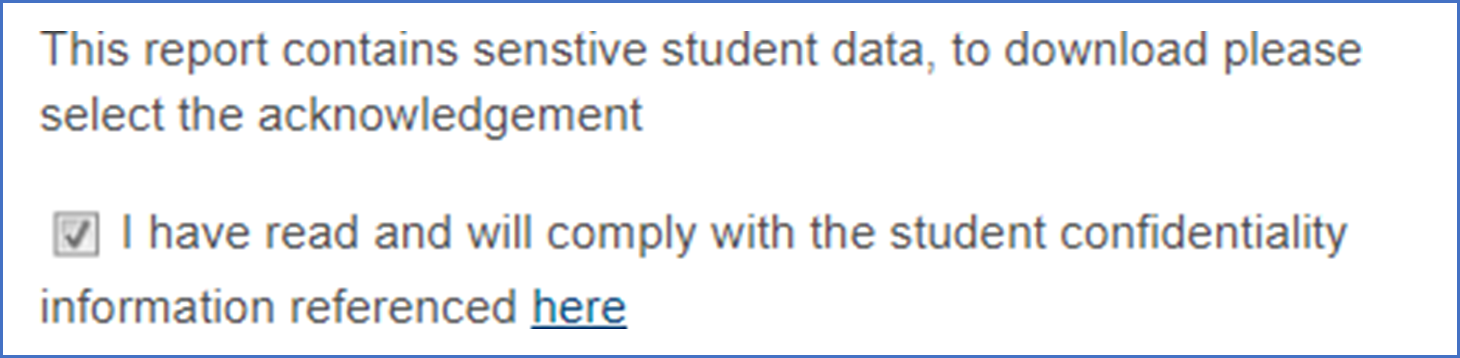
Keep in mind that reports contain sensitive information as referenced by Policy A-46.12 Confidentiality of Students’ Personal Information. Before you can download a report, you need to acknowledge this confidentiality by ticking the relevant box.
Knowledge Check – What Did You Learn?
To reinforce your understanding of using learning analytics to track students’ online engagement, you may want to answer the following questions:
What Does It All Mean for Me?
Reflecting on this chapter, consider how you can apply the principles of using learning analytics to enhance student engagement in your courses. Here is an activity to help you integrate these concepts:
Activity: Implementing Learning Analytics in Your Teaching Practice
Using the strategies discussed in this chapter, create a plan to monitor and enhance student engagement in one of your online courses. Follow these steps:
Define Your Objectives:
- Identify what you hope to learn from the engagement data and how you intend to use it to improve student engagement and learning outcomes.
Access and Analyse Engagement Reports:
- Find out what learning analytics are available in your context, for example from the LMS. See if you can access LMS activities reports, other systems activities reports, and individual student activity reports.
- Make sure to familiarise yourself with any policies or legislation regulating access to student data and privacy.
- Analyse the data to identify trends and patterns in student engagement.
Identify At-Risk Students:
- Use heat maps and engagement reports to identify students who are late to join or have yet to log in.
- Contact these students to offer support and re-engage them with the course content.
Evaluate Course Resources:
- Review video watching analytics to determine which videos are being watched and for how long.
- Consider providing alternative resources if videos are not being fully utilized.
Interpret Reading List Reports:
- Analyse the popularity of eReadings and consider the placement and narrative framing of these resources.
- Determine which readings have the most impact and adjust your selection of resources accordingly.
Engage in Continuous Improvement:
- Regularly review and update your engagement strategies based on the data collected.
- Use student feedback and engagement data to refine your course design and teaching practices.
Reflection:
After implementing your plan, reflect on the following questions:
- How did the use of learning analytics impact student engagement and learning outcomes?
- What feedback did you receive from students about the changes you implemented?
- What adjustments can you make to further enhance the learning experience and support student success?
References
Carnegie Mellon University 2016, Datalab, <https://www.cmu.edu/datalab/ (Accessed 21 July 2020)
Kuh, G, Cruce, T, Shoup, R, Kinzie, J & Gonyea, R 2008, Unmasking the effects of student engagement on first year college grades and persistence, Journal of Higher Education, vol.79, no. 5, pp. 540–563. <https://doi.org/10.1080/00221546.2008.11772116>
Rodgers, T 2008, Student engagement in the e-learning process and the impact on their grades. International Journal of Cyber Society and Education, vol. 1, no. 2, pp. 143-156, <http://academic- pub.org/ojs/index.php/IJCSE/article/view/519>.
University of South Australia 2020, Policy No: A-46.12 Confidentiality of students’ personal information, University of South Australia, viewed 15 July 2020, <https://i.unisa.edu.au/siteassets/policies-and- procedures/docs/academic/a-46-confidentiality-of-students.pdf>.
Media Attributions
- Learning analytics | All reports
- Learning Analytics | First log in
- Learning Analytics | Forum contributions
- Learning Analytics | Recording reports
- Learning Analytics | Video proportion
- Learning Analytics | Video heatmap
- Learning Analytics | Student heatmap
- Learning Analytics | Ereserve
- Learning Analytics | Ereserve views
- Private: UniSA Logo
- Learning Analytics | Teaching dashboard
- UniSA privacy tick
