8.1 Practical steps to Statistical Modelling
So, how does this all work in practical terms?
As a reminder, there is a set of steps that we generally go through when we want to use our statistical model to test a scientific hypothesis:
- Specify your question of interest
- Identify or collect the appropriate data
- Prepare the data for analysis
- Determine the appropriate model
- Fit the model to the data
- Criticize the model to make sure it fits properly
- Test the hypothesis and quantify the effect size.
Step 1: Specify Your Question of Interest
After going through something traumatic, some people have involuntary memories or flashbacks of that event. Trying to forget these memories doesn’t work well. Research suggests a better way might be to change the memory during a process called reconsolidation, which happens when we bring back a memory. Importantly, this process can weaken traumatic memories to the point where they’re not as bothersome. James and colleagues (2015)[1] wondered if doing a visual task, like playing Tetris, while memory is reconsolidating could interrupt the memory storage and make the intrusive memories happen less often.
According to the authors, the goal of their study was:
The current experiments tested whether we could ameliorate the frequency of intrusions of an already consolidated memory for a traumatic film: To do this, we asked participants to play the computer game Tetris after memory reactivation performed in the time window for disrupting reconsolidation.
Step 2: Identify or Collect the Appropriate Data
To answer their question, the researchers conducted three experiments. In our example, we will only focus on Experiment 2. Here’s what they did:
Trauma Film: Everyone watched videos of violent stuff, like someone getting hit by a van while using their phone. This was meant to create memories that would bother them. Then, they went home and noted how many bothersome memories they had in the next 24 hours. Since this was before any changes, all groups were expected to have the same amount of bothersome memories during the first 24 hours (Day 0).
Experimental Task: After this 24-hour period, they came back to the lab. The researchers split them into four groups:
- No-task control: They did a 10-minute music task.
- Reactivation + Tetris: They saw images from the trauma film to bring back the bad memories (reactivation task). After that, they did a 10-minute music task and played Tetris for 12 minutes.
- Tetris Only: They played Tetris for 12 minutes but didn’t do the reactivation task.
- Reactivation Only: They did the reactivation task but didn’t play Tetris.
There were 72 participants, with 18 in each group. Everyone noted how many bothersome memories they had over the next seven days (Days 1 to 7). After those seven days, they did a task where they saw blurry pictures from the trauma film and had to say if it triggered a bothersome memory.
Open the data file named James et al., 2015 Experiment 2 Data Set.csv and check it out.[2] Remember, you don’t have to look at all the things in there. Look for the ones that are relevant to the study.
Step 3: Prepare the Data for Analysis
First, we want to see if all the groups had the same amount of bothersome memories in the 24 hours before the Experimental Task. Let’s plot the averages of the different groups using the variable named Day_Zero_Number_of_Intrusions.
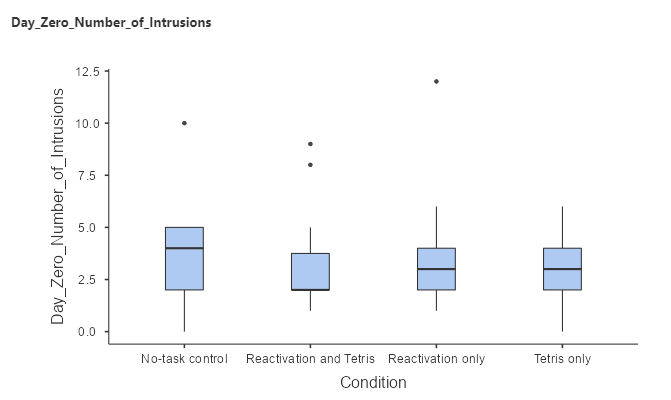
The boxplot above shows that the intrusive thoughts are relatively similar for all conditions. Remember, we expect that all groups should have the same amount of bothersome memories during the first 24 hours since this is before any changes (Day 0). This is just to ensure that all groups started with a relatively similar baseline.
However, what we really want to test is the effect of the experimental manipulation. In particular, we want to examine whether there is a significant difference between the conditions on the number of memory intrusions in the seven days following the experimental task. We will use the variable named Day_One_to_Seven_Number_of_Intrusions and visualize them to see if there are any outliers:
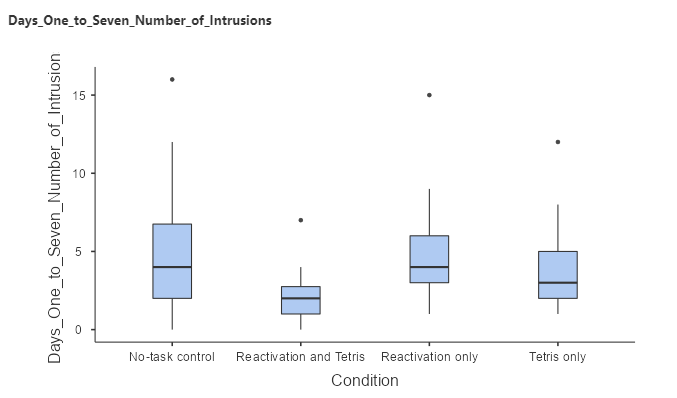
Box plots are useful to see the shape of the distributions, as shown in Figure 8.1.2. Those data look fairly reasonable – there are a couple of outliers (indicated by the dots outside of the box plots), but they don’t seem to be extreme. We can also see that the distributions seem to differ a bit in their variance, with the reactivation and Tetris showing somewhat less variability than the other groups, while the no-task control has the most variability. This means that any analyses that assume the variances are equal across groups might be inappropriate. Fortunately, the statistical model that we plan to use is fairly robust to this.
Step 4. Determine the Appropriate Model
There are several questions that we need to ask in order to determine the appropriate statistical model for our analysis.
- What kind is our outcome variable?
- Number of intrusions: continuous, roughly normally distributed
- What are we comparing?
- Number of intrusions between Day 1 to 7 across the four conditions
- GLM is appropriate
- ANOVA is also appropriate
- Generalised Linear Models or Kruskal-Wallis tests are also appropriate if there are extreme violations in assumptions for the above models.
- Are observations independent?
- Random assignment should ensure that the assumption of independence is appropriate
Step 5. Fit the Model to the Data
Let’s run an ANOVA on intrusive memories to compare it across the four conditions. Most statistical software will automatically convert a nominal variable into a set of dummy variables. A common way of specifying a statistical model is using formula notation, in which the model is specified using a formula of the form:

In this case, we want to look at the number of intrusive memories (which is stored in a variable called Day_One_to_Seven_Number_of_Intrusions ) as a function of conditions (which is stored in a variable called Condition), so we use the formula:

Here are the results from this model fitted to our data:
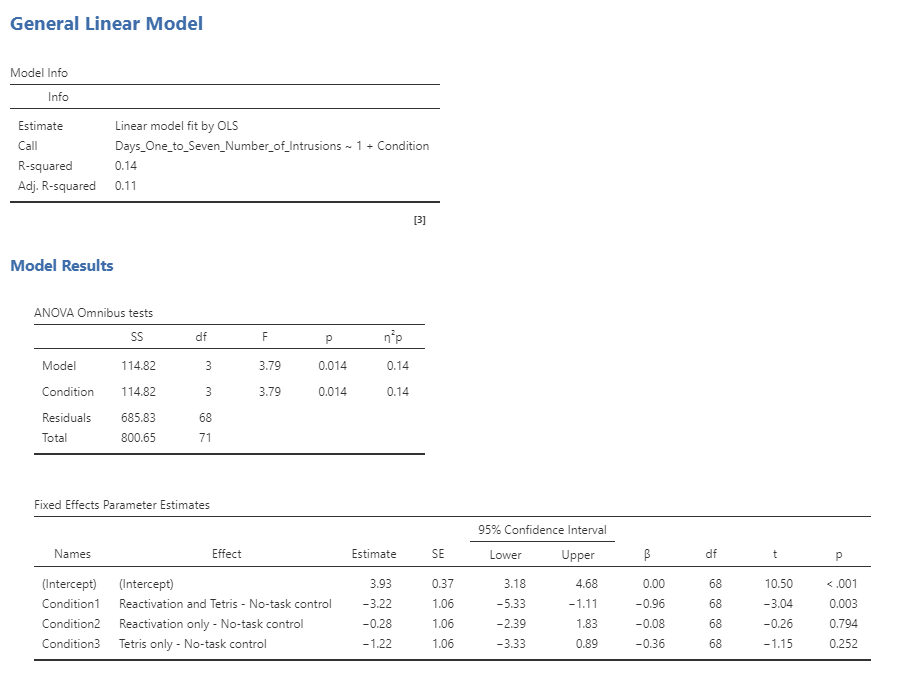
Note that the software automatically generated dummy variables that correspond to three of the four conditions, leaving the no-task control without a dummy variable. This means that the intercept represents the mean of the no-task control condition, and the other three variables model the difference between the means for each of those conditions and the mean for the no-task control condition. No-task control condition was chosen as the unmodeled baseline variable simply because it is first in alphabetical order.
Step 6. Criticise the Model to make sure it fits Properly
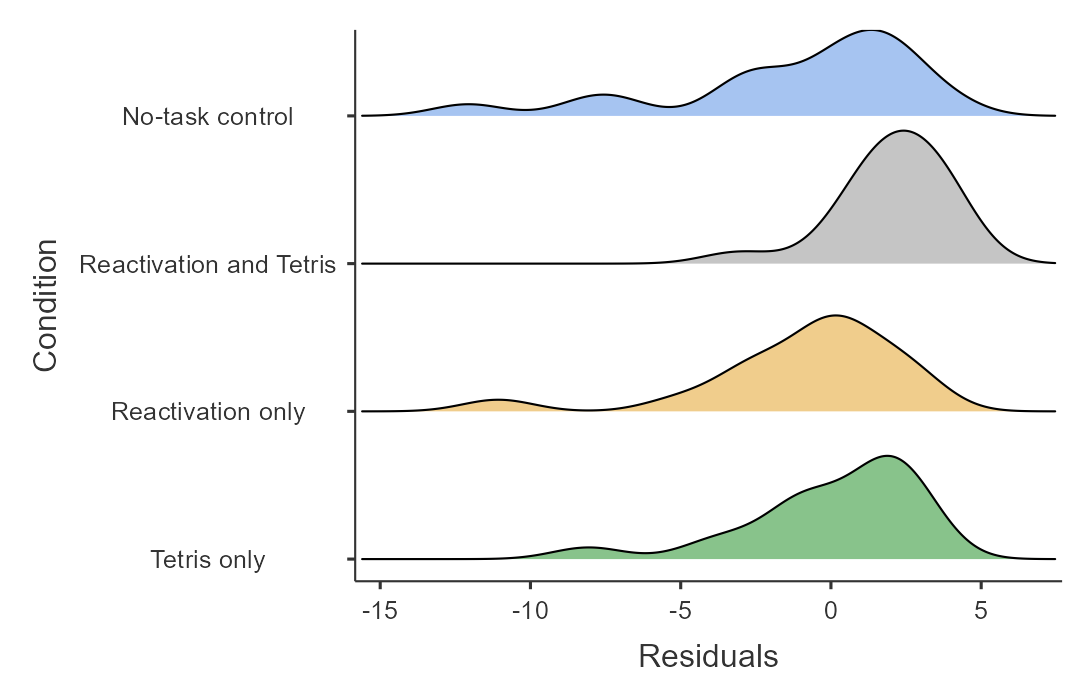
The first thing we want to do is to critique the model to make sure that it is appropriate. One thing we can do is to look at the residuals from the model. In Figure 8.1.4, we plot the residuals for each individual grouped by condition. There are some differences in the distributions of residuals across conditions but not too extreme.
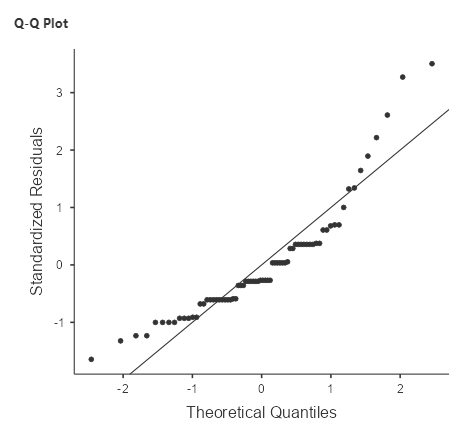
Another important assumption of the statistical tests that we apply to linear models is that the residuals from the model are normally distributed. It is a common misconception that linear models require that the data are normally distributed, but this is not the case; the only requirement for the statistics to be correct is that the residual errors are normally distributed. The right panel of Figure 8.1.5 shows a Q-Q (quantile-quantile) plot, which plots the residuals against their expected values based on their quantiles in the normal distribution. If the residuals are normally distributed then the data points should fall along the dashed line – in this case, the plot doesn’t look the best. What we want is for the residuals (denoted by the dots) to be tightly packed around a line (in other words, linear). However, given that this model is also relatively robust to violations of normality, we will go ahead and continue with our analysis.[3]
Step 7. Test the Hypothesis and Quantify the Effect Size
First let’s look back at the summary of results from the ANOVA, shown in Step 5 above. The significant F test shows us that there is a significant difference between the conditions, but we should also note that the model doesn’t actually account for much variance in the data; the overall effect size of the model (denoted by R-squared) is only 0.14, showing that the model is only accounting for 14 per cent of the variance in our outcome variable. Thus, we would not want to overinterpret this result.
The significant result in the omnibus F test also doesn’t tell us which conditions differ from which others. The table above titled Fixed Effects Parameter Estimates only compares the conditions with the no-task control condition. We can find out more by comparing means across conditions.
Planned Comparison
In the original paper, the author provided the following hypothesis (James et al., 2016):
We hypothesized that 24 hr after experimental trauma-film exposure, a group that completed a reactivation task for memory of the film (to initiate reconsolidation) followed by Tetris game play would have a lower frequency of subsequent intrusions, compared with control groups that completed only one or none of those tasks.
Given that the authors have specifically wanted to compare the reactivation task with Tetris with the other conditions, we will create a new variable in jamovi that sets the reactivation task with Tetris as the baseline that we will measure the other conditions against. We will use the transform function to set Reactivation and Tetris as 0, no-task control as 1, reactivation only as 2 and Tetris only as 3. Let’s run the GLM again using the dummy coded variable and make sure that under Factors Coding, simple is chosen for the comparison.
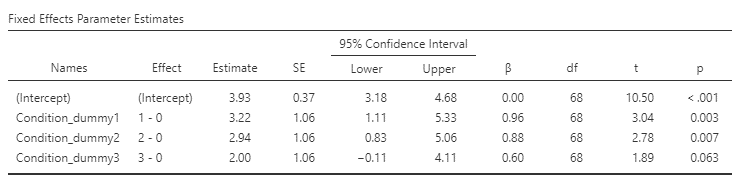
From the table above, we can see that the frequency of intrusive memories for participants under the no-task control and reactivation-only conditions was significantly different from the reactivation task with the Tetris condition.
Post-Hoc Comparisons
For the following analysis, we will differ from the original paper to show you how you would conduct the analysis if they did not provide a specific hypothesis.
Because we are doing several comparisons, we also need to correct those comparisons, which is accomplished using a procedure known as the Tukey method, which can be requested by going into the Post Hoc Tests, putting the condition into the variable window and checking Tukey under correction.
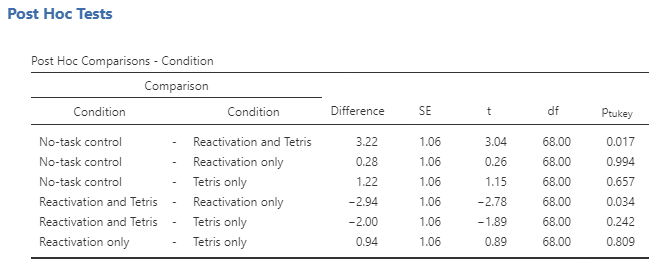
The column titled Ptukey in the rightmost column shows us which of the groups differ from one another, using a method that adjusts for the number of comparisons being performed. Anything below the p-value of .05 is significantly different from one another. This shows that the pairing of no-task control and reactivation and Tetris as well as reactivation and Tetris and reactivation only were the only pairs that significantly differ from one another.
What about Possible Confounds?
If we look more closely at the James et al. paper, we will see that they also collected data on attention paid to the film. Let’s plot this data on a bar plot for each condition.
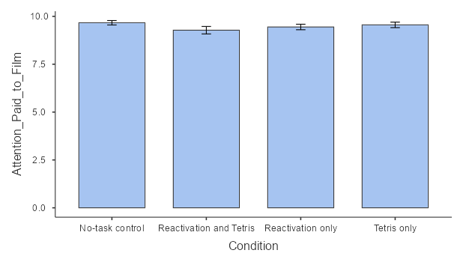
Looking at the data it seems that the rates were consistent across the conditions. If the data is quite different across groups, then we may be concerned that these differences could have affected the results of the intrusive memory outcomes. In our case, this is not an issue. However, it is also good to check potential confounding variables that may be affecting your data.
Getting Help
Whenever one is analysing real data, it’s useful to check your analysis plan with a trained statistician, as there are many potential problems that could arise in real data. In fact, it’s best to speak to a statistician before you even start the project, as their advice regarding the design or implementation of the study could save you major headaches down the road. Most universities have statistical consulting offices that offer free assistance to members of the university community. Understanding the content of this book won’t prevent you from needing their help at some point, but it will help you have a more informed conversation with them and better understand the advice that they offer.
Chapter attribution
This chapter contains material taken and adapted from Statistical thinking for the 21st Century by Russell A. Poldrack, used under a CC BY-NC 4.0 licence.
Screenshots from the jamovi program. The jamovi project (V 2.2.5) is used under the AGPL3 licence.
- James, E. L., Lau-Zhu, A., Tickle, H., Horsch, A., & Holmes, E. A. (2015). Playing the computer game Tetris prior to viewing traumatic film material and subsequent intrusive memories: Examining proactive interference. Journal of Behavior Therapy and Experimental Psychiatry, 53, 25-33. https://doi.org/10.1016/j.jbtep.2015.11.004 ↵
- This example came from OpenStatsLab. For more practical exercises such as this one, visit: https://sites.google.com/view/openstatslab/about ↵
- Some may argue that these violations suggest that we should not fit the GLM in our data. This is fine – we can instead conduct a Generalised Linear Model if you are concerned about these violations. Another option is to conduct the non-parametric equivalent of ANOVA, which is the Kruskal-Wallis test. ↵
