2.4 The Spreadsheet
In jamovi, data is represented in a spreadsheet with each column representing a “variable” and each row representing a “case” or “participant”.
Variables
The most commonly used variables in jamovi are “data variables”, these variables simply contain data either loaded from a data file or typed in by the user. Data variables can be one of several measurement levels.
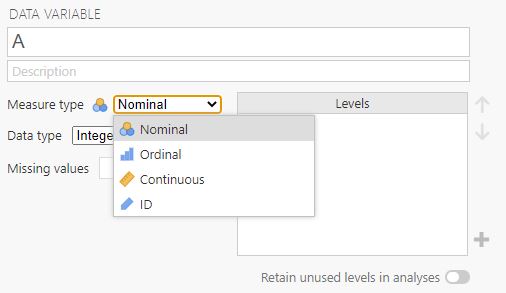
These levels are designated by the symbol in the header of the variable’s column. Let’s discuss each measurement level below:
- The ID variable type is unique to jamovi. It’s intended for variables that contain identifiers that you would rarely want to analyse, for example, a person’s name, or a participant ID. Specifying an ID variable type can improve performance when interacting with very large data sets.
- Nominal variables are for categorical variables which are text labels, for example, a column called Gender with the values Male and Female would be nominal, as would a person’s name. Nominal variable values can also have a numeric value. These variables are used most often when importing data that codes values with numbers rather than text. For example, a column in a dataset may contain the values 1 for males and 2 for females. It is possible to add nice “human-readable” labels to these values with the variable editor (more on this later).
- Ordinal variables are like Nominal variables, except the values have a specific order. An example of this is ranking (e.g., first place, second place, last place).
- Continuous variables are variables that exist on a continuous scale. Examples might be height or weight. This is also referred to as the “Interval” or “Ratio scale”.
In addition, you can also specify different data types: variables have a data type of either “Text”, “Integer” or “Decimal”.
Changing Data from One Level to Another
Sometimes you want to change the variable level. This can happen for all sorts of reasons. Sometimes when you import data from files, it can come to you in the wrong format. Numbers sometimes get imported as nominal, text values. Dates may get imported as text. ParticipantID values can sometimes be read as continuous: nominal values can sometimes be read as ordinal or even continuous. There’s a good chance that sometimes you’ll want to convert a variable from one measurement level into another one. Or, to use the correct term, you want to coerce the variable from one class into another.
Earlier we saw how to specify different variable levels, and if you want to change a variable’s measurement level then you can do this in the jamovi data view for that variable. Just click the check box for the measurement level you want – continuous, ordinal, or nominal.
When starting with a blank spreadsheet and typing values in, the variable type will change automatically depending on the data you enter. This is a good way to get a feel for which variable types go with which sorts of data. Similarly, when opening a data file, jamovi will try and guess the variable type from the data in each column. In both cases, this automatic approach may not be correct, and it may be necessary to manually specify the variable type with the variable editor.
The variable editor can be opened by selecting “Setup” from the data tab or by double-clicking on the variable column header. The variable editor allows you to change the name of the variable and, for data variables, the variable type, the order of the levels, and the label displayed for each level. Changes can be applied by clicking the “tick” at the top right. The variable editor can be dismissed by clicking the “Hide” arrow.
New variables can be inserted or appended to the data set using the “add” button from the data ribbon. The “add” button also allows the addition of computed variables.
Computed Variables
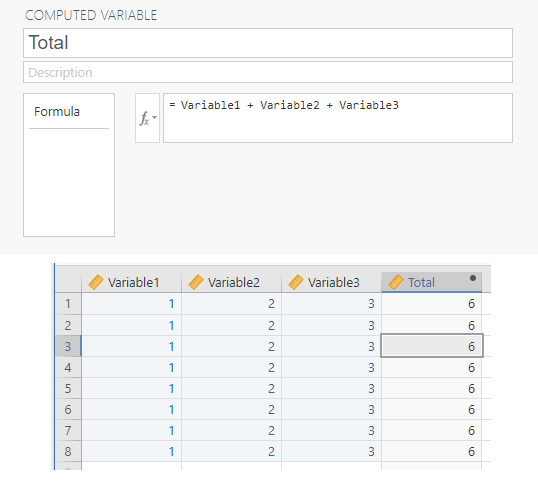
Computed variables are those which take their value by performing a computation on other variables. Computed variables can be used for a range of purposes, including log transforms, z-scores, sum scores, negative scoring and means.
Computed variables can be added to the data set with the “add” button available on the data tab. This will produce a formula box where you can specify the formula. The usual arithmetic operators are available. Some examples of the common formulas we use in psychological research include:
Sum of the variables to get a total score = Variable1 + Variable2 + Variable3
Average of the variables to get an average score = Mean(Variable1, Variable2, Variable3)
Filter
The filtering function in jamovi enables you to eliminate unwanted rows from your analysis. This includes filtering by specific criteria, such as only including survey responses from individuals who provided consent for their data to be used, excluding a specific age group, for example. Alternatively, you may choose to filter out extreme scores, such as those more than three standard deviations from the mean. These filters are constructed using jamovi’s computed variable formula system, which permits the creation of highly intricate formulas.
Chapter attribution
This chapter contains material taken and adapted from Learning statistics with jamovi by Danielle J. Navarro and David R. Foxcroft, used under a CC BY-SA 4.0 licence.
Screenshots from the jamovi program. The jamovi project (V 2.2.5) is used under the AGPL3 licence.
