2.3 Analyses
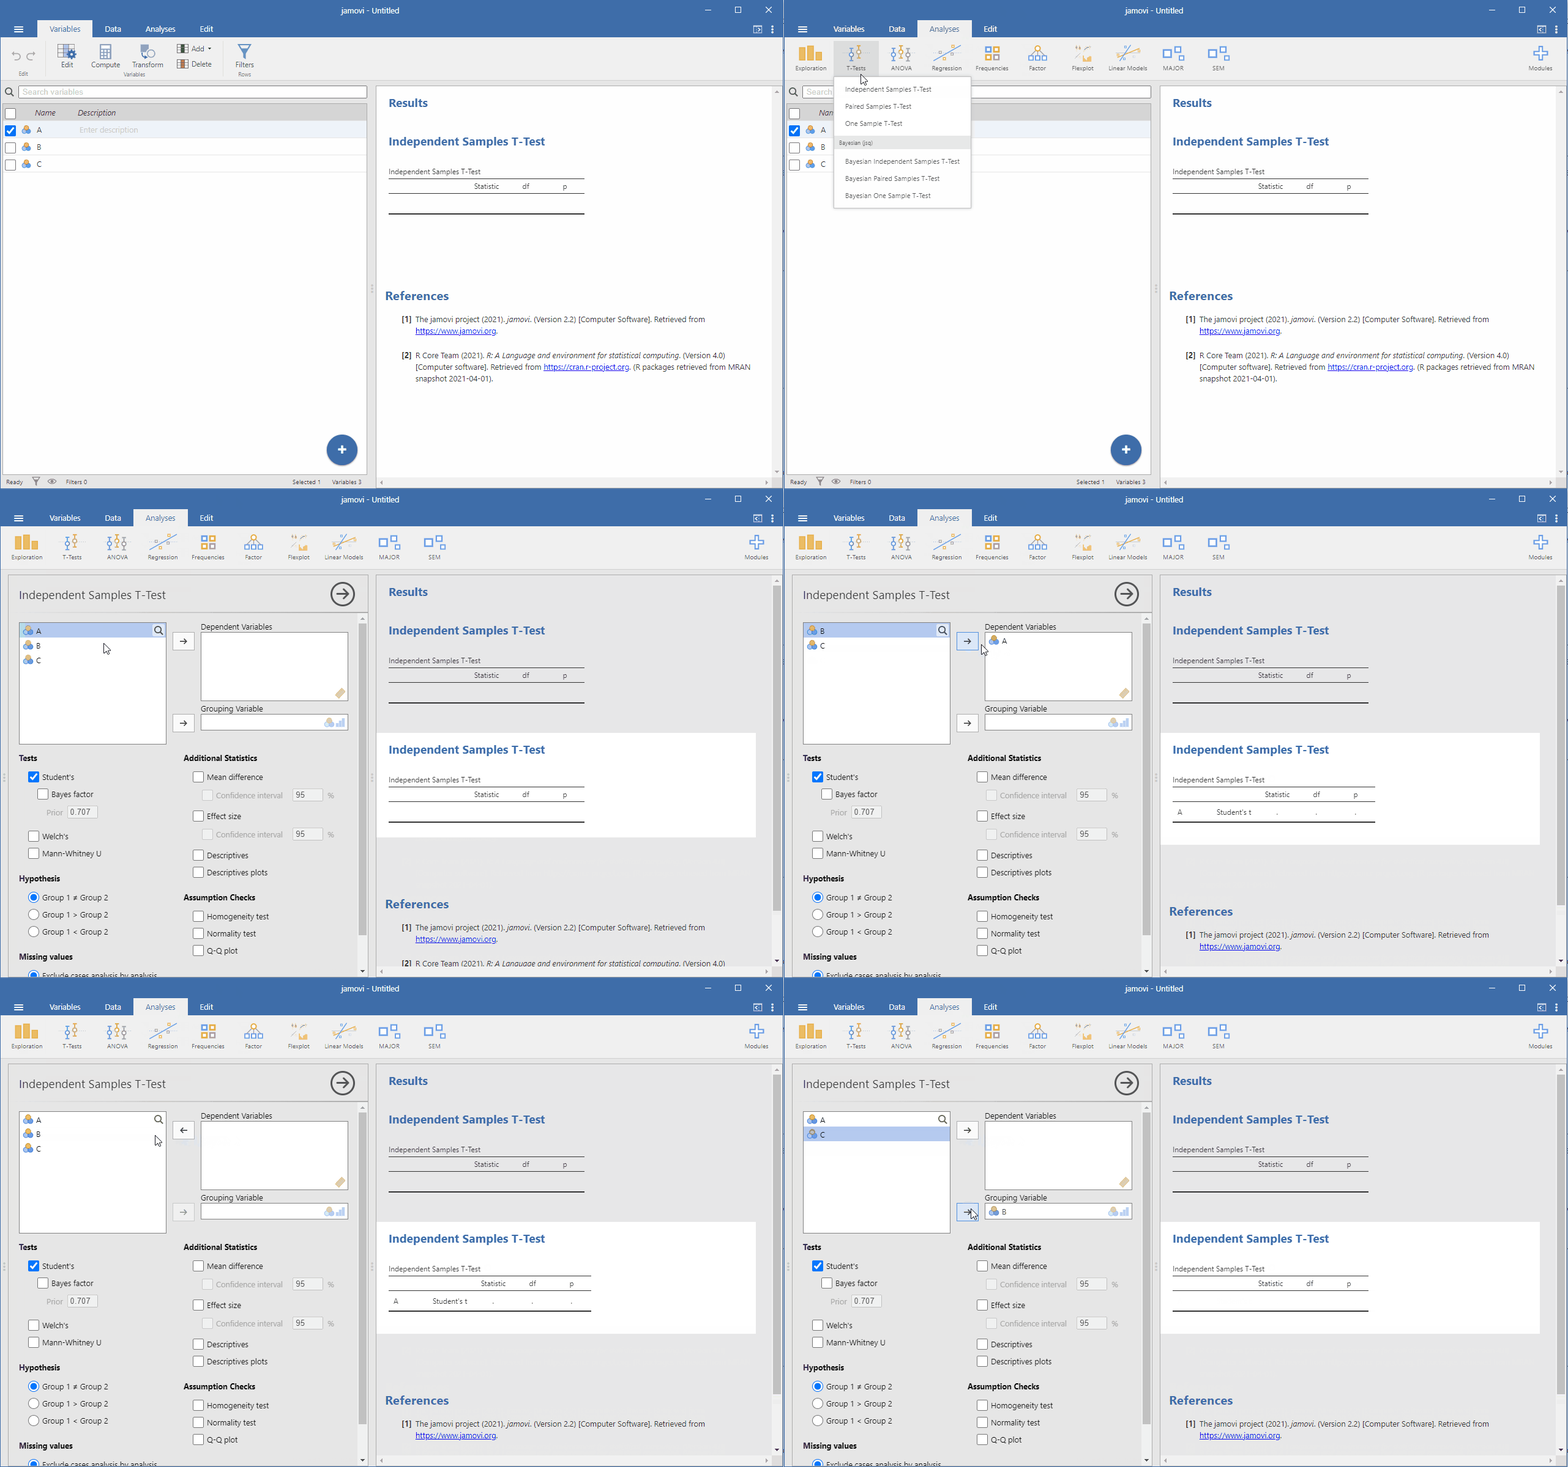
To begin your analysis, select Analyses from the top menu. From there, choose the type of statistical analysis you wish to perform, such as t-tests, ANOVA and regression (as shown in the figure below). Upon selecting Analysis, an “options panel” specific to that analysis will become available. This panel allows you to allocate different variables to different parts of the analysis and choose different settings. As you make changes, the results of your analysis will appear in real time on the right-hand “Results panel”.
When you have the analysis set up correctly, you can dismiss the analysis options by clicking the arrow to the top right of the options panel. If you wish to return to these options, you can click on the results that were produced. In this way, you can return to any analysis that you (or say, a colleague) created earlier.
If you decide you no longer need a particular analysis, you can remove it with the results context menu. The analysis can be removed by right-clicking on the analysis results to bring up a menu, and then selecting Analysis, and then Remove.

Copy and Paste Feature
The jamovi program produces nice American Psychological Association (APA) formatted tables and attractive plots. It is often useful to be able to copy and paste these, perhaps into a Word document, or into an email to a colleague. To copy results right-click on the object of interest and from the menu select exactly what you want to copy. The menu allows you to choose to copy only the image or the entire analysis. Selecting “copy” copies the content to the clipboard and this can be pasted into other programs in the usual way. You can practice this later on when we do some analyses.
Chapter attribution
This chapter contains material taken and adapted from The jamovi project by Sebastian Jentschke, used under a CC BY-NC 4.0 licence.
Screenshots from the jamovi program. The jamovi project (V 2.2.5) is used under the AGPL3 licence.

