5.6 Z Scores
Having characterised a distribution in terms of its central tendency and variability, it is often useful to express the individual scores in terms of where they sit with respect to the overall distribution. Let’s say that we are interested in characterising the relative level of crashes across different states, in order to determine whether NSW is a particularly dangerous place for drivers.
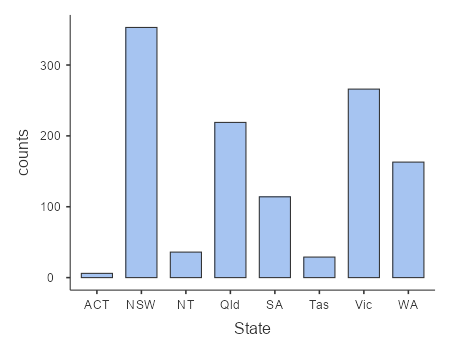
Using our crash_data_ardd dataset, we can see that NSW had the highest number of fatalities from crashes in 2019.
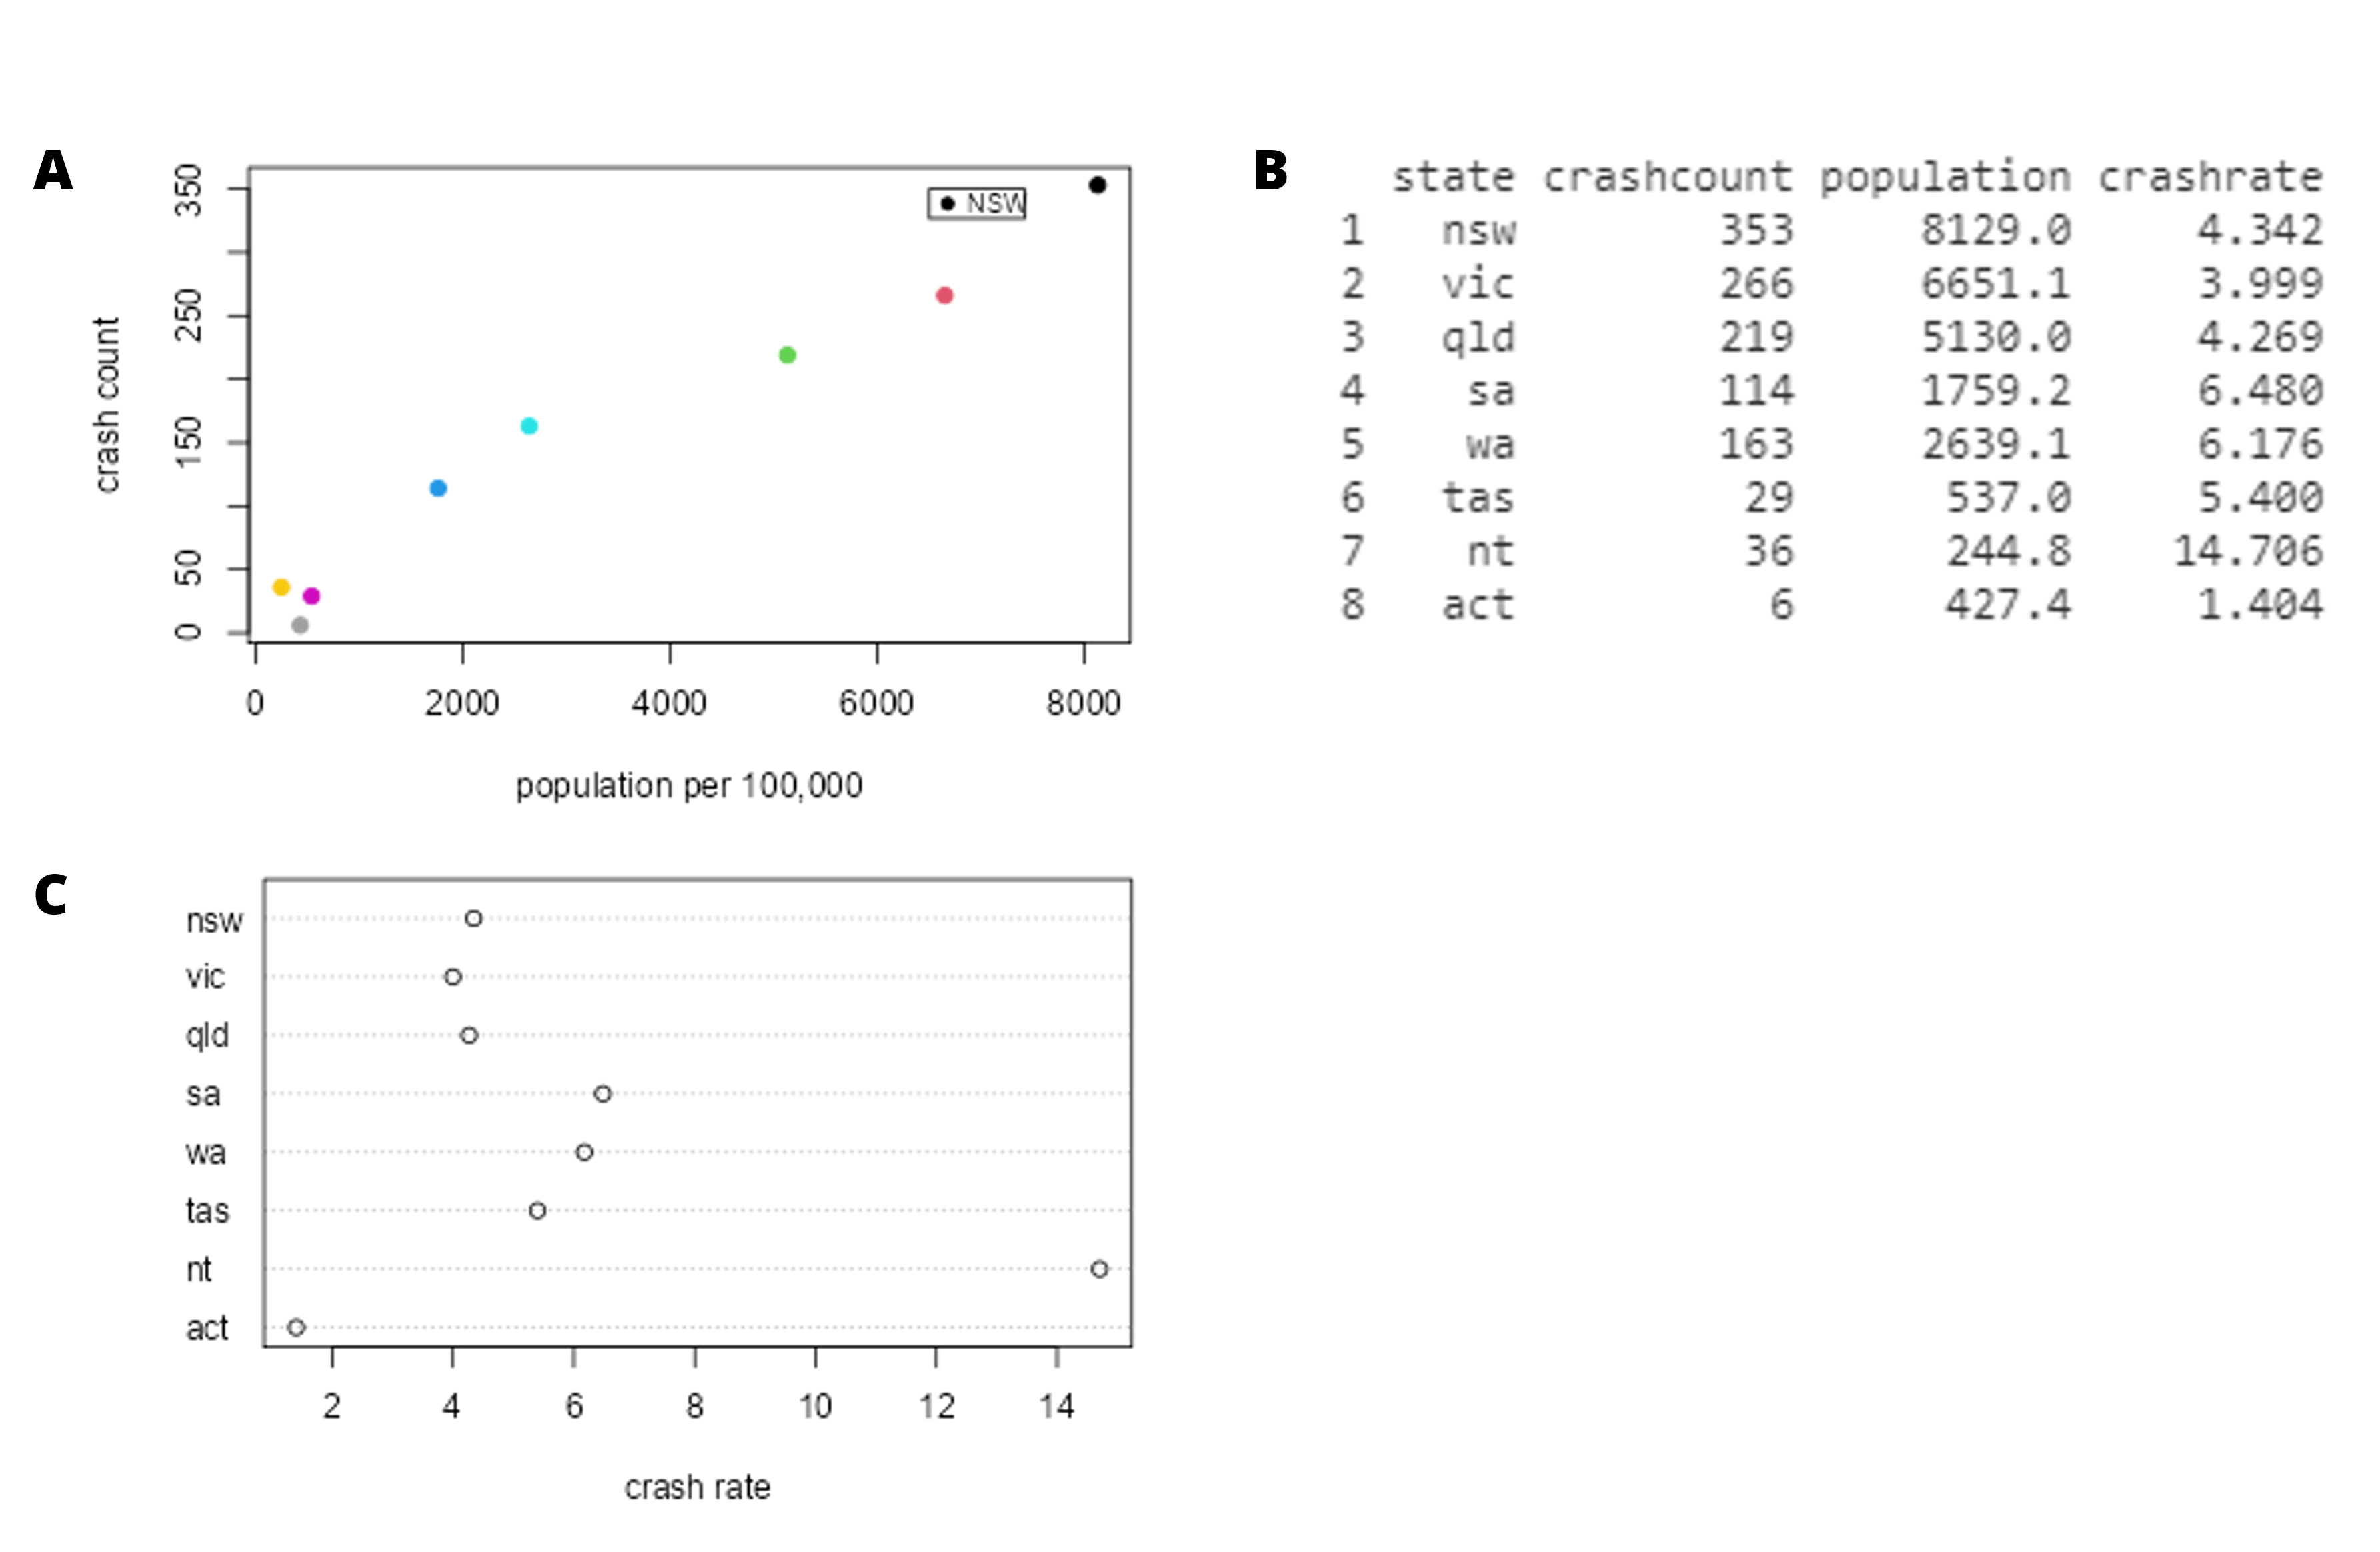
It may have occurred to you, however, that NSW also has the largest population of any state in Australia, so it’s reasonable that it will also have a larger number of crashes. If we plot the number of crashes against the population of each state (see Figure 5.6.2-A), we see that there is a direct relationship between the two variables. Instead of using the raw numbers of crashes, we should instead use crashes per capita, which we obtain by dividing the number of crashes per state by the population of each state. The original ARDD dataset did not have this information so I had to source this data from the Australian Bureau of Statistics.[1] Looking at the right panel of Figure 5.6.2 (B), we can see that NSW is not too bad after all. NSW has a crash rate of 4.342, which is slightly lower than the average crash rate of 5.847 across the states and territories. But what if we want to get a clearer view of how far it is from the rest of the distribution?
The z-score allows us to express data in a way that provides more insight into each data point’s relationship to the overall distribution. It is calculated by subtracting the mean  from the individual data point and then dividing by the standard deviation
  .
.

Intuitively, you can think of a z-score as telling you how far away any data point is from the mean, in units of standard deviation. The z-score is positive if the value is above the mean and negative if it is below the mean. Calculating z-scores, allows researchers to calculate the probability of a score occurring within a standard normal distribution, and enables us to compare two scores that are from different samples or scales (which may have different means and standard deviations). Because of this, it has many practical applications. For example, z-scores can be used to compare the performance of students on different tests, even if the tests have different difficulty levels.
Z-scores are also used in many statistical tests. For example, the t-test is used to test for a difference in means between two groups (which we will learn more about later). The z-test is used to test for a difference in proportion between two groups. Both of these tests use z-scores to calculate the p-value, which is a measure of the statistical significance of the result.
We can compute the z-scores of the crash rates and let’s plot the z-scores against the original crash rate, as shown in Figure 5.6.3. As you can see, the scatterplot shows us that the process of z-scoring doesn’t change the relative distribution of the data points (visible in the fact that the original data and z-scored data still fall on a straight line when plotted against each other) – it just shifts them to have a mean of zero and a standard deviation of one. This provides us with a slightly more interpretable view of the data. If we look at Figure 5.6.3 again, we can see that NSW’s crash rate is quite similar to the other states. Instead, we should be more worried about the Northern Territory (depicted with the yellow dot), as the state has a crash rate that is roughly two standard deviations above the mean.[2]

Chapter attribution
This chapter contains material taken and adapted from Statistical thinking for the 21st Century by Russell A. Poldrack, used under a CC BY-NC 4.0 licence.
- https://www.abs.gov.au/statistics/people/population/national-state-and-territory-population/dec-2019 ↵
- ABC reports that the Northern Territory leads in road deaths per capita. To read more, visit https://www.abc.net.au/news/2022-09-08/nt-road-toll-death-rate-four-times-national-average/101383908 ↵
