1.1 What can Statistics do for us?
There are four main things we can do with statistics, which we already do on a regular basis:
- Describe: The world is complex, and we often need to simplify it to understand it.
- Explain: We can use data to explain a phenomenon.
- Decide: We also often need to make decisions based on data, usually in the face of uncertainty.
- Predict: We often wish to make predictions about new situations based on our knowledge of previous situations.
Statistical thinking is a tool that can help us achieve these goals. As you read through the points above, you may have noticed that we already do these behaviours in our everyday lives. Every day, we describe things (e.g., the weather is not great today), explain things (e.g., the food was salty because I put too much salt while cooking it), make decisions (e.g., I will take this route because it will be shorter), and predict things (e.g., the food in this restaurant is going to be great because it’s been recommended to me by many people). The only difference with statistical thinking is that we use data as evidence for these everyday behaviours.
Let’s Look at an Example
To illustrate this point, let’s take a common question that many people are interested in: How do we decide what’s healthy to eat? There are many different sources of guidance, from government dietary guidelines to diet books and different bloggers.
Now, let’s focus on a specific question: Is saturated fat in our diet a bad thing?
One way to answer this question is through common sense. If we eat fat, it’s going to turn into fat in our bodies, right? And we’ve all seen photos of arteries clogged with fat, so eating fat is going to clog our arteries, right?
Another way to answer this question is by listening to authority figures. For example, the third point under the Australian Dietary Guidelines states: “Limit intake of foods high in saturated fat such as many biscuits, cakes, pastries, pies, processed meats, commercial burgers, pizza, fried foods, potato chips, crisps and other savoury snacks.”[1][2]
Finally, we might look at actual scientific research. Let’s start by looking at a large study called the long-running Prospective Urban and Rural Epidemiological study aka the PURE study, which has examined diets and health outcomes (including death) in more than 135,000 people from 18 different countries. In one of the analyses of this dataset (published in The Lancet in 2017 by Dehghan et al., 2017),[3] the PURE investigators reported an analysis of how intake of various classes of macronutrients (including saturated fats and carbohydrates) was related to the likelihood of dying during the time that people were followed. People were followed for a median of 7.4 years.
Figure 1.1.1 below plots some of the data from the study (extracted from the paper), showing the relationship between the intake of both saturated fats and carbohydrates and the risk of dying from any cause.
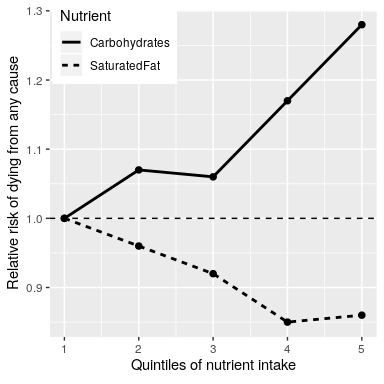
This plot is based on 10 numbers. To obtain these numbers, the researchers split the group of 135,335 study participants (which we call the “sample”) into five groups (“quintiles”) after ordering them in terms of their intake of either of the nutrients; the first quintile contains the 20% of people with the lowest intake, and the 5th quintile contains the 20% with the highest intake. The researchers then computed how often people in each of those groups died during the time they were being followed. The figure expresses this in terms of the relative risk of dying in comparison to the lowest quintile: If this number is greater than 1 it means that people in that group are more likely to die than the people in the lowest quintile, whereas if it’s less than one it means that people in that group are less likely to die than the people in the lowest quintile.
The figure is pretty clear: People who ate more saturated fat were less likely to die during the study, with the lowest death rate seen for people who were in the fourth quintile (that is, who ate more fat than the lowest 60% but less than the top 20%). The opposite is seen for carbohydrates; the more carbs a person ate, the more likely they were to die during the study. This example shows how we can use statistics to describe a complex dataset in terms of a much simpler set of numbers; if we had to look at the data from each of the study participants at the same time, we would be overloaded with data and it would be hard to see the pattern that emerges when they are described more simply.
The numbers in Figure 1.1.1 seem to show that deaths decrease with saturated fat and increase with carbohydrate intake, but we also know that there is a lot of uncertainty in the data; there are some people who died early even though they ate a low-carb diet, and, similarly, some people who ate a ton of carbs but lived to a ripe old age. Given this variability, we want to decide whether the relationships that we see in the data are large enough that we wouldn’t expect them to occur randomly if there was not truly a relationship between diet and longevity.
Statistics provide us with the tools to make these kinds of decisions, and often people from the outside view this as the main purpose of statistics. But as we will see throughout the book, this need for black-and-white decisions based on fuzzy evidence has often led researchers astray.
We can also make predictions about future outcomes based on the available data that we have. For example, a life insurance company might want to use data about a particular person’s intake of fat and carbohydrate to predict how long they are likely to live. An important aspect of prediction is that it requires us to generalise from the data we already have to some other situation, often in the future. However, if our conclusions were limited to the specific people in the study at a particular time, then the study would not be very useful. In general, researchers must assume that their particular sample is representative of a larger population, which requires that they obtain the sample in a way that provides an unbiased picture of the population. For example, if the PURE study had recruited all of its participants from religious sects that practice vegetarianism, then we probably wouldn’t want to generalise the results to people who follow different dietary standards.
Chapter attribution
This chapter contains material taken and adapted from Statistical thinking for the 21st Century by Russell A. Poldrack, used under a CC BY-NC 4.0 licence.
- You can read the guidelines here: https://www.eatforhealth.gov.au/sites/default/files/2022-09/n55a_australian_dietary_guidelines_summary_131014_1.pdf ↵
- You might hope that these guidelines would be based on good science, and in some cases they are, but as Nina Teicholz outlined in her book Big Fat Surprise (Teicholz 2014), this particular recommendation seems to be based more on the dogma of nutrition researchers than on actual evidence. ↵
- Dehghan, M., Mente, A., Zhang, X., Swaminathan, S., Li, W., Mohan, V., ... Garcia, R. (2017). Associations of fats and carbohydrate intake with cardiovascular disease and mortality in 18 countries from five continents (PURE): A prospective cohort study. The Lancet, 390(10107), 2050-2062. https://doi.org/10.1016/S0140-6736(17)32252-3 ↵
