1.13 Additional problems
1.13.1
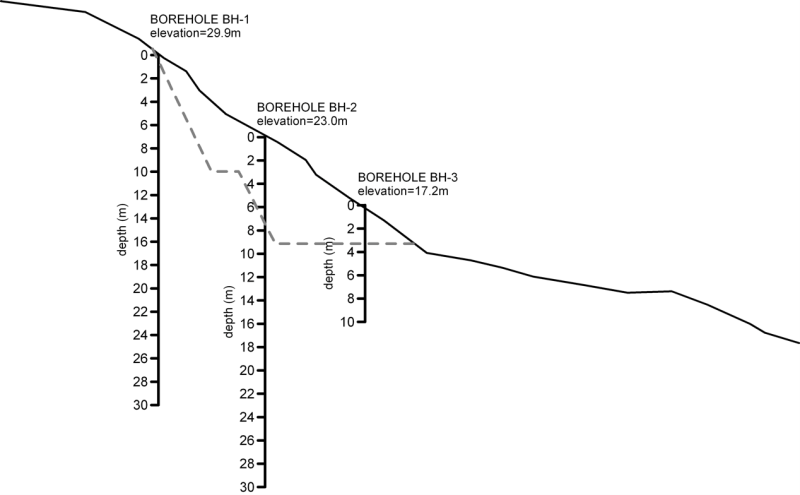
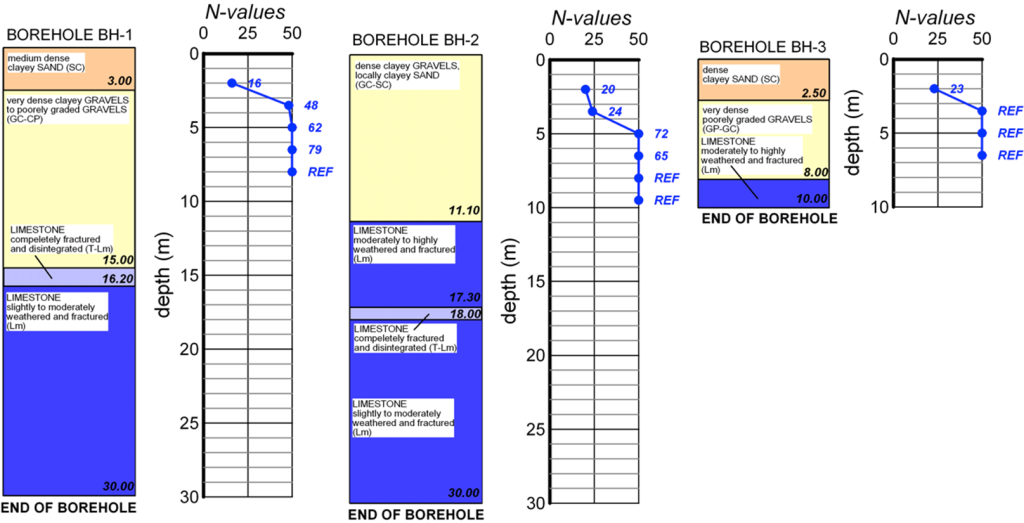
For the design of a cut slope (grey dashed line), 3 boreholes were drilled. The geological description of the encountered formations, their USCS classification and the SPT test results are provided below. Use the canvas to create a geotechnical model of the area to be introduced in the slope stability calculations, and propose the necessary parameters to be employed in the corresponding stability analyses.
Answer:
Layer I: Dense clayey sand (SC) φ′≈34°, γ=18 to 20 kN/m3
Layer II: Very dense clayey gravels, poorely graded (GC-GP) φ′≈40° to 43°, γ=18 to 20 kN/m3
Layer III: Fault zone: infinite strength for slope stability analyses
Layer IV: Slightly to moderately weathered limestone (Lm): infinite strength for slope stability analyses
1.13.2
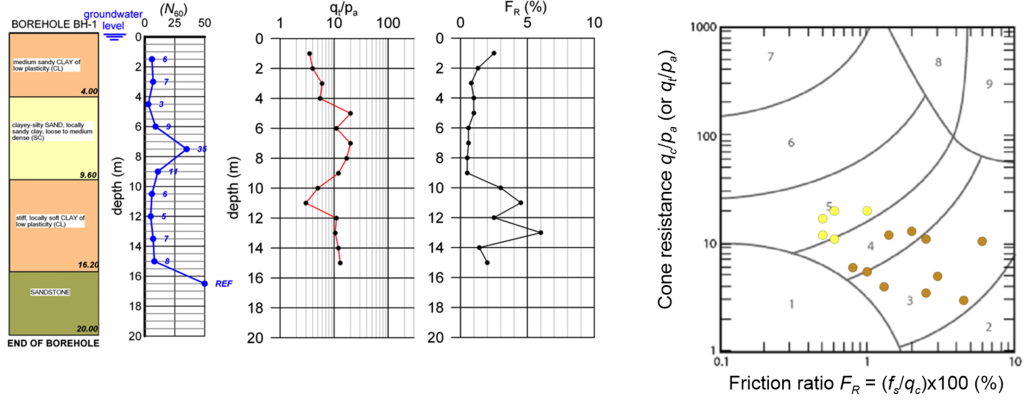
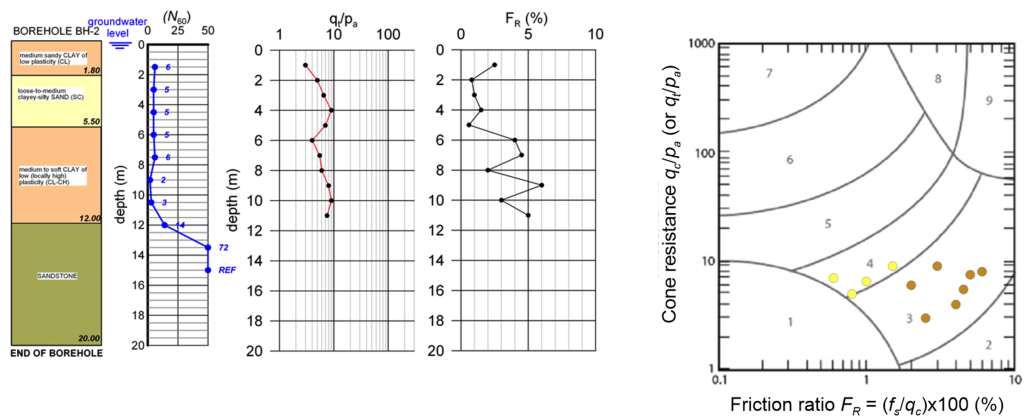
For the design of the deep foundation of a tall building, two (2) sampling boreholes were drilled and two (2) CPT soundings were performed. Results of the geotechnical investigation revealed a (more-or-less) consistent geotechnical profile: a medium-to-stiff low plasticity (PI ≈ 20%) clay formation prevails, interrupted by a loose-to-medium silty-clayey sand layer. The bedrock, a sandstone formation is encountered at depths 12.0 to 16.0 m.
Use the in situ SPT and CPT test results, combined with the provided empirical relations/charts, to determine the characteristic undrained shear strength (Su) of the clay layer and the effective friction angle of the sand layer (φ′). Assume the bulk unit weight of the clay/sand layers to be constant γ = 17 kN/m3.
| CPT1 | CPT2 | ||||
|---|---|---|---|---|---|
| Depth (m) | qt/pa | FR (%) | Depth (m) | qt/pa | FR (%) |
| 1 | 3.5 | 2.5 | 1 | 3 | 2.5 |
| 2 | 4 | 1.3 | 2 | 5 | 0.8 |
| 3 | 6 | 0.8 | 3 | 6.5 | 1 |
| 4 | 5.5 | 1 | 4 | 9 | 1.5 |
| 5 | 20 | 1 | 5 | 7 | 0.6 |
| 6 | 11 | 0.6 | 6 | 4 | 4 |
| 7 | 20 | 0.6 | 7 | 5.5 | 4.5 |
| 8 | 17 | 0.5 | 8 | 6 | 2 |
| 9 | 19 | 0.5 | 9 | 8 | 6 |
| 10 | 5 | 3 | 10 | 9 | 3 |
| 11 | 3 | 4.5 | 11 | 7.5 | 5 |
| 12 | 11 | 2.5 | |||
| 13 | 10.5 | 6 | |||
| 14 | 12 | 1.4 | |||
| 15 | 13 | 2 | |||
Answer:
Clay layer: Su = 20 kPa for depth z<4m and Su = 20+2(z-6) kPa for depth z>6m
Sand layer: φ′ = 30o
