1.10 The Flat Dilatometer (DMT) Test
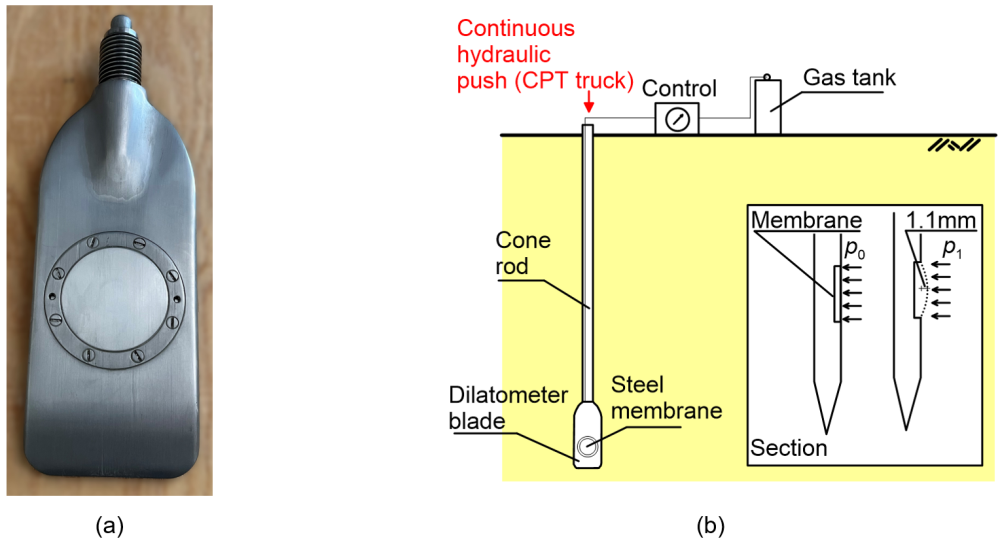
The flat dilatometer test is a soil testing method used to obtain a range of soil parameters, predominantly the in situ lateral soil stress and stiffness of sandy and clayey soils (Marchetti et al. 2001). The standard method of performing flat dilatometer tests is described in the ASTM D6635 standard. It consists of pushing a stainless-steel blade, on which a 60-mm steel membrane (Figure 1.38a) is mounted, into the soil and measuring the gas pressure required to begin moving the membrane relatively to its surrounding soil (lift-off or A-pressure) and the gas pressure required to move the centre of the membrane by 1.1 mm against the soil (B-pressure). Both measurements are taken within about 1 min. Following calibration to account for membrane stiffness, the pressure readings A and B are corrected to find the pressure values p0 and p1 acting on the membrane from the soil. During a DMT sounding pressure readings are obtained at various depths, spaced typically 200 mm apart.
One of the key parameters interpreted from DMT measurements is the horizontal stress index KD, defined as:
(1.36)
where p0 is the calibrated lift-off pressure (see Figure 1.38b); u0 is the hydrostatic pore pressure at the depth of testing; σ′z0 is the geostatic vertical effective stress at the same depth.
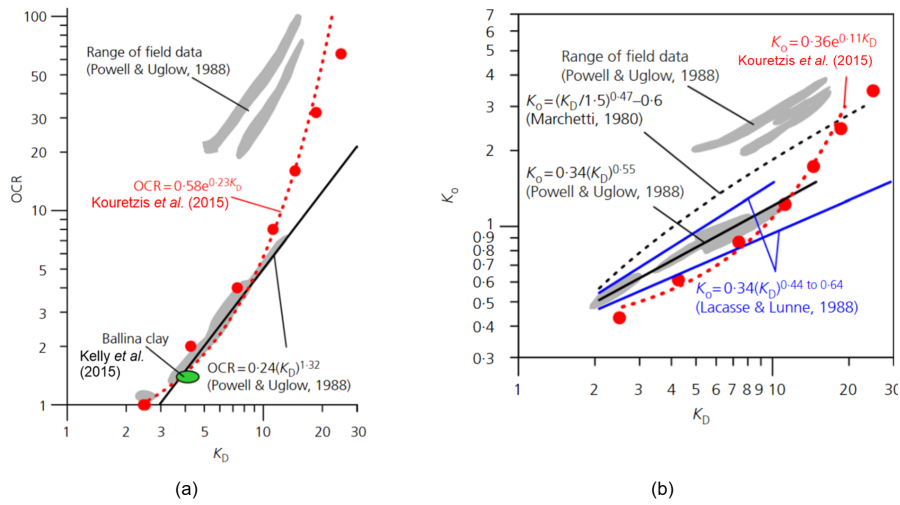
The horizontal stress index coefficient is rigorously correlated with soil stress history, therefore can be used to estimate the overconsolidation ratio OCR, and subsequently the earth pressure coefficient at-rest (K0), which is particularly difficult to measure with other in situ testing methods. Of course, under ideal conditions where blade penetration would not introduce any soil disturbance, the horizontal stress index would be equal to the earth pressure coefficient at-rest.
However, this is never the case. Figure 1.39 presents certain popular expressions that link KD measured in clay with OCR and K0, together with field data from overseas (Powell and Uglow 1988) and Australia (Ballina clay, Kelly et al. 2015). Arguably OCR and K0 values interpreted by means of DMT measurements are more reliable compared to those interpreted by means of CPT measurements (Chapter 1.8.4), due to the nature of the DMT.