Chapter 6 – Stock market and stock valuation
Chapter Learning Objectives
After completing this chapter, students should be able to
- Understanding the Basics of Stocks and Stock Returns
- Applying the Dividend Discount Model (DDM) to Value Stocks
- Getting to know the landscape of the World’s and the Australian stock market
- Exploring investment banking functions and initial public offering (IPO)
6.1 Overview of the share market
Suppose you have $10,000 to invest in 1989 and you decide to put it in the share market. If the average annual rate of return is 8% p.a., by 2023, you would end up with $147,850. While Australia is an island, separated from the rest of the world, our share market does not seem to behave that way. In fact, our market tracks the trend in the global market very closely and since 2002, we seem to perform better than the global market.
If we are doing so well, why investors from the rest of the world does not seem to pour money into our market? Have a look at this chart from Visual Capitalist showing the break down of the global equity market. Here we can see is that not all markets are created equal. Some are much bigger and hence considered more important than others. The construction of the global market does not involve putting the same amount of money into each market. Rather, market with larger size receives a higher weight.
Once we zoom into the performance of a given stock market, the same feature holds. That is, not all stocks are created equal. Based on their size i.e. market cap, some are more important than others. The performance of the overall stock market largely depends on the performance of the very few. Have a look at this visualisation of the US market return composition by Morningstar to see how the largest companies have changed between 2020 to 2023. How much has the size of the rest of the market changed changed over this time?
6.2 Ordinary vs Preference Shares
6.2.1 What are ordinary shares?
Ordinary shares, also known as common stocks or common equity, represent an ownership stake in a corporation. Individuals holding these shares are essentially part-owners of the company. This ownership represents a residual claimant, which means shareholders are entitled to a share of the company's earnings after all other obligations have been met.
Those who invest in ordinary shares typically anticipate the receipt of dividends, which are periodic distributions of the company's profits. However, in scenarios where a company defaults on its obligations, debt holders reserve the right to initiate liquidation proceedings, subsequently assuming control over the company's assets to recuperate owed funds. Shareholders on the other hand cannot force the company to go into liquidation. These shareholders are among the last to be considered for repayment. They have to wait until all debts and other financial obligations have been paid to receive the residual claims on the company’s assets. This underscores the heightened risk that ordinary shareholders bear, a risk that is counterbalanced by the potential for higher returns over a long-term investment horizon, reflecting the fundamental risk-return trade-off in finance.
Holding shares give investors the right to vote on critical corporate governance issues. Such issues may include strategic decisions like mergers and acquisitions, executive remuneration packages, and the election or removal of board members. Essentially, this voting power enables shareholders to influence the direction and management of the company, something that debt holders do not get to enjoy since debt holders do not own the company.
Another advantage for ordinary shareholders is that their liability is limited. In the worst-case scenario of company failure, the personal financial exposure of shareholders is restricted to the amount of their investment in the company's shares, protecting their other personal assets. Finally, the life of ordinary shares is infinity. Unlike debt securities, which have specified maturity dates when the principal is to be repaid, ordinary shares remain valid as long as the company is in operation. Shareholders can choose to hold on to their shares indefinitely or sell them on the open market whenever they choose.
6.2.2. What are preference shares?
Preference shares, also known as preferred stocks, are a class of equity that exhibits characteristics of both bonds and common stocks. These shares typically offer investors a steady income stream through fixed dividends, which can either be a set amount or a fixed percentage of the company’s profits, much like the coupon payment of a bond. Due to their equity nature, preference shares do not have a maturity date. Shareholders of these stocks are entitled to receive annual dividend payments indefinitely, or for as long as they hold the shares. The dividends received by preference shareholders can be classified as a perpetuity and hence one can use the perpetuity formula to ascertain the current value of a preference share. Finally, preferred shareholders have lower ranking compared to bond and other debt holders, but they have higher ranking compared to ordinary shareholders when it comes to profit distribution and claims on assets in the event of liquidation.
6.3 Equity Valuation
6.3.1 Preference share valuation
The valuation principle states that the value of any financial asset is the present value of the future cash flows discounted back to the present using the appropriate discount rate. Since preference shareholders receive a constant stream of dividends indefinitely, the present value of the preference share can be obtained using a perpetuity formula.
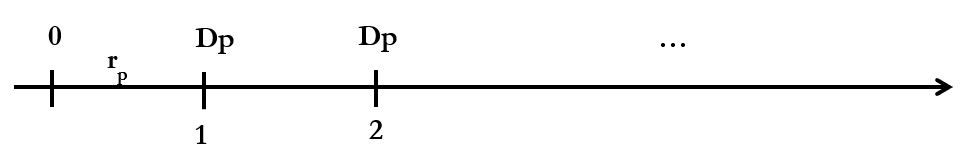
The value of the preference share is then given by:
Equation 1:
[latex]{\rm PS}_0=\frac{D_p}{r_p}[/latex]
Where:
- PS0 = Preference share market price
- Dp = Next period's dividend payment
- rp = Discount rate
Example: Suppose we have a company, ABC Corp., which has issued preference shares that pay an annual fixed dividend of $5 per share. If the current market rate of return for similar preference shares is 6%, what is the price of ABC Corp.'s preference shares?
Answer:
[latex]{PS}_0=\frac{D_p}{r_p}[/latex]
[latex]=\ \frac{$5}{0.06}=$83[/latex]
6.3.2 How are equity returns are measured?
Investors earn returns from shares not only through dividend payments but also via capital gains or losses. These gains or losses are realized when investors sell their shares at a different price from their purchase cost. The return on investment, therefore, encompasses the change in the share's value over time, alongside any income from dividends received. For each share, the total dollar return is the sum of holding period income and capital gains (losses). Since dividend payment represents the income that the stockholder earns during the holding period,
Total dollar return = Divt+1 + (Pt+1 - Pt)
In finance, when it comes to return, we do not use dollar returns to evaluate the performance of an investment. The reason is dollar returns depend on the initial capital investment which make it difficult to compare across stocks. For example, suppose you buy 1 share A for $50 per share and sells it for $55 per share, your dollar return would be $5 per share. Meanwhile, you can buy 1 share B for $10 and sell it for $12 per share, your dollar return on share B would be $2 per share but which one is a better investment? Based on just the dollar return alone, A would seem to be a better share but instead of buying 1 share of A, you could have bought 5 shares B for the same $50 and if you do that, you would end up with 5 x 12 =$60 which clearly yields a return that is higher than A.
Therefore, to measure the performance of an investment, we use a percentage return i.e. the rate of return.
The rate of return on investment is given by the following formula:
Equation 2:
[latex]r = \frac{D_1+P_1-P_0}{P_0}[/latex]
If we reorganise the formula, the current value or price of a share can be calculated as:
Equation 3:
[latex]P_0 = \frac{D_1+P_1}{{(1+r)}^1}[/latex] or [latex]P_0 = \frac{D_1}{{(1+r)}^1}+\frac{P_1}{{(1+r)}^1}[/latex]
P0 is the price of the share at time 0 i.e. now. P1 denotes the price in the future i.e. period 1 and D1 is the dividend received during the period and r investors’ expected rate of return. Equation 3 corresponds to the present value formula with P1 and D1 represent the future cashflows and r the discount rate.
Example: You are thinking whether or not to invest in XYZ Manufacturing Co. where the investment expectations are as follows: an anticipated dividend payment of $2.5 to be received in one year. You expect to be able to sell the share for $30 at the end of the year and investor required rate of return on shares with similar risk is around 8% per year. What is the maximum price you are willing to pay for XYZ manufacturing Co?
Answer: The value of XYZ today is the present value of the future cashflows i.e. the incoming dividend and the potential resale value discounted at the required rate of return of 8% p.a.
[latex]P_0=\ \frac{2.5+30}{(1+0.08)}=$30.09[/latex]
You should be prepared to pay no more than 30.09 for XYZ today. If you pay such price and assume that your cashflows turn out to be as expected, the rate of return you achieve is 8% p.a.
This example assumes that you would only hold the share for 1 year. What if your investment horizon is 2 years. The company announces that the dividend in the first year is $2.5 per share and this dividend will increase by 10% in the following year. You expect to be able to sell the stock at the end of year 2 for $37. How much are you willing to pay for XYZ Co. today?
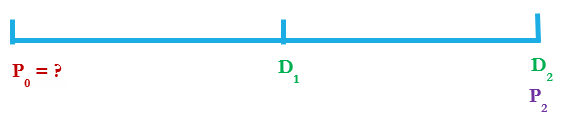
No matter how long the investment horizon is expanded into the future, the valuation principle still holds. The value of the asset is the present value of all future cashflows where the cashflows are all different.
The dividend in year 2 is D2 = D1 x (1+0.1) = 2.5 x 1.1= 2.75
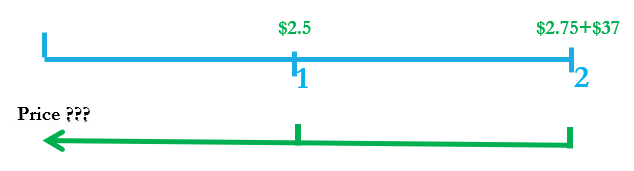
Price = PV(dividends) + PV(sale price)
[latex]=\ \frac{2.5}{1.08}+\ \frac{2.75+37}{\left(1.08\right)^2}=$36.39[/latex]
6.3.3 Dividend discount model
The value of the stock today equals to the sum of all of its future cashflows discounted back to their present values. If dividends are the main cashflows that investors get for holding the stock, the fair price of a stock can be computed using the present value of these anticipated dividend payments. To apply the Dividend Discount Model (DDM), it's necessary to make projections about the future dividends a company will pay. These projections often involve simplifying assumptions to handle the uncertainty and variability of future dividends. Two common methods used for this purpose are:
Constant Growth Rate Model: This approach assumes that dividends will grow at a constant rate indefinitely. It can also consider a special case where the growth rate is zero, meaning dividends are expected to remain constant over time.
Variable Growth Rate Model: In contrast, this model allows for dividends to grow at different rates during different periods. It's more flexible and can accommodate various growth patterns, such as a company expecting higher growth in the initial years and lower growth thereafter.
For an ordinary shareholder, the timeline for the cashflows that the shareholder can expect is as follows:
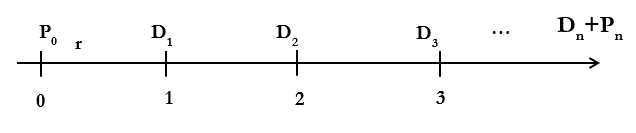
The value of the stock can be calculated by discounting these cashflows i.e. dividends and price to the present using the discount rate r
[latex]P_0 = \frac{D_1}{{(1+r)}^1}+\frac{D_2}{{(1+r)}^2}+\frac{D_3}{{(1+r)}^3}+\frac{D_4}{{(1+r)}^4}+\ ...\ \frac{D_n+P_n}{{(1+r)}^n}[/latex]
Since Pn, the price of the stock in period n, depends on the present value of the future dividends starting in period n+1, the price of the stock today can be simplified to:
[latex]P_0=\frac{D_1}{(1+r)^1}+\frac{D_2}{(1+r)^2}+\frac{D_3}{(1+r)^3}+\cdots+\frac{D_\infty}{(1+r)^\infty}[/latex]
If these dividends are the same, the price of the stock can be computed as the present value of a perpetuity. If these dividends are not constant, calculating the price of the stock involves forecasting future dividend until infinity which is extremely difficult to do. However, when dividends are not constant but growing at a constant rate forever then the above formula becomes a perpetuity that grows at a constant rate forever i.e. a growing perpetuity that we cover in chapter 3.
Suppose that D0 is the dividend paid at time 0. If dividends are growing at a constant rate g then D1 will be equal to D0 x (1 + g), D2 = D1 x (1 + g). Substitute D1 = D0 x (1 + g) into D2, we have D2 = D0 x (1 + g)2. Similarly, D3 = D0 x (1 + g)3 and so on.
Using the growing perpetuity formula:
Equation 4:
[latex]{\rm PV}_0=\frac{{\rm CF}_1}{r-g}[/latex] or [latex]P_0 = \frac{D_1}{r-g}=\frac{D_0\left(1+g\right)}{r-g}[/latex]
This is known as the Gordon Growth Model. The formula in equation 4 reveals two important points: first, g has to be less than r. The growth rate must be less than the discount rate. If g = r then we have a situation where we have to divide D1 by 0 which is undefined. If g > r then the price will be negative which is not possible since price can only be 0 under the worst case scenario. It happens when you lose what have invested in, price cannot be negative due to limited liability. Second, the price of the stock today depends on dividends starting from period 1 onwards. The value of a financial asset depends on future cashflows not the cashflows in the past.
Example: Suppose a company, XYZ Corp, just paid a dividend of $3.00. Assume that this dividend is expected to grow at a rate of 4% per year forever, if investors require a return of 15%, how much are you willing to pay for XYZ stock today?
Answer: The price of the stock today depends on dividend in period 1 and onwards so the first thing we need to work out is D1. Since the growth rate is constant at 4% per year, D1 = D0 x (1 + g). D1 = $3 x (1 + 0.04) = 3.12.
Applying the formula in equation 4, where D1= 3.12, g= 0.04 and r = 0.15. The price of the stock today is:
[latex]P_0=\frac{3.12}{0.15-0.04}=$28.36[/latex]
6.3.4 Two-stage variable growth model
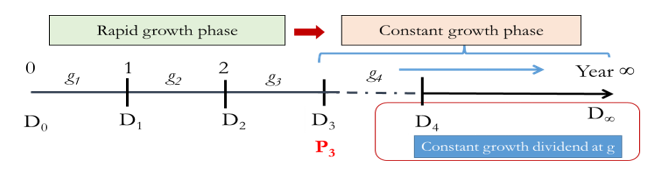
The Gordon Growth Model assumes that dividend will be growing at a constant rate forever which is unrealistic for 2 reasons. First, if the growth rate is consistently higher than some form of long-term average, for example, the global GDP growth rate then it is possible that one day the company will be larger than the world which is not possible. Second, companies have different growth rates during its life cycle. When the company is young, it will be growing at a very rapid rate. As the company matures, the growth rate will be levelling off to a steady state due to either increasing competition or running out of innovations. To make the Gordon model more realistic, we incorporate different stages of growth into the formula.
The following example illustrates a scenario when the company is growing very fast for the first 3 year. From year 4 onwards, the company grows at a smaller but stable rate until infinity.
If price is the present value of future cashflows then
[latex]P_0 = \frac{D_1}{r-g}+\frac{D_2}{{(1+r)}^2}+\frac{D_3}{{(1+r)}^3}+\frac{P_2}{{(1+r)}^2}[/latex]
If D1 is growing at a constant growth rate of g then price at time 0 can be calculated based on dividend in time 1
[latex]P_0 = \frac{D_1}{{r-g}}[/latex]
In this scenario, the constant growth rate only take effects from year 4 onwards so price at time 3 can be calculated based on dividend in time 4
[latex]P_3 = \frac{D_4}{{r-g}}[/latex]
Combining these two effects, the value of the stock at time 0 is therefore given by:
[latex]P_0 = \frac{D_1}{{(1+r)}}+\frac{D_2}{{(1+r)}^2}+\frac{D_3}{{(1+r)}^3}+\left[\frac{\frac{D_4}{r-g}}{{(1+r)}^3}\right][/latex]
The price at time 0 is the present value of a mixed stream of cash flows for the first 3 years and growing perpetuity from year 4 onwards. The last cashflow represents P3 i.e. value of the stock at time 3. We need to discount it by further 3 periods to arrive at the present value.
Example: Suppose a firm is expected to increase dividends by 20% in one year and by 15% in the second year. That is, the first stage of rapid growth lasts for two years. After that dividends will increase at a rate of 5% per year indefinitely. If the last dividend was $1 and the required return is 20%, what is the current price P0? What is the stock price at the end of year 2?
Answer: As with any valuation exercise, the first task involves estimating future cashflows. The timeline of the cashflows is listed as follows:
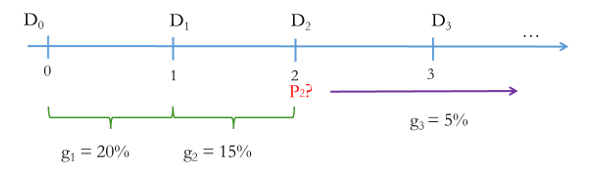
Since the constant growth rate will start taking effect from dividend in year 3, this allows us to work out the value of the stock at time 2.
[latex]P_2=\frac{D_3}{r-g}[/latex]
We know the discount rate r which is 20%, and the constant growth rate of 5%. However, we do not know dividend in time 3.
The question states that dividend will increase in the first year at 20% so D1 = D0 x (1 + 0.2).
For the second year, dividend will increase further by 15% so D2 = D1 x (1 + 0.15).
After that, dividend will increase at a rate of 5% forever so D3 = D2 x (1 + 0.05).
D3 = D0 (1 + 0.2) x (1 + 0.15) x (1 + 0.05) = 1 x 1.2 x 1.15 x 1.05 = $1.449.
Once we have dividend in time 3 and since this dividend will be growing at a constant rate forever, the value of the stock at time 2 is:
[latex]P_2=\frac{1.449}{0.2-0.05}=9.66[/latex]
The cashflows for the stock can be simplified as:
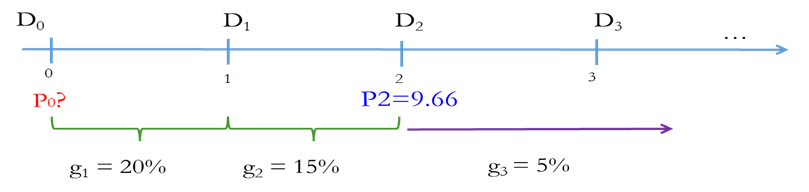
The current price of the stock can be computed using D1, D2 and P2 as follows:
[latex]P_0 = \frac{D_1}{{(1+r)}^1}+\frac{D_2}{{(1+r)}^2}+\frac{P_2}{{(1+r)}^2}[/latex]
D0 = 1
D1 = D0 * (1 + 0.2) = 1(1.2)=1.2
D2 = D1*(1 + 0.15) = 1*(1.2)*(1.15)=1.38
D3 = D2*(1 + 0.05) = 1*(1.2)*(1.15)*(1.05)=1.449
[latex]P_0=\frac{D_1}{(1+r)}+\frac{D_2}{{(1+r)}^2}+\frac{P_2}{{(1+r)}^2}=\frac{1(1.20)}{1+0.20}+\frac{1(1.20)(1.15)}{{(1+0.20)}^2}+\frac{9.66}{{(1+0.20)}^2}[/latex]
[latex]1+0.9583+6.7083=$8.67[/latex]
6.4 Other approaches to share valuation
The dividend discount model is one of the most popular models used in share valuation. However, this model has a number of limitations. First, the model is not applicable for companies that do not pay dividends. Second, the model relies heavily on projecting future dividends, growth rates for varying phases, and a discount rate. Inaccurate predictions of these variables can lead to a significantly erroneous stock valuation. Essentially, the reliability of the valuation is contingent upon the precision of the input data. Therefore, due to these limitations, an alternative method of stock valuation that employs market comparables is often used. This approach assesses a company's value by comparing it with similar companies in the market.
Among the most commonly used metrics are the P/E (Price-to-Earnings) ratio and the P/S (Price-to-Sales) ratio. The underlying principle of this method is the assumption that comparable firms should exhibit similar P/E ratios. Therefore, if we possess the earnings information for the company of interest, we can estimate its market value by multiplying its earnings by the P/E ratio of its peers.
6.5 Overview of the Australian share market (ASX)
The Australian Securities Exchange (ASX) is a principal financial marketplace in Australia where securities including shares, bonds, derivatives, and other financial instruments are actively traded. As of 2024, there are 2200 companies listed on the ASX with a total market capitalisation of 2.6 trillion dollars with an average daily turnover around 6 billion dollars.
6.5.1 Primary and secondary market
The primary market refers to the sector of the capital market where new securities are created and offered directly to investors by the issuing entities. This is the market where businesses, governments, or public sector institutions can raise capital by selling financial assets such as stocks, bonds, or other instruments to investors for the first time. The funds raised through these sales are typically used for expansion, development projects, or other operational purposes. This infusion of capital from investors to issuers is a fundamental aspect of economic growth and corporate expansion. Investment banks play a crucial role in this process by underwriting these new financial assets and facilitating the Initial Public Offerings (IPOs) or the issuance of new debt. The process is characterized by several stages, including regulatory approval, due diligence, and pricing, before the financial assets are finally made available to the public.
The secondary market on the other hand is where already-issued securities are bought and sold by and to investors. Unlike the primary market where securities are first issued by companies in exchange for capital, the secondary market involves the trading of existing ownership stakes in various financial assets such as stocks, bonds, and other investment instruments. Instead, the secondary market provides a platform for investors to sell to and buy from one another, offering a means to realize the value of their investments. In this market, transactions are facilitated by brokerage firms and do not involve the issuing companies; hence, no new capital is raised for the corporations whose stocks are being traded. A key feature of the secondary market is that it offers liquidity, allowing for financial assets to be quickly converted to cash. This process is crucial for the functionality of the primary market, as investors are more likely to purchase new securities if they know they can later sell them on the secondary market. Moreover, it enables investors to diversify their portfolios and manage risk more effectively by allowing them to adjust their holdings in response to changes in market conditions or their investment strategies.
6.5.2 Investment banking
Investment banks serve a pivotal role in the financial markets by aiding companies in securing long-term financing. They assist corporations through the complex process of issuing bonds, which is a method of raising debt, as well as conducting Initial Public Offerings (IPOs), the process through which a company's shares are offered to the public in the equity markets for the first time. In addition to helping the companies with capital raising, investment banks also play a significant role in facilitating mergers and acquisitions. They provide strategic advisory services for both buyers and sellers, helping to negotiate deals, structure transactions, and arrange the financing needed to execute mergers or acquisitions.
Investment banks are very different from commercial banks. Commercial banks cater to the day-to-day banking needs of individuals and businesses, offering services such as savings accounts, mortgages, and personal loans. These banks play a vital role in the economic cycle by accepting deposits, which they then lend out, facilitating personal and business financial growth.
Summary and key takeaways
This chapter explores the distinctive characteristics of equities and provides and overview of the Australian share market. We've acquired techniques for valuing stocks by employing methods like the Dividend Discount Model and analyzing market comparables. Shares are high-risk investments, yet they carry the potential for substantial returns. To determine the investment's merit, it's essential to assess if the expected returns from the stock adequately compensate for the risks. Upcoming chapters will broaden our understanding of this dynamic by examining the concepts of risk and return, providing a deeper insight into financial decision-making processes in the context of investing.
References:
Graham, J., Smart, S. B., Adam, C., Gunasingham, B. Introduction to Corporate Finance (2nd Asia – Pacific Edition) 2017.
Brealey, R., Myers S. C., Allen F., Edmans, A. Principles of Corporate Finance (14th Edition) 2022.
Peirson, G., Brown, R., Easton, S., Howard, P., Pinder, S. Business Finance (12th Edition) 2015.
