Chapter 4: Building Cost Information (Data/indices)
4.0 Introduction
This chapter discusses cost data and information that can be used in the cost planning process, including factors affecting construction costs, types and sources of cost data/information, and their use in different cost planning stages. The chapter delves into cost indices, which are a special type of cost data used in the cost planning process.
4.1 Cost data and information
A prerequisite of any kind of cost management system, including cost planning, is the need for reliable cost data in the form of cost information (Smith et al., 2016). In computer science, the difference between data and information was elaborated by Daniel Keys Moran, who is a famous American science fiction writer and programmer as:
‘You can have data without information, but you cannot have information without data’ (Martha & Mary, 2023, p. 3).
In technical terms, cost data are converted to cost information. It should be noted that cost information and cost data need to be understood contextually based on the factors affecting the costs, type and application of cost data/information in different stages of cost planning. Figure 4.1 is an illustration of the evolution of cost information from cost data in a construction project. However, in the construction context, the terms ‘cost data’ and ‘cost information’ are used interchangeably.
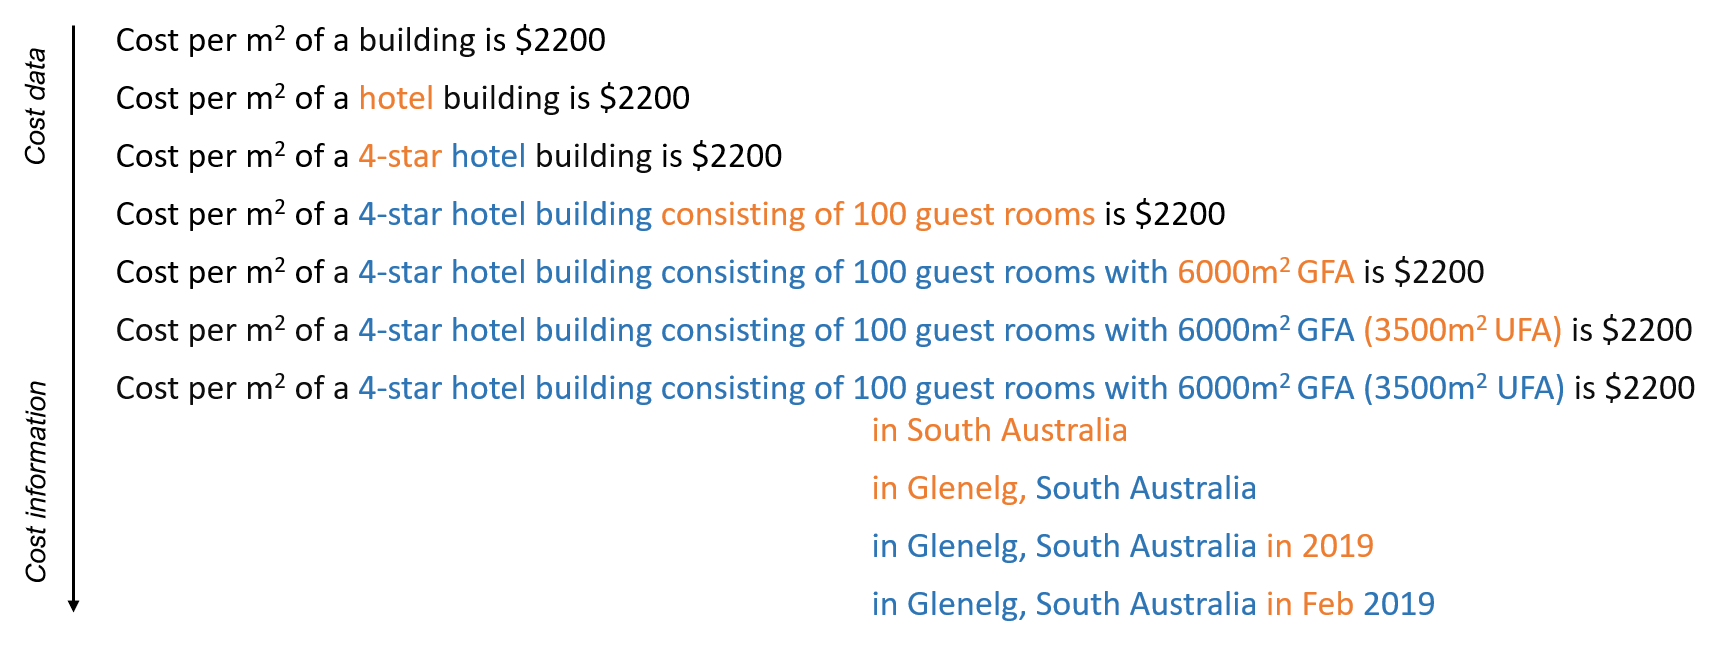
GFA = Gross Floor Area, UFA = Usable Floor Area
As illustrated in Figure 4.1, the level of cost information gradually changes as per the level of project and design information available. Initially, the scope and quality level of the hotel are not provided. Later, the number of rooms defines the size and the star grade defines the quality level of the hotel. The specific location and time further define the scope and hence, increase the comprehensiveness of cost information. It further improves when the floor area is refined, and by the end with the confirmed GFA.
4.2 Factors affecting construction costs
There are a range of factors affecting construction costs in different contexts and hence, these should be reflected in cost information. Most of the sources of cost information (i.e. published) offer averaged cost information for typical scenarios, and hence, care must be taken when using such generic cost information and adjustments may be needed based on the factors affecting the cost data such as size and quality of project, location, market conditions, type of procurement and unusual/different features or circumstances. Therefore, this section provides the understanding of those factors.
Type and size of project
The type (i.e. residential, commercial) and size (i.e. number of storeys) of a building can significantly impact its cost, for example:
- Single storey administrative office building
- Single storey primary school building
- Two-storey office building
- Multi-storey apartment building.
Location
Costs can heavily depend on the geographical location of the project due to many factors such as:
- economic conditions
- availability of labour (or transportation from other locations)
- change in labour productivity through travel and other external influences
- availability of materials (in the locality or otherwise transport from other states/countries)
- regional workloads of contractors
- accessibility (confined sites)
- environmental factors (climate, topography, geology)
- local government restrictions
- industrial allowances for working on remote sites
- taxation.
Example: Location
- In the Adelaide CBD, construction costs can be higher due to confined access to sites and traffic management compared to regional areas. On the other hand, resource shortages (i.e. labour and materials) in regional areas can affect the cost.
- In New Zealand, compared to Auckland, projects in Whangārei should have a higher cost since contractors are typically based in Auckland, and they have to travel to that area.
A locality index will be applied to adjust available cost information considering these factors (see Section 4.3.1).
Market conditions
The overall economic conditions, including inflation rates, interest rates, currency exchange rates, and market trends, can affect the cost of the project. Economic recessions or booms can influence the availability and cost of resources and services.
Example: Market conditions
- The cost of labour varies based on factors such as labour supply and demand, skill level required, labour union agreements, and prevailing wage rates in the area.
- Similarly, the cost of materials is subject to fluctuations due to changes in supply and demand, market conditions, raw material prices and transportation costs.
Cost data published at a certain point in time may become outdated due to above conditions, and should be adjusted for the current prices. Price Indices are used for these adjustments (see Section 4.3.1). Moreover, given the nature of construction projects with longer durations, appropriate escalation factors should be applied in cost planning.
Unforeseen circumstances
Due to the unique nature of construction projects, construction costs are highly influenced by unforeseen circumstances and may incur additional costs. Factors such as complex designs, special materials, challenging site conditions, regulatory compliance, or environmental considerations can contribute to high risk and extra costs. Therefore, cost information should be adjusted to cover such conditions.
4.3 Types of cost information
Different types of cost data/information, either unpublished or published, are used throughout the cost-planning process. These types can be found on several price databases in Australia and New Zealand.
Building cost per m2 of GFA
Building cost per m2 of GFA is provided with the type and size of the project.
Example: Building cost per m2 of GFA
Australia
- Single-storey primary school in Adelaide without air conditioning: $1945-2100 m2/GFA.
- Single-storey residential house unit in Brisbane with tile roof and built on a flat site with brick veneer wall: $1355-1460m2/GFA (See Figure 4.2a).
New Zealand
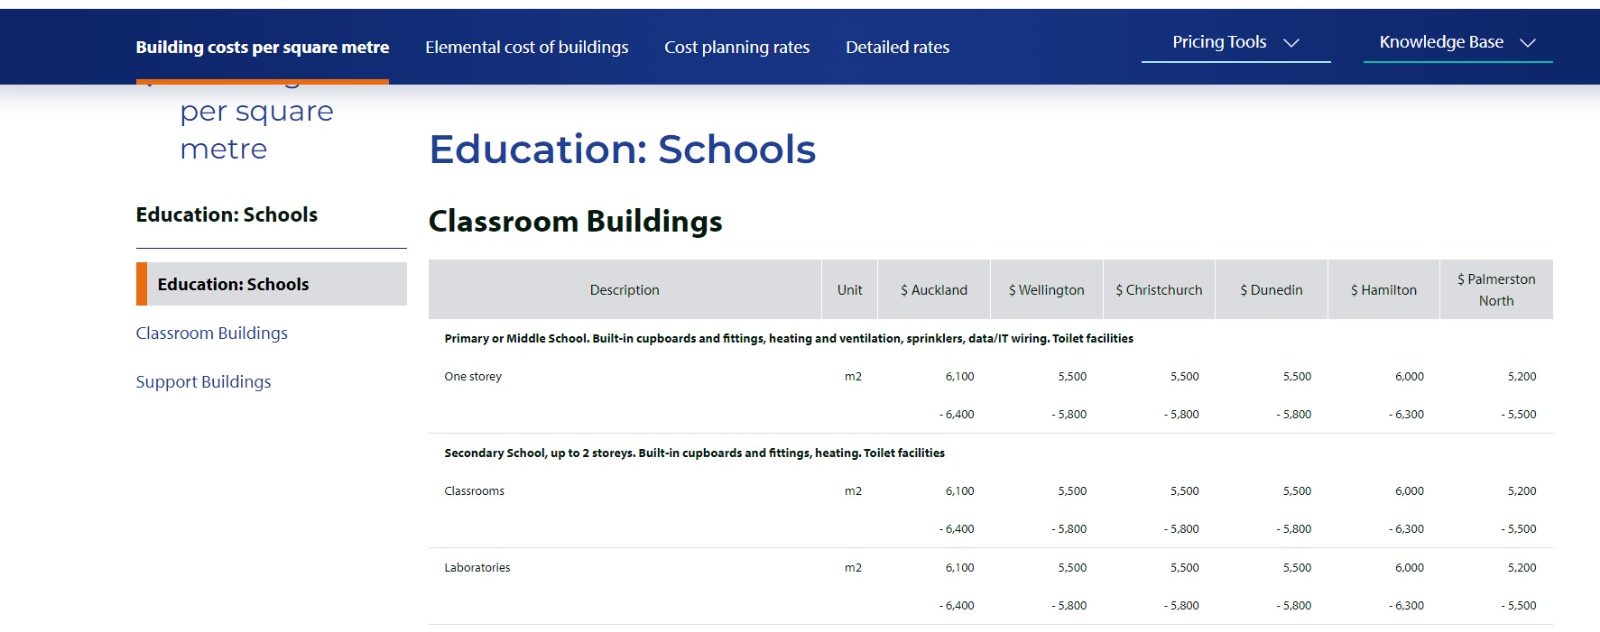
- Primary/middle one storey school, with built-in cupboards and fittings, heating and ventilation, sprinklers, data/IT wiring, toilet facilities in Auckland: $6100m2/GFA.
- Secondary school up to two storeys, with built-in cupboards and fittings, heating toilet facilities in Wellington: $5500m2/GFA (See Figure 4.2b).
Figure 4.2a shows some extracts from Rawlinsons Construction Cost Guide which capture the building cost per m2 of GFA in the Australian context.
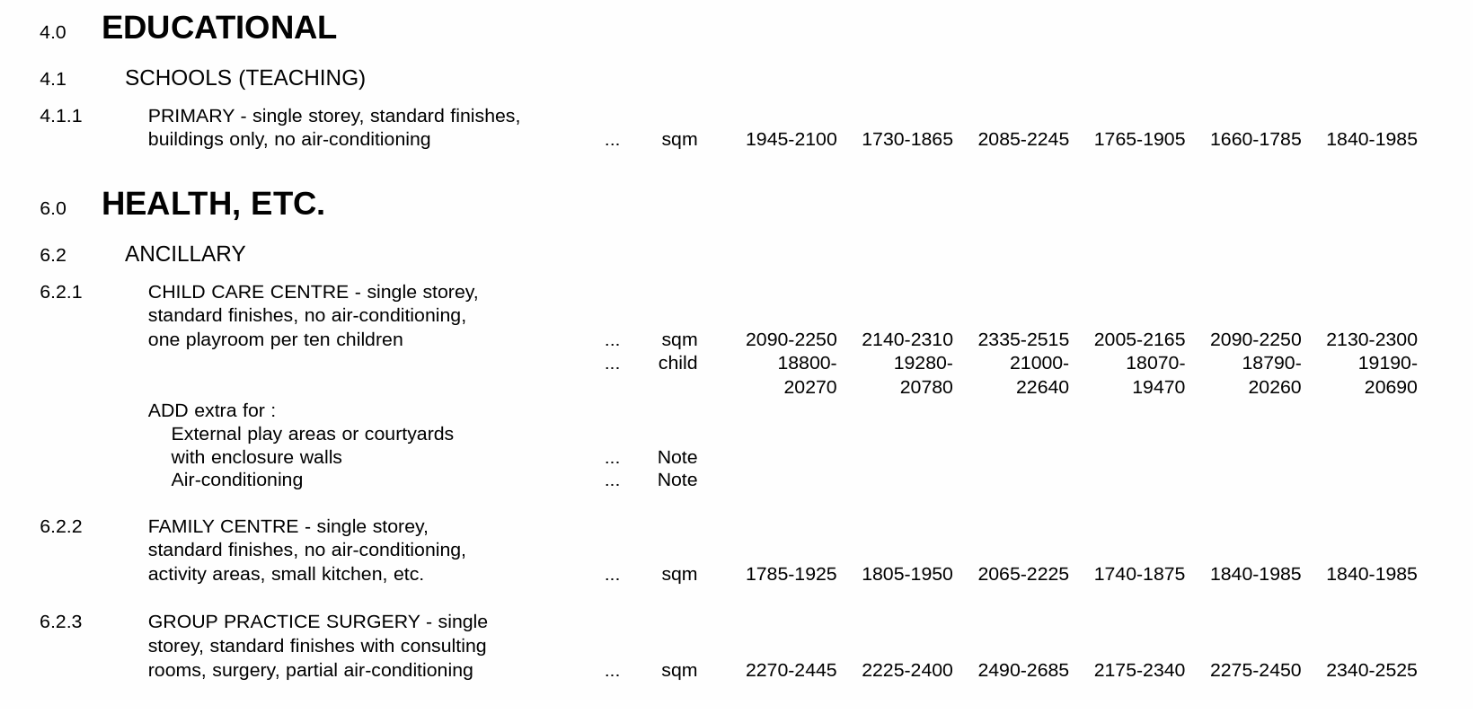
Figure 4.2b shows extracts from QV CostBuilder which capture different building cost per m2 of GFA in the New Zealand context.
Building cost per functional unit
Building cost per functional unit is determined based on the functional unit which expresses the intended use of the building.
Example: Building cost per functional unit
Australia
- Single-storey standard finishes, with no air conditioning, one playroom per 10 children: $188,800-20,270 per child.
- Three-storey apartment with one- or two-bedroom units, excluding balconies, no lift, with basic standard finish in Sydney: $134,500-145,000/apartment (See Figure 4.3a).
New Zealand
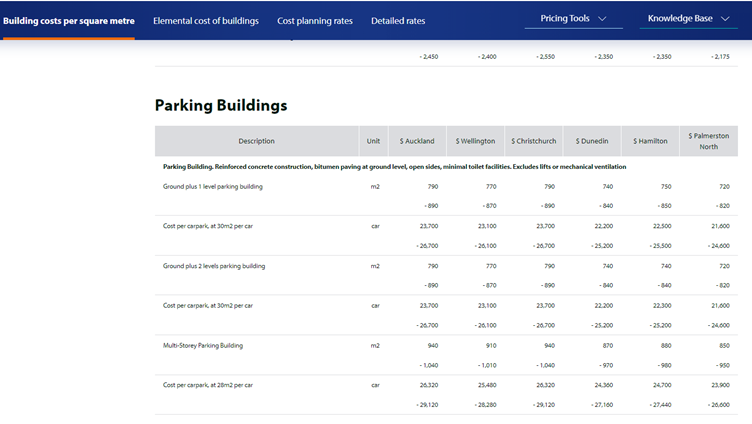
- Car park in multi-storey car park building in Auckland is NZD 26,500-29,500 per 28m2 car park (Figure 4.3b).
Figure 4.3a shows extracts from Rawlinsons Construction Cost Guide which capture the building cost per functional unit in the Australian context.
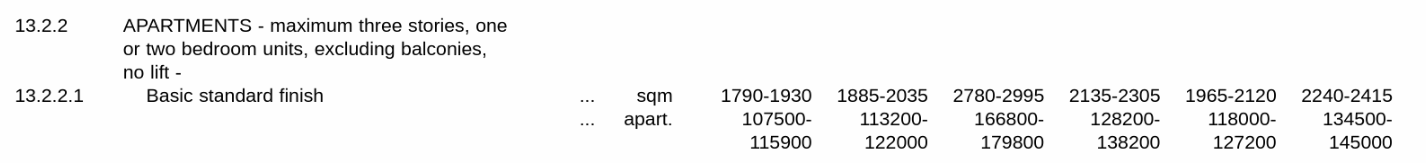
Figure 4.3b shows extracts from QV CostBuilder which capture different building cost per functional unit in New Zealand context.
Elemental cost per unit
Elemental cost per unit is determined based on the quantity and specification of the building elements in a project.
Example: Elemental cost per unit
Australia
- Substructure of a warehouse low bay letting brick walls: $123.50/m2.
- Substructure of a warehouse low bay letting pre-case tilt-up walls: $109.75/m2 (See Figure 4.4a).
New Zealand
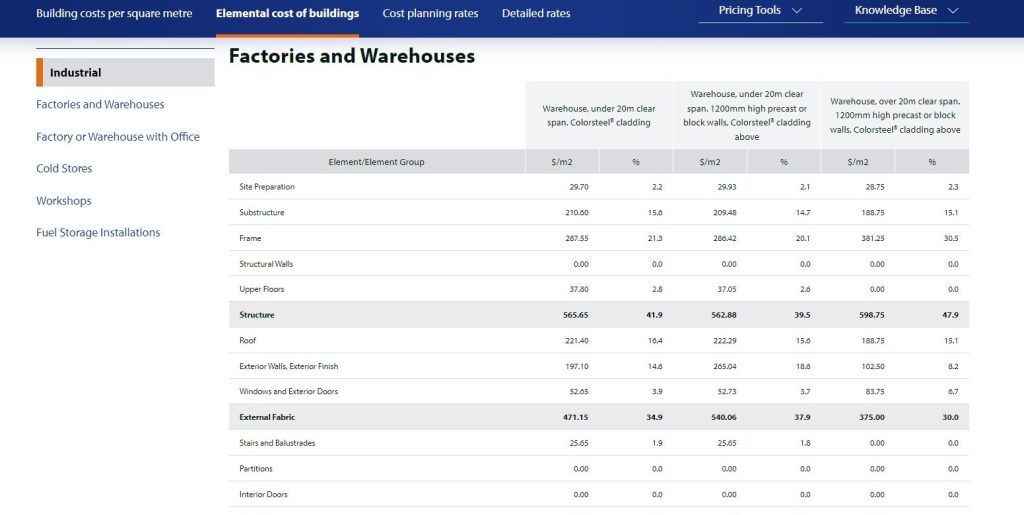
- Substructure of a warehouse under 20m clear span colour steel cladding: $210/m2.
- Substructure of a warehouse under 20m clear span 1200mm high precast or block walls with colour steel cladding above: $209.48/m2 (See Figure 4.4b).
Figure 4.4a shows extracts from Rawlinsons Construction Cost Guide which capture the elemental cost per unit in the Australian context.
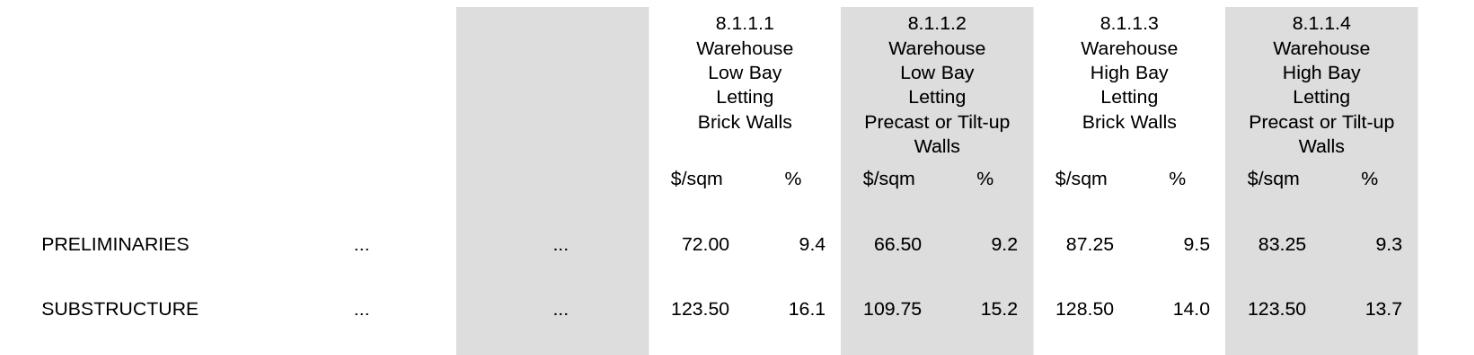
Figure 4.4b shows extracts from QV CostBuilder which capture the elemental cost per unit in the New Zealand context.
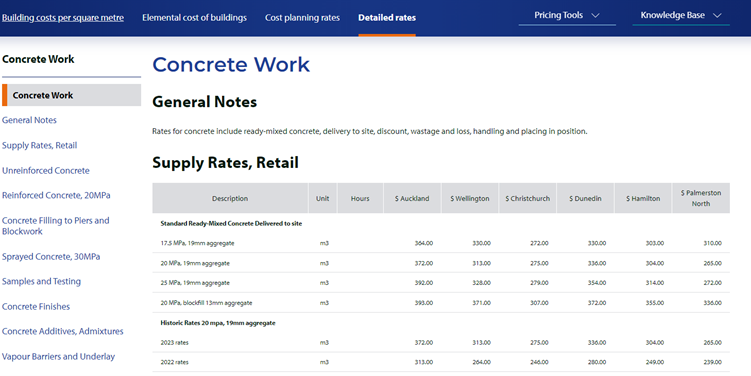
Sub-elemental cost per unit
Sub-elemental cost per unit is determined based on the quantity and specification of the building sub-elements under each element.
Example: Sub-elemental cost per unit
Australia
- 20MPa concrete for foundation beams in Adelaide: $296/m3.
- 20MPa concrete for columns in Adelaide: $424/m3 (See Figure 4.5a).
New Zealand
- 20 MPa with 19mm aggregate, standard ready-mixed concrete delivered to site is NZD 372.00/m3 (See Figure 4.5b).
Figure 4.5a shows extracts from Rawlinsons Construction Cost Guide which capture the sub-elemental cost per unit in the Australian context.
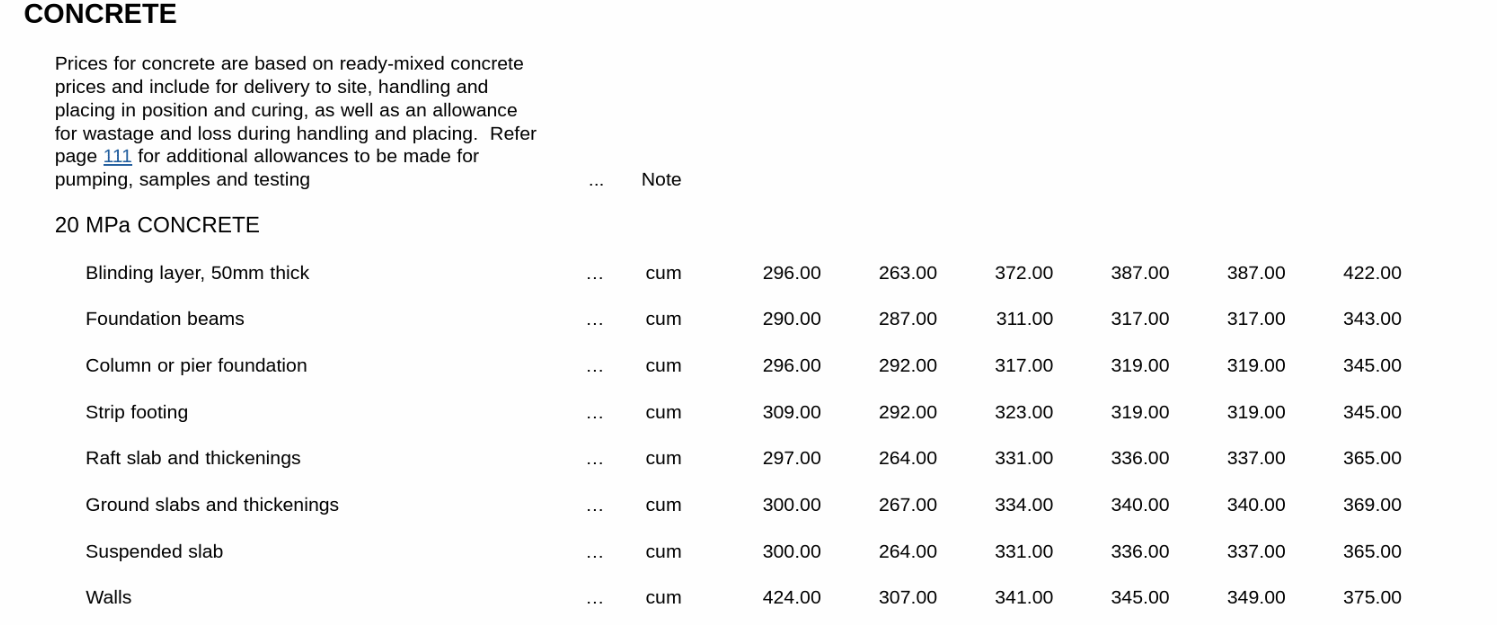
Figure 4.5b shows extracts from QV CostBuilder which capture the sub-elemental cost per unit in the New Zealand context.
4.3.1 Building cost and price indices
Building cost and price indices are another type of published cost data/information.
‘Indices are indicators of the performance or behaviour of a factor that is indexed. They are a very useful tools available for estimators to capture the cost and price behaviour of the whole industry, building materials, labour or plant.’
— (Ashworth & Perera, 2015, p. 119)
Price indices are a specific type of cost information developed to make price adjustments considering the factors explained in Section 4.2. Since indices are predicted for a certain period from the current point of time, for price fluctuations within the construction project duration, appropriate escalation factors should be evaluated and applied.
Adjusted costs can be calculated as follows:
Adjusted cost for the new project = Cost × Current Index ÷ Base Index
- Base date index number (either tender date or earlier agreed date)
- Current index for the month for which the amount is to be adjusted
- Cost of the labour, plant and equipment and material.
Three types of indices, Building Costs Indices (BCI), Locality Index (LI) and Tender Price Indices (TPI), are discussed in the following sections.
Building Costs Indices
According to AIQS (2022, p.3), ‘Building Costs Indices (BCI) is a numerical index relative to a base of 100 that reflects fluctuations in Building Costs and market conditions from the base date.’ It represents long-term fluctuations of costs incurred by the contractor, considers the changes in the cost of major construction inputs (labour and materials) and ignores changes in profit levels, overheads, productivity and discounts.
Example: Building cost indices
- BCI for July 2015 in Sydney is 274.
- BCI for October 2023 in Canberra is 427.
Tender Price Indices
Locality Index
According to AIQS (2022, p. 8), locality index is ‘a measure of the variation in cost from any index base for transporting and obtaining labour, material and equipment outside the location of that base. It excludes all design changes and site and climatic factors.’
It is used as a means to compare the similar nature of projects due to the regional variations in cost and expressed as a percentage compared to a base location.
Example: Locality index
In Australia, prices vary between major cities (Adelaide, Brisbane, Melbourne, Sydney, etc.) and also between suburbs.
- Building Price Index in Adelaide by 31 March 2020 is 116.56.
- Building Price Index in Sydney by 2018 is 120.00.
- Adelaide base index = 100, Port Augusta = 115, Victor Harbour = 103.
Figure 4.6 presents locality indices in a map of Adelaide.
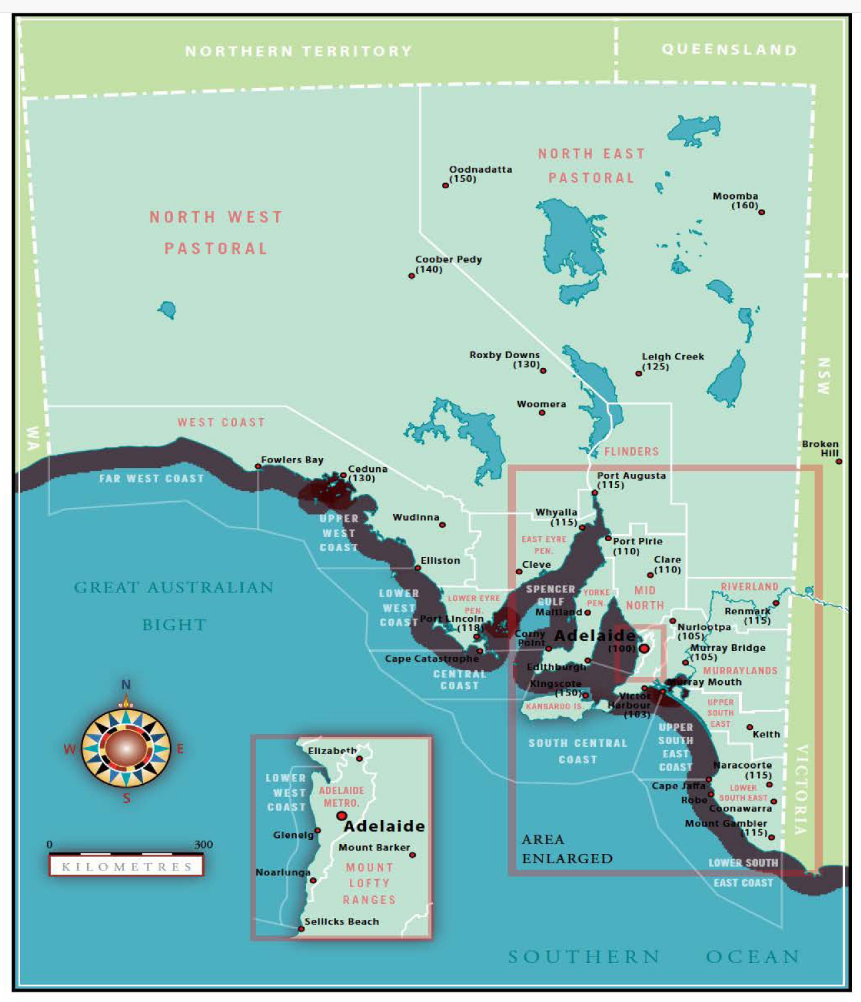
Example: South Australian locality indices
According to Figure 4.6, within South Australia, locality index differs in Port Lincoln compared to the base city Adelaide.
- Adelaide = 1.00
- Port Lincoln = 1.291
Labour Cost Index
‘The labour cost index (LCI) measures changes in salary and wage rates for a fixed quantity and quality of labour input. Service increments, merit promotions and increases (or decreases) relating to performance of the individual employee are not included in the index’ (Reserve Bank of New Zealand, 2024a).
Example: Labour cost indices
In New Zealand, all sector nationwide salary and wages index under LCI.
- September 2023 = 1390
- September 2019 = 1229
Product Price Index (PPI)
‘The inputs index measures the change in costs of production (excluding labour). The outputs index measures the change in prices received by producers’ (Reserve Bank of New Zealand, 2024b).
Example: Product price indices
In New Zealand, the PPI utilises an index reference period corresponding to the December 2010 quarter which is set at 1000.
PPI for Construction Industry Building Construction:
- September 2019 = 1219
- September 2022 = 1476
Exercise: Cost estimates
You have used cost data from Dec 2018 in Project A to estimate the cost of Project B in December 2020, which is similar in nature (see project details below). What has been the cost estimate of Project B?
Project A details
- GFA = 250m2
- Total cost as at December 2018 = $550,000
Project B details
- GFA = 275m2
BCI in December 2018 is 153.3.
BCI in December 2020 is 159.5.
Answer
Project A
Total cost as at Dec 2018 = $550,000
Cost per GFA = $550,000 ÷ 250 = $2,200
Project B
Total cost = $2,200 × 275m2
= $605,000
Adjusted cost of the Project B = Cost × (current index ÷ base index)
= 605,500 (159.5 ÷ 153.3)
= $629,468.36
4.4 Sources of cost data/information
This section discusses various sources of cost data/information.
4.4.1 Databases
Cost information can be stored in cost databases, which can benchmark rates maintained by analysing the cost of similar past projects. Cost databases can be published or unpublished depending on the sensitivity and confidentiality of the cost information. Irrespective of whether the information is published or not, cost databases have the following characteristics:
- should be able to update
- should be easily accessed.
Databases can be set up in software programs such as Access or Excel. Any takeoff software such as Bluebeam and CostX can also be used to create and use a rate library function, which caries unit rates of the items.
There are personal and organisational databases that can be used for cost planning.
Personal databases
Individual professionals (i.e. cost planners/quantity surveyors) can maintain their own databases and use them in similar future projects. Cost data can be generated from personal practice using various contractual documents (i.e. priced BQs, contractors’ claims, final accounts), cost advice from suppliers, contractors or sub-contractors and from their own experience. This saves cost planners time in finding reliable and up-to-date cost information, because construction cost planning involves a lot of information and cost data. Such information is usually treated as confidential and used only at a personal level, hence, unpublished.
Organisational cost databases
Most cost consultancy organisations maintain cost databases (in-house cost data) as confidential sources of information. Some may not even maintain a proper cost database due to the risk of disclosing the information to a third party. As a result, personnel tend to maintain their own databases.
Example: Organisational cost databases
- Riders Digest was annually published by Rider Levett Bucknall (RLB) for different states in Australia and New Zealand [PDF] with the purpose of keeping Cost Consultants and clients up-to-date regarding Building and Building Services Cost ranges, benchmarks and price indices.
- CostBuilder New Zealand published by QV is one of the largest construction cost databases available in New Zealand. It contains information on Building Costs per m2, Elemental costs of Buildings, Cost Planning Rates and detailed rates.
State government/government department cost databases
Most governmental agencies maintain cost databases and provide cost information related to national economic indicators, public projects, policies and regulations. These can be used in understanding the trends, economic forecasts and budgetary allocations at the national level in construction projects.
Example: State government/government department cost databases
- Everything you need to know about a school building project [Word 280KB] by the Victorian School Building Authority, Australia contains the information of standard budget breakdowns for the school projects such as a percentage or range between percentages (%) (allocated for construction, professional fees, project management and communications, project contingencies and furniture, equipment), additional funding allocations, project funding and project milestones.
- Statistics New Zealand publishes cost indices which are used in price fluctuation formulas.
- Cost estimating guideline for public sector health capital projects [PDF] is developed to aid Quantity Surveyors and Cost Estimators in creating and refining cost projections for Te Whatu Ora healthcare facilities across all phases of the project in New Zealand.
International databases
International databases compile cost data from multiple countries and regions, offering comparative analysis and insights into global economic trends, market dynamics and cross-border investments. These databases are used by multinational corporations, investors and policymakers.
Example: International database
Building Cost Information Service (BCIS) International collects, collates, analyses, models, and interprets cost information.
Did you know?
Step-in to BIG Data!
Cost consultancy and cost management companies have been using the concept of ‘data centres’, which are physical infrastructures designed to provide customised solutions in the field of cost management and Quantity Surveying. Data centres are evolving throughout the globe as organisations move to the cloud, which could accommodate thousands of servers to meet the current demand.
4.4.2 Construction annual price books
Annual price books compile standardised cost data for construction projects, elements and materials, labour, plant and equipment pricing for budgeting purposes.
Example: Construction annual price books
- Rawlinsons Construction Cost Guide is published annually and quarterly updates are issued. It is one of the largest databases in Australia, which includes detailed prices, Building Indices, Building Cost per m2, Elemental cost per unit and Comparative Costs.
- Cordell Construction Cost Index (CCCI) Australia and New Zealand is published by CoreLogic Australia and is a quarterly industry benchmark that tracks and monitors the movement of the residential market.
4.4.3 Technical Journals
Technical journals publish articles, studies and research findings related to the construction industry, including cost analysis, pricing strategies, and economic trends. Researchers, professionals and academics often rely on these publications for in-depth analysis.
Example: Technical journals
- Construction Economics and Building Journal published journal by AIQS
- Built Environmental Economist jointly published by AIQS and NZIQS
4.4.4 Market rates
Cost planners can seek quotations from subcontractors, suppliers and builders’ merchants to enhance the reliability and relevance of cost information.
Example: Market rates
Networking with cost consultants from different organisations and industry practitioners is another good but informal source of cost information. This helps gather the most recent and trending cost information.
Cost planners rely on readily accessible project cost information to ensure the accuracy and credibility of the cost-planning process. Utilising published cost data/information is favoured due to time constraints, the expenses linked with maintaining an extensive ‘in-house’ system, and the capability to aggregate costs across multiple projects, thus revealing true benchmark costs and avoiding ‘one-off’ outliers.
Despite the advantage of consistent, comparable data in the cost planning stage, published cost data typically only represent costs for normal or average projects. Therefore, caution should be exercised when using them, taking into account the unique aspects of the project and ensuring clarity regarding the inclusions and exclusions.
Exercise
Try out the following task to gain a deeper understanding of how these sources should be applied.
You have completed a Detailed Elemental Cost Plan and done the Building Analysis and come up with the following data for a multi-storey residential building: Building Rate ($/m2 GFA) is $3,280.
However, the price range given in a published source of cost information (e.g. Annual Price Book) is $2,250 to $2,850 for a multi-storey residential building. Explain the difference between these figures.
Note: Assume no time adjustments or location adjustments are required.
Answer
There may be elements designed outside the expected cost range – e.g. due to site conditions and unique design. Therefore, it’s better to keep the published cost information as an indicator and select the cost information derived from the Building Cost analysis developed using a recently completed for a similar project.
4.5 Application of cost information in cost planning stages
As discussed in Section 4.3, different types of cost information are required according to the cost planning stages. Figure 4.7 illustrates the cost information applied in the concept, schematic and detailed design stages.
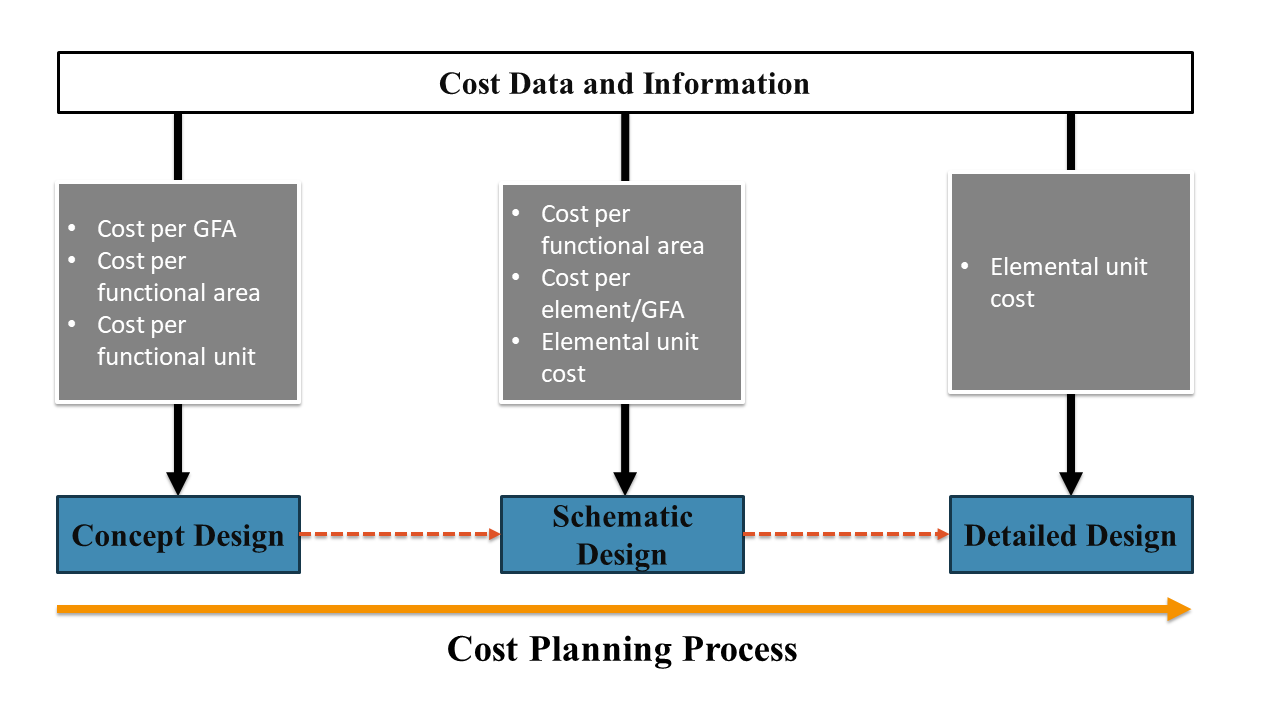
During the concept design stage, cost information used is related to the type, function and size of the project such as cost per GFA, cost per functional area, and cost per functional unit. Once the level of information increases at the schematic design stage, cost per functional area and cost per element/GFA are used. Finally, cost per element is applied at the detailed design stage.
